Market Overview
| Study Period | 2020 - 2031 |
|---|---|
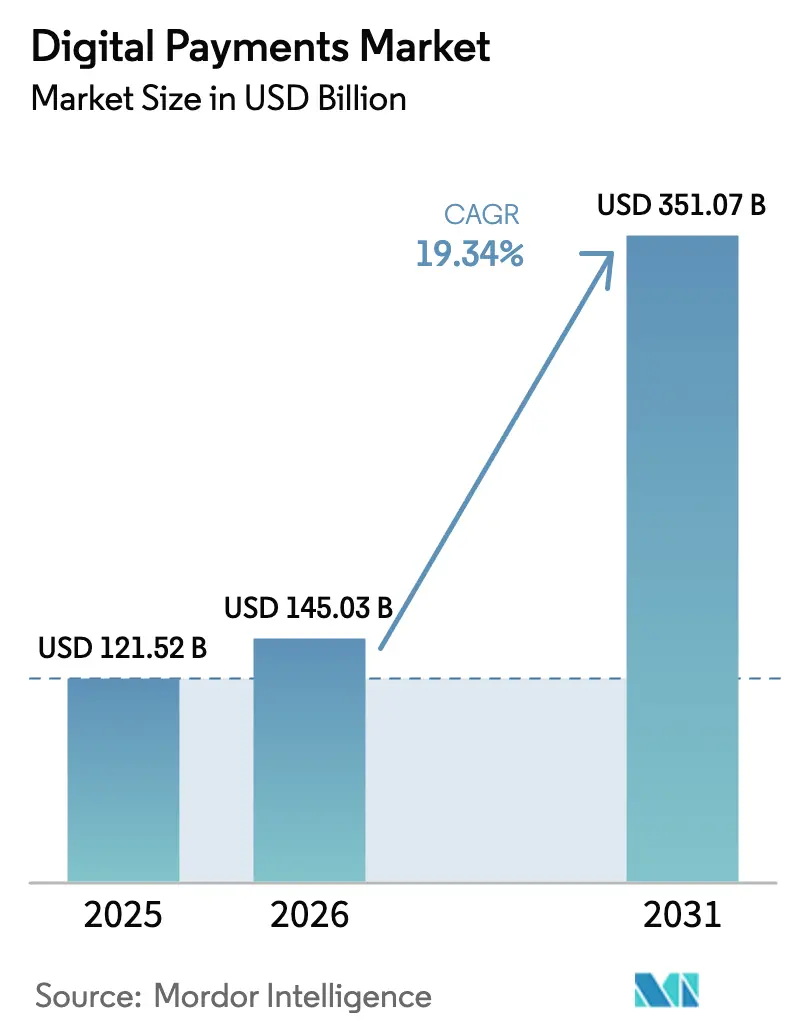
| Market Size (2026) | USD 145.03 Billion |
| Market Size (2031) | USD 351.07 Billion |
| Growth Rate (2026 - 2031) | 19.34% CAGR |
| Fastest Growing Market | Asia Pacific |
| Largest Market | Asia Pacific |
| Market Concentration | Medium |
Major Players *Disclaimer: Major Players sorted in no particular order Image © Mordor Intelligence. Reuse requires attribution under CC BY 4.0. | |
Digital Payments Market Analysis by Mordor Intelligence
The digital payments market size stands at USD 145.03 billion in 2026 and is projected to reach USD 351.07 billion by 2031, reflecting a 19.34% CAGR for the forecast period. Structural migration from card-centric rails to account-to-account instant settlement, QR-code wallets, and orchestration platforms is reshaping cost curves and approval performance. Regulatory mandates on tokenization and strong customer authentication in Europe are accelerating core-system modernization, while ISO 20022 data standards are unlocking richer transaction data that supports automated credit scoring. Across Asia-Pacific and South America, government-backed QR interoperability and zero-fee instant transfers are displacing cash and cards at unprecedented speed. Competitive dynamics are fragmenting as gateway-agnostic orchestration and wallet super-apps undercut legacy acquirers’ interchange revenues, yet incumbent card networks are defending share by acquiring open-banking and fraud-analytics capabilities.
Key Report Takeaways
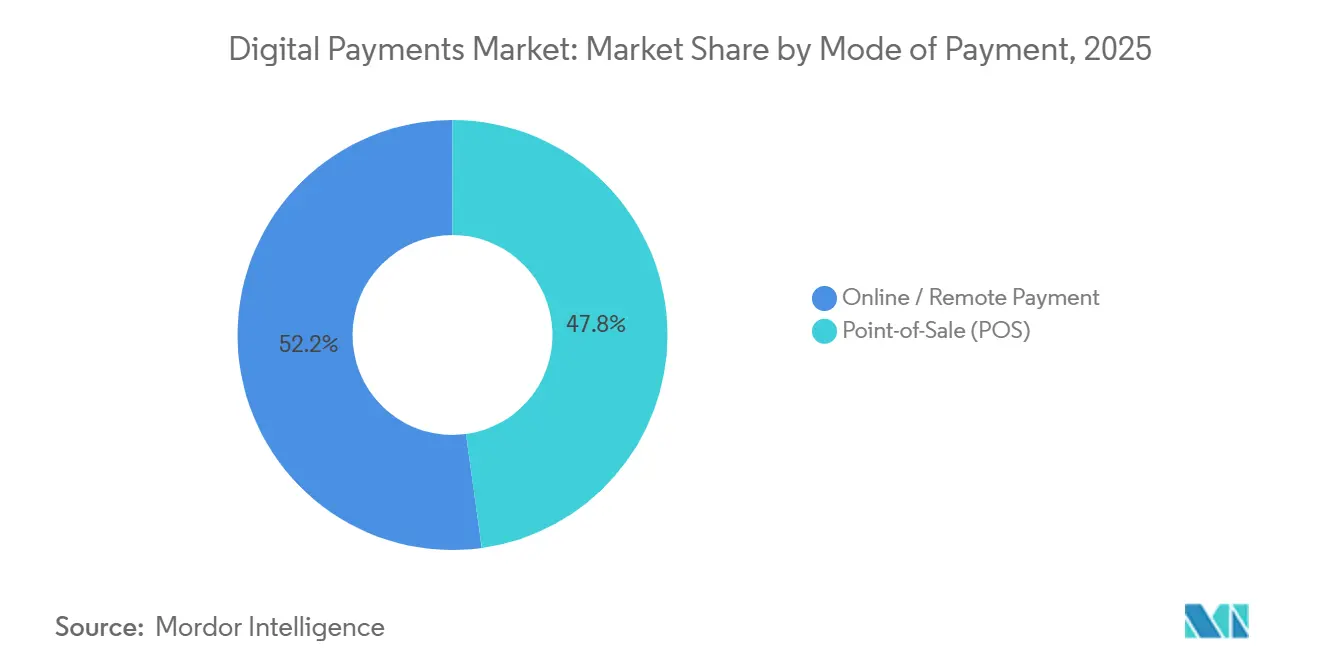
- By mode of payment, point-of-sale channels held 47.83% of the digital payments market share in 2025, while online and remote payments are advancing at a 20.39% CAGR through 2031.
- By component, solutions accounted for 67.82% of the digital payments market size in 2025 and are expanding at a 20.77% CAGR through 2031.
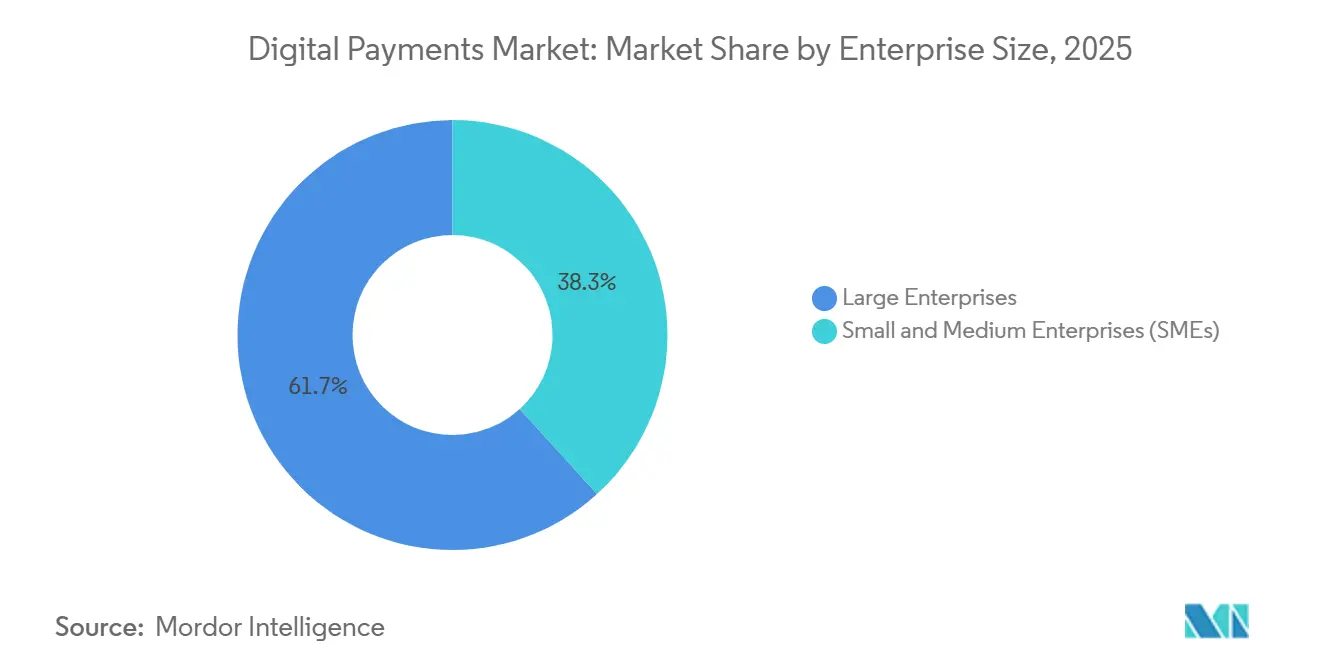
- By enterprise size, large enterprises led with 61.74% revenue share in 2025 of the digital payments market; small and medium enterprises are growing at a 20.56% CAGR to 2031.
- By end-user industry, retail and e-commerce commanded 34.72% of 2025 value of the digital payments market, whereas healthcare is set to grow at a 20.22% CAGR to 2031.
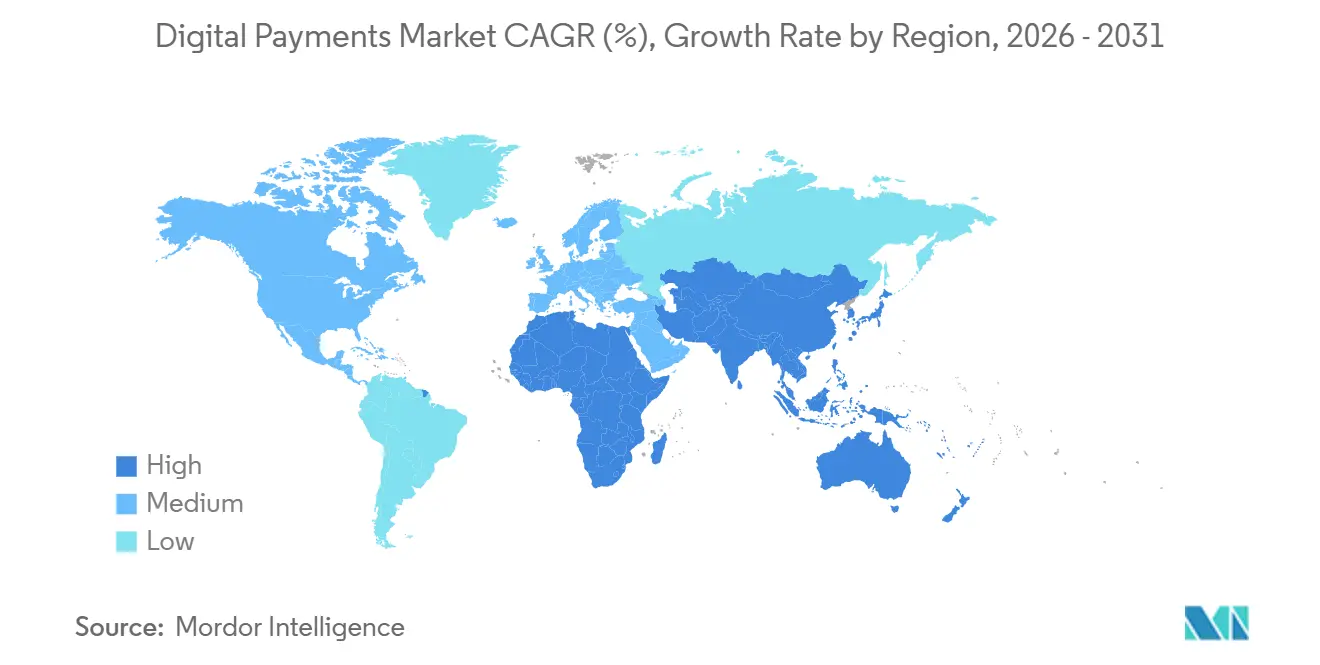
- By geography, Asia-Pacific captured 38.72% of global 2025 value of the digital payments market and is projected to rise at a 20.32% CAGR through 2031.
Note: Market size and forecast figures in this report are generated using Mordor Intelligence’s proprietary estimation framework, updated with the latest available data and insights as of January 2026.
Market Trends and Insights
Drivers Impact Analysis of Digital Payments Market*
| Driver | (~) % Impact on CAGR Forecast | Geographic Relevance | Impact Timeline |
|---|---|---|---|
| Surge in QR-code payments across Southeast Asia | +4.2% | ASEAN core (Indonesia, Thailand, Philippines, Vietnam), spillover to South Asia | Medium term (2-4 years) |
| EU tokenisation mandates boosting online security | +3.8% | Europe, with adoption spreading to North America and APAC | Short term (≤ 2 years) |
| Cross-border e-commerce demand for APMs in South America | +2.9% | South America (Brazil, Argentina, Chile), with linkages to North America | Medium term (2-4 years) |
| Instant payroll-disbursement schemes in GCC | +2.1% | Middle East (Saudi Arabia, UAE, Qatar), extending to South Asia labor corridors | Long term (≥ 4 years) |
| ISO 20022 data-rich messaging unlocking SME credit scoring | +3.5% | Global, with early gains in Europe, North America, and APAC financial hubs | Long term (≥ 4 years) |
| Source: Mordor Intelligence | |||
Surge In QR-Code Payments Across Southeast Asia
Government-led interoperability has scaled QR acceptance from urban malls to rural kiosks. Indonesia’s QRIS processed 18.6 billion transactions in 2025, a 47% year-on-year lift that confirms consumer comfort with wallet-to-wallet scans over card swipes. Thailand’s PromptPay reached near-universal urban merchant penetration during the same period, while the Philippines linked 52 banks and e-money issuers under InstaPay QR Ph, dropping merchant discount rates below 1%. Rapid adoption reflects smartphone ubiquity, rising fintech competition, and regulatory backing that allows micro-merchants to bypass costly POS hardware. Cross-border expansion, championed by the ASEAN Payment Connectivity framework, promises real-time settlements across all 10 member states by 2027, lowering remittance fees and opening new export corridors for cottage-industry sellers.[1]BANK INDONESIA, “QRIS Transaction Statistics 2025,” bi.go.id
EU Tokenisation Mandates Boosting Online Security
The European Commission’s Payment Services Directive 3 makes network tokens mandatory for all card-not-present transactions by January 2027. Merchants migrating to token vaults are already recording fraud-rate declines; Mastercard’s 2025 disclosures attribute USD 1.2 billion in annual European fraud savings to the shift. Visa processed 8 billion tokenised credentials in 2025, a 62% surge that illustrates rapid compliance action. Liability shifts transfer credential storage risk away from retailers, creating demand for gateway services that bundle token management with strong customer authentication flows. Although compliance costs weigh on mid-tier merchants, reduced chargebacks and higher authorization rates are improving overall gross margins.[2]EUROPEAN BANKING AUTHORITY, “Technical Standards on Payment Tokenisation,” eba.europa.eu
Cross-Border E-Commerce Demand For APMs In South America
Brazil’s Pix processed 42 billion instant transfers in 2025 and now pilots cross-border links with Argentina and Uruguay. Cart-abandonment data show 18-percentage-point improvements when merchants offer local APMs such as Pix, Mercado Pago, or bank transfers instead of international cards. Fintech funding rounds, including Ualá’s USD 300 million raise in 2025, underscore investor belief that localized checkout is indispensable to regional growth. Inter-American Development Bank research estimates 34% growth in South American cross-border e-commerce during 2025, propelled by platforms that merge currency conversion, tax calculation, and delivery into a single API layer.
Instant Payroll-Disbursement Schemes In GCC
Saudi Arabia, the UAE, and Qatar now require employers to route wages through licensed instant-payment rails. These mandates create predictable high-frequency transaction flows, encouraging banks and fintechs to layer earned-wage access, micro-savings, and insurance products onto salary streams. The UAE processed 890 million instant transactions in 2025, with payroll representing 22% of volume. Verified wage history improves credit access for gig and expatriate workers, cutting the informal economy’s share of GCC employment and broadening the addressable base for digital lending platforms.
Restraints Impact Analysis of Digital Payments Market*
| Restraint | (~) % Impact on CAGR Forecast | Geographic Relevance | Impact Timeline |
|---|---|---|---|
| Fragmented KYC rules in the Caribbean | -1.4% | Caribbean islands, with spillover to Central America | Medium term (2-4 years) |
| Rising CNP-fraud costs for mid-tier merchants | -2.7% | Global, with acute pressure in North America and Europe | Short term (≤ 2 years) |
| Carbon-footprint scrutiny of blockchain settlement layers | -1.1% | Global, with regulatory focus in Europe and institutional buyers in North America | Long term (≥ 4 years) |
| Source: Mordor Intelligence | |||
Fragmented KYC Rules In The Caribbean
Fifteen distinct regulatory regimes create onboarding obstacles for wallets and remittance providers, inflating compliance costs by up to 60%. FATF evaluations have flagged inconsistent due diligence as a money-laundering risk, prompting correspondent banks to retreat and pushing migrants toward informal channels. The World Bank’s remittance database shows an 8.9% average fee on USD 200 transfers to the region, nearly triple the Sustainable Development Goal target. Until policymakers harmonize identity frameworks or adopt regional sandboxes, fragmented oversight will cap scale economics and suppress digital uptake.
Rising CNP-Fraud Costs For Mid-Tier Merchants
Card-not-present fraud losses climbed to USD 9.3 billion in 2025, with mid-tier merchants shouldering 58% of the burden. Chargeback rates breached network thresholds, triggering higher interchange fees and forcing retailers to choose between investing in machine-learning defenses or curtailing online ambitions. Merchant Risk Council surveys indicate that 34% of mid-tier retailers plan to slow digital expansion, a response that constrains volume growth in home goods, apparel, and electronics segments. Without affordable fraud-risk engines, these sellers will struggle to match the authorization uplift enjoyed by orchestration-enabled enterprises.[3]MASTERCARD INCORPORATED, “Q4 2025 Earnings Call Transcript,” investor.mastercard.com
*Our forecasts treat driver/restraint impacts as directional, not additive. The impact forecasts reflect baseline growth, mix effects, and variable interactions.
Digital Payments Market Segment Analysis
By Mode of Payment:
Online Channels Gain As Pay-By-Bank Erodes Card DominancePoint-of-sale rails retained 47.83% of 2025 value, yet online and remote transactions are climbing at a 20.39% CAGR, solidifying their role as primary growth engines within the digital payments market. Instant pay-by-bank schemes in Europe and open-wallet QR codes in ASEAN allow merchants to avoid the 1.5-2.5% cost of card interchange, redirecting savings toward loyalty rebates or same-day settlement incentives. Digital wallets and static QR stickers eliminated hardware dependencies, giving micro-merchants a frictionless on-ramp to cashless acceptance. In North America and parts of Europe, contactless EMV cards are still favored, but the regulatory spotlight on interchange levels is nudging retailers to pilot account-to-account checkout buttons at scale. Open-banking variable recurring payments, authenticated via biometric prompts, are improving authorization certainty for subscription merchants, while tokenization across card rails is lifting approval rates by several percentage points, narrowing the gap between card and bank-led modes.
E-commerce checkout now fragments into three sub-flows, such as card-not-present, pay-by-bank, and wallet-hosted funding sources. The digital payments market is growing fastest in pay-by-bank, aided by U.K. regulators who reported an 18% share of online payments in 2025. Wallet giants such as PayPal, Apple Pay, and Google Pay captured 34% of European e-commerce volume as one-click authentication reduced abandonment. Card-not-present transactions retain scale but face margin compression from tokenization mandates and network liability shifts that reduce the risk premium formerly embedded in interchange.


By Component:
Orchestration Platforms Reshape The Solutions StackSolutions contributed 67.82% of 2025 revenue and are forecast to expand at a 20.77% CAGR, displacing single-processor arrangements across enterprise portfolios. Gateway-agnostic orchestration routes transactions through multiple rails, raising approval rates by 3-5 percentage points for cross-border merchants, a lift documented in 2025 investor disclosures. Processing and switching modules are consolidating under cloud-native specialists that blend authorization, clearing, and settlement into a unified codebase. Digital-wallet platforms posted 31% user growth, buoyed by super-apps bundling payment, loyalty, buy-now-pay-later, and micro-investment features into cohesive experiences.
Fraud-scoring engines form the fastest-growing sub-segment, expanding at 26% annually as regulatory scrutiny tightens and merchants outsource machine-learning analytics. Services captured 32.18% of 2025 value and are increasing at 17.8% as ISO 20022 migrations and PSD3 compliance drive multi-year implementation projects. The digital payments market share controlled by orchestration vendors will expand further as developers favor API-first capabilities that cut time-to-market for new payment methods.
By Enterprise Size:
SMEs Accelerate As Embedded Finance Lowers BarriersLarge enterprises held 61.74% of 2025 value, yet SMEs are scaling faster at a 20.56% CAGR, narrowing a historic capability gap. Flat-fee POS systems and SaaS plug-ins enable micro-shops to onboard in minutes, accept international wallets, and access working capital advances without collateral. Platform-as-a-service offerings expose the same fraud-model sophistication as global retailers, shrinking the authorization-rate delta by nearly 2 percentage points in 2025. Stripe estimated that 64% of its 8.2 million SME merchants expanded online sales primarily because cross-border methods became turnkey.
Embedded finance is pivotal to this shift. Invoicing software now bundles installment plans and instant payouts, while marketplace sellers tap escrow rails that release funds upon delivery confirmation. These feature sets were once confined to enterprises with proprietary tech teams, but pre-integrated APIs have democratized access across the digital payments industry. As SMEs proliferate, platform providers capture incremental margin from financing spreads and interchange rebates that banks previously pocketed.
By End-User Industry:
Healthcare Digitization Outpaces Retail MaturityRetail and e-commerce led with 34.72% market value in 2025, but growth is leveling as smartphone saturation and contactless cards reach ceiling effects in developed economies. Healthcare, growing at a 20.22% CAGR, is the fastest riser, driven by telemedicine, real-time copay collection, and integrated insurance adjudication. Regulatory tailwinds, including U.S. rules mandating electronic patient payment options, are accelerating the adoption of text-to-pay invoices and QR-code bills within hospital portals. Media and entertainment saw 19% volume growth thanks to subscription streaming and in-game micro-transactions that leverage one-click wallet authentication.
Hospitality rebounded to pre-pandemic payment volumes in 2025, adopting tap-to-phone and contactless kiosks at a rapid clip. Government, education, and utilities sectors are modernizing bill pay, with 41% of U.S. state and local bodies accepting wallet transactions by late 2025. The digital payments market is expanding across professional services, donations, and tuition platforms, tracking an 18.4% growth rate, proving that low-cost instant rails are viable even in historically check-oriented segments.
Geography Analysis
APAC Digital Payments Market
Asia-Pacific stands out as the largest regional contributor to the digital payments market, with 38.72% value share in 2025 and a forecast 20.32% CAGR that outpaces the global average. Government-mandated instant rails and QR standards accelerate merchant adoption among cash-centric micro-businesses. China’s wallet incumbents, while still dominant, face policy caps that open white space for interoperable schemes in Indonesia and Thailand. India’s UPI showcases that open-source switching combined with private-sector front ends can scale faster than proprietary wallets, especially when credit overlays link instant payments to small-ticket lending. Japan and South Korea are upgrading legacy card infrastructure, yet entrenched cash habits temper their curve relative to ASEAN peers.
Europe Digital Payments Market
Europe contributes a mature yet still expanding share to the digital payments market. PSD3 tokenization, the Digital Operational Resilience Act, and TARGET Instant Payment Settlement drive platform upgrades among banks. The U.K. leads in open-banking adoption, with variable recurring payments gaining traction for subscriptions and utility bills. Germany, France, Italy, and Spain are converging on instant credit transfers, though cross-border flows remain slowed by disparate KYC frameworks. The European Payments Council’s 89% bank participation rate in SEPA Instant by late 2025 indicates substantial progress toward end-to-end eurozone coverage.
The Americas and MEA Digital Payments Market
North America, South America, and the Middle East and Africa each play distinct but converging roles in the digital payments market trajectory. The United States is integrating FedNow rails into payroll and bill pay, Canada is live with Real-Time Rail, and Mexico’s CoDi adds QR acceptance points, albeit at a slower pace than Brazil’s Pix. South America’s notable regional CAGR underscores consumer hunger for fee-free instant transfers and localized APMs. In the GCC, wage protection mandates create recurring salaries that fuel ancillary credit and savings propositions, while central-bank digital currencies in Nigeria and South Africa are building nodes for future pan-African interoperability.

Competitive Landscape
The digital payments market is moderately fragmented, with the top 10 providers accounting for most of the 2025 transaction value. Incumbent card networks are executing defensive acquisitions of open-banking and orchestration assets, as evidenced by Visa’s USD 1 billion purchase of Tink and Mastercard’s buyout of Aiia. Stripe, Adyen, and Rapyd grow cross-border traction by merging gateways, fraud engines, and instant payout rails into a single API, yielding 3-5-percentage-point authorization uplifts for global merchants. Super-apps in Asia-Pacific bundle payments with day-to-day services, sustaining high user lock-in and driving double-digit wallet growth.
Purpose-built orchestration for vertical niches represents a fresh battleground. Healthcare payment plans, hospitality deposit holds, and government tax workflows demand compliance logic that generic gateways lack. Blockchain settlement layers, though scrutinized for carbon impact, secure footholds in high-value remittances and tokenized-asset transfers where real-time gross settlement offsets energy costs. Visa’s sustainability benchmark of 0.002 kilowatt-hours per transaction remains a yardstick that proof-of-stake protocols approach, but proof-of-work networks cannot. Embedded-finance facilitators such as Plaid processed 8 billion API calls in 2025, enabling developers to weave payments into non-financial apps and enlarging the ecosystem surface area.
Competitive intensity will accelerate as instant-rail adoption erodes interchange economics, prompting acquirers to refocus on value-added services. Fraud-prevention M&A, exemplified by Visa’s USD 280 million acquisition of Featurespace, integrates behavioral analytics into real-time authorization, shrinking false declines. Point-of-sale hardware is commoditizing; Fiserv’s 2025 Clover Flex 4 proves that tap-to-phone can eliminate separate card readers and slice hardware costs by 70%. Global providers will continue entering emerging-market corridors by buying local processors, such as Worldline’s 60% stake in Pine Labs for USD 1.5 billion, as growth gravitates toward Asia-Pacific and South America.
Digital Payments Industry Leaders
Paypal Holdings Inc.
Visa Inc.
Mastercard Incorporated (Mastercard)
Amazon Pay (Amazon.com Inc.)
Google Pay (Alphabet Inc.)
- *Disclaimer: Major Players sorted in no particular order
Digital Payments Market Companies Covered in this Report
- PayPal Holdings Inc.
- Visa Inc.
- Mastercard Incorporated (Mastercard)
- Amazon Pay (Amazon.com Inc.)
- Google Pay (Alphabet Inc.)
- Apple Pay (Apple Inc.)
- Stripe Inc.
- Adyen N.V.
- Fiserv Inc.
- FIS Inc. (Worldpay)
- Block Inc. (Square and Cash App)
- ACI Worldwide Inc.
- Ant Group (Alipay)
- Tencent Holdings Ltd. (WeChat Pay)
- Paytm (One97 Communications Ltd.)
- Rapyd Financial Networks Ltd.
- Nets Group (Nexi)
- Mollie B.V.
- Verifone Inc.
- Lightspeed Commerce Inc.
- Worldline SA
- Global Payments Inc.
- PayU Payments Pvt. Ltd.
- Airwallex Ltd.
- Wise plc

Recent Industry Developments in Digital Payments Market
- January 2026: Mastercard expanded its Multi-Token Network to 32 countries, enabling merchants to store a single network token that self-updates on card reissuance and reduces subscription payment failures.
- December 2025: Stripe launched Stripe Treasury in Brazil with Pix integration, allowing platforms to hold and move Brazilian real balances without local banking licenses.
- November 2025: Visa completed a USD 280 million acquisition of Featurespace, embedding adaptive behavioral analytics into real-time authorization.
- October 2025: PayPal partnered with Shopify to roll out Fastlane, a one-click checkout for 150 million PayPal users on Shopify storefronts.


Digital Payments Market Report Scope and Research Methodology
Market Definition and Coverage
Our study defines the digital payments market as all consumer-facing transactions settled through online payment gateways, direct debit rails, or mobile point-of-sale readers, where money moves electronically rather than in physical cash. We capture revenues earned by solution vendors and service providers that enable these flows, split by payment mode, component, enterprise size, industry vertical, and region.
Scope exclusion: enterprise-to-enterprise settlement platforms, crypto-asset trading, and purely card-issuing fees lie outside this assessment.
Segments Covered in This Report
- By Mode of Payment
- Point-of-Sale (POS)
- Card Rails
- Account-to-Account / Instant
- Digital Wallet / QR
- Online / Remote Payment
- Card-Not-Present (CNP)
- Pay-by-Bank
- Digital Wallets
- Point-of-Sale (POS)
- By Component
- Solutions
- Gateways and Orchestration
- Processing and Switching
- Digital Wallet Platforms
- Fraud and Risk Engines
- Other Specialised Modules
- Services
- Consulting and Integration
- Managed Support and Settlement
- Solutions
- By Enterprise Size
- Large Enterprises
- Small and Medium Enterprises (SMEs)
- By End-user Industry
- Retail and E-commerce
- Media and Entertainment
- Healthcare
- Hospitality and Travel
- Government, Education and Utilities
- Other End-user Industries
- By Geography
- North America
- United States
- Canada
- Mexico
- South America
- Brazil
- Argentina
- Rest of South America
- Europe
- Germany
- United Kingdom
- France
- Italy
- Spain
- Rest of Europe
- Asia-Pacific
- China
- Japan
- India
- South Korea
- ASEAN
- Rest of Asia-Pacific
- Middle East and Africa
- Middle East
- Saudi Arabia
- United Arab Emirates
- Rest of Middle East
- Africa
- South Africa
- Nigeria
- Rest of Africa
- Middle East
- North America
Data Sources, Market Sizing, and Validation
Desk Research
We began by mapping the universe of digital payment flows using open datasets such as the BIS Red Book, the World Bank Global Findex, IMF Payment Statistics, and central-bank dashboards from the Federal Reserve and the European Central Bank. Company 10-Ks, investor presentations, and e-commerce association white papers added channel-specific volumes, while paid repositories like D&B Hoovers and Dow Jones Factiva helped our analysts size vendor revenue pools. Public procurement portals and patent libraries (Questel) provided additional visibility into pipeline projects and innovation trends. The sources listed here are illustrative; many other publications were reviewed during evidence gathering and cross-checks.
Primary Research
To validate secondary signals, our team interviewed payment gateway executives, acquirers, fintech founders, and merchant treasurers across North America, Europe, and Asia-Pacific. Short surveys with retail SMEs and healthcare providers clarified adoption rates, transaction mixes, and average service fees, letting us adjust raw desk figures for real-world acceptance gaps.
Market-Sizing & Forecasting
The baseline value is first estimated top-down through a transaction-value reconstruction that links household e-commerce spending, in-store card penetration, and smartphone wallet share. Results are then benchmarked against selective bottom-up lenses (sampled provider revenue × average take-rate, channel checks on monthly active users) to spot over- or under-counts. Key market fingerprints that feed the model include smartphone penetration, contactless card circulation, interchange-fee regulation timelines, real-time payment rail rollout, cross-border e-commerce growth, and fraud-loss ratios. A multivariate regression framework, stress-tested under conservative, base, and optimistic scenarios, projects demand through 2030. Coefficients are aligned with consensus views gathered during expert calls. Where granular supplier data were sparse, we interpolated using region-specific adoption curves and price-volume elasticities.
Data Validation & Update Cycle
Before sign-off, Mordor analysts rerun variance checks against macro payment indicators, flag anomalies, and peer-review each worksheet. Models refresh annually, with mid-cycle updates triggered by material regulatory or technology shifts. Each report is re-read before delivery so clients receive the most current view.
How Mordor Intelligence's Digital Payments Market Size Compares to Other Published Estimates
Published estimates often diverge because firms anchor on different revenue streams, user cohorts, and refresh cadences.
Our disciplined scope and yearly rebuild minimize those inconsistencies.
Benchmark comparison
| Market Size | Anonymized source | Primary gap driver |
|---|---|---|
| USD 121.53 B (2025) | Mordor Intelligence | - |
| USD 170.24 B (2025) | Global Consultancy A | Includes B2B and digital remittance flows; relies solely on vendor revenue disclosures |
| USD 137.04 B (2025) | Industry Analytics B | Excludes mobile POS wallets and uses survey extrapolation without de-duplication |
| USD 130.49 B (2025) | Trade Journal C | Counts upfront software licenses as transaction revenue and locks FX rates to 2023 averages |
Taken together, the comparison shows that Mordor's balanced definition, dual-path modeling, and frequent updates yield a dependable baseline that decision-makers can trace back to clear variables and repeatable steps.


Key Questions Answered in the Report
How fast is the digital payments market projected to grow through 2031?
It is forecast to expand at a 19.34% CAGR, reaching USD 351.07 billion by 2031.
Which region contributes the largest share to global digital payments value?
Asia-Pacific held 38.72% of 2025 value and is expected to maintain leadership as QR interoperability and instant rails accelerate.
Why are orchestration platforms gaining popularity among merchants?
They route transactions across multiple gateways and payment rails, boosting authorization rates by up to 5 percentage points and lowering processing costs.
What is driving rapid digital payment adoption among small and medium enterprises?
Embedded-finance platforms bundle acceptance, working-capital advances, and compliance features into plug-and-play APIs that shorten onboarding to minutes.
Which end-user vertical is set to outpace others over the forecast period?
Healthcare, supported by telemedicine, real-time copay collection, and regulatory mandates for electronic patient payments, is rising at a 20.22% CAGR.
Page last updated on:


