Digital Front Door Market Size and Share
Market Overview
| Study Period | 2020 - 2031 |
|---|---|
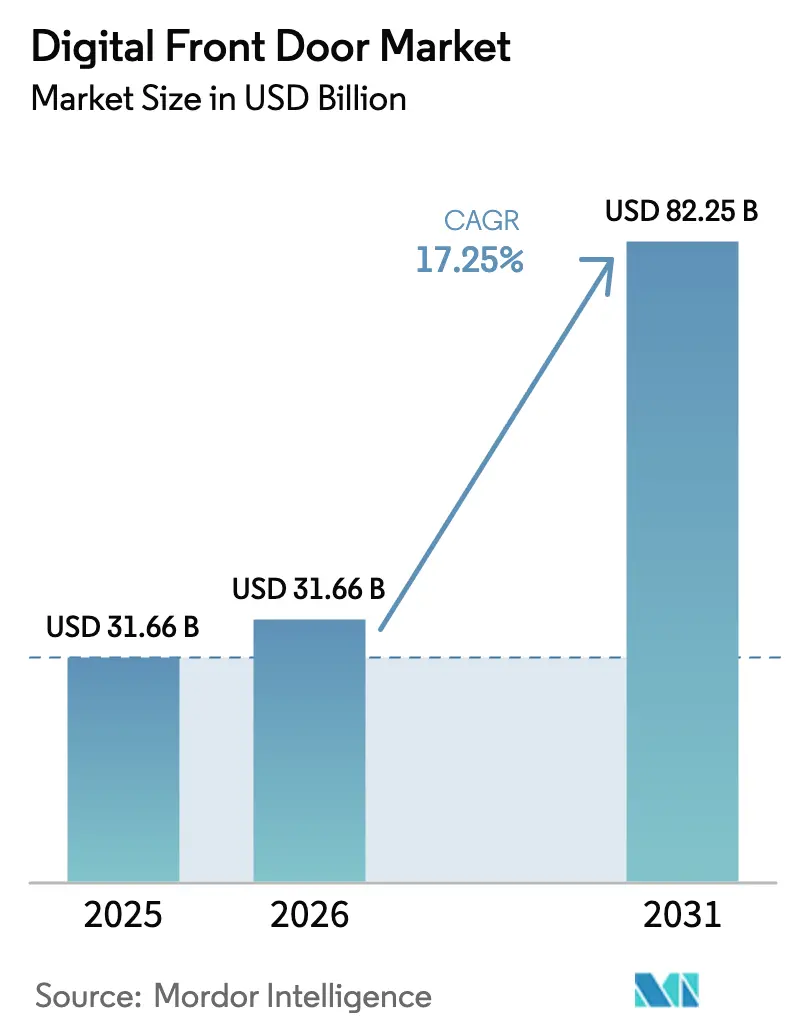
| Market Size (2026) | USD 31.66 Billion |
| Market Size (2031) | USD 82.25 Billion |
| Growth Rate (2026 - 2031) | 17.25% CAGR |
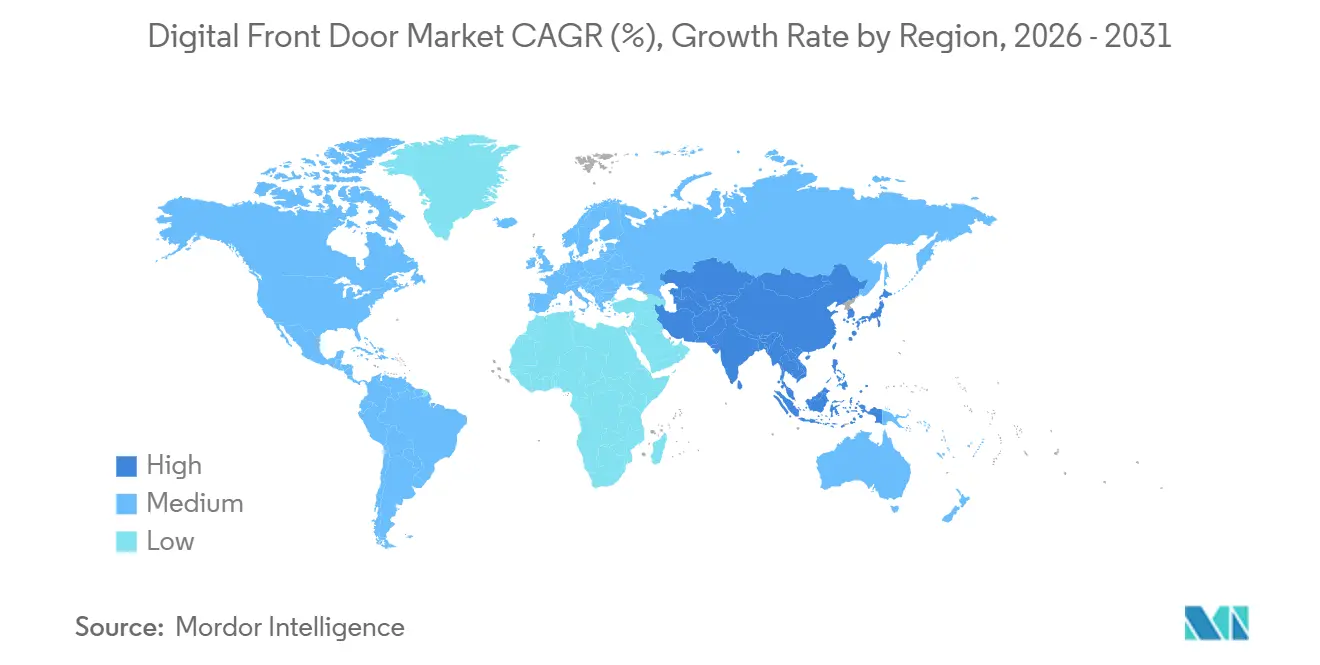
| Fastest Growing Market | Asia Pacific |
| Largest Market | North America |
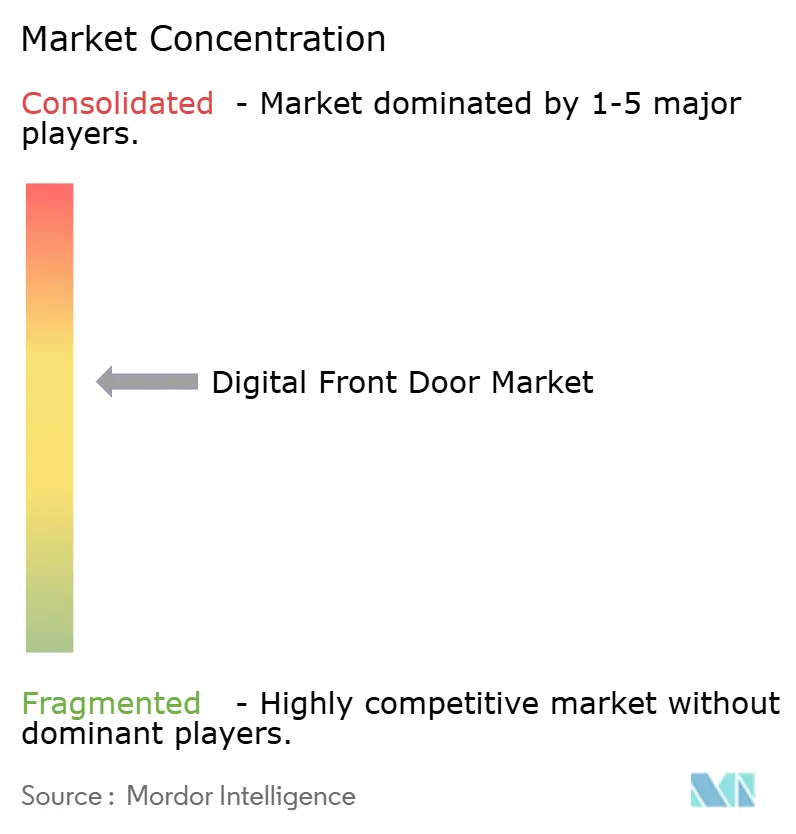
| Market Concentration | Medium |
Major Players *Disclaimer: Major Players sorted in no particular order Image © Mordor Intelligence. Reuse requires attribution under CC BY 4.0. | |
Digital Front Door Market Analysis by Mordor Intelligence
The Digital Front Door Market size is projected to expand from USD 31.66 billion in 2025 and USD 31.66 billion in 2026 to USD 82.25 billion by 2031, registering a CAGR of 17.25% between 2026 to 2031.
Momentum reflects the convergence of scheduling, virtual visits, triage, and payments on a single consumer-grade interface, an approach providers now view as essential rather than optional. Heightened payer and CMS interoperability requirements are shortening project timelines, while retail health entrants are raising the bar for same-day access and transparent pricing. Platform vendors are responding with API-first roadmaps that let hospitals plug new modules into existing patient portals without a rip-and-replace cycle. Cloud infrastructure, conversational AI, and FHIR-native data pipes form the technical backbone that keeps experiences consistent across web, mobile, and voice channels.
Key Report Takeaways
- By component, software led with 57.55% of the digital front door market share in 2025; services are advancing at an 18.25% CAGR through 2031.
- By deployment mode, cloud captured 65.23% of the digital front door market size in 2025 and is growing at a 19.15% CAGR into 2031.
- By application, appointment management accounted for 35.15% of revenue in 2025, while digital triage and chatbots are expanding at a 22.51% CAGR through 2031.
- By end user, hospitals and health systems accounted for 48.35% of 2025 spending; retail and urgent-care centers recorded the fastest 19.11% CAGR through 2031.
- By geography, North America retained 42.25% of revenue in 2025, and Asia-Pacific posts the highest 19.02% CAGR over 2026-2031.
Note: Market size and forecast figures in this report are generated using Mordor Intelligence’s proprietary estimation framework, updated with the latest available data and insights as of January 2026.
Global Digital Front Door Market Trends and Insights
Drivers Impact Analysis*
| Driver | (~) % Impact on CAGR Forecast | Geographic Relevance | Impact Timeline |
|---|---|---|---|
| Accelerated Telehealth Adoption Post-COVID-19 | +4.2% | Global, with peak gains in North America and Europe | Medium term (2-4 years) |
| Regulatory Mandates for Patient-Access APIs & Data-Sharing | +3.8% | North America, EU (GDPR interoperability provisions) | Short term (≤ 2 years) |
| Consumer Demand for Omnichannel Convenience | +3.1% | Global, led by urban markets in APAC and North America | Medium term (2-4 years) |
| Smartphone & Broadband Proliferation | +2.6% | APAC core, spill-over to MEA and South America | Long term (≥ 4 years) |
| API-Based Payer-Provider Data Exchange Unlocking Triage Workflows | +2.3% | North America, early adoption in Australia and Singapore | Medium term (2-4 years) |
| Retail & Employer Clinics Deploying Unified Entry Points | +1.5% | North America, emerging in Brazil and GCC markets | Long term (≥ 4 years) |
| Source: Mordor Intelligence | |||
Accelerated Telehealth Adoption Post-COVID-19
Telehealth volumes stabilized in the low teens among total outpatient encounters in 2024, creating a permanent digital entry point that now feeds larger omnichannel programs. Hospitals using Epic’s embedded video tool retained 19% more patients than peers reliant on stand-alone links. Payers waive co-pays for virtual first touches, boosting member loyalty and funneling traffic to aligned networks. Vendors capitalize by bundling scheduling, intake, consultation, and follow-up into a single workflow that mirrors e-commerce norms. This dynamic lifts the digital front door market as organizations view cohesive experiences, not isolated telehealth, as the competitive differentiator.
Regulatory Mandates for Patient-Access APIs and Data-Sharing
CMS can now fine Medicare Advantage plans that fail to release claims and clinical data through FHIR within tight timelines, pushing payers to open their systems[1]Office of the National Coordinator for Health Information Technology, “Updated Guidance on Patient Data Access and Information Blocking,” healthit.gov. The rule also forbids hospitals from blocking third-party apps, creating fertile ground for independent portals. In the European Union, the forthcoming Health Data Space adds a cross-border portability layer, intensifying compliance pressure. Vendors that meet these mandates win deals because buyers prefer turnkey solutions over in-house builds. As more endpoints expose real-time lab results, medications, and slots, the digital front door market becomes more useful, spurring consumer adoption.
Consumer Demand for Omnichannel Convenience
A 2024 HIMSS survey reported that 68% of U.S. adults would switch providers for better digital access[2]Healthcare Information and Management Systems Society, “Consumer Digital Health Survey 2024,” himss.org . Younger cohorts prefer self-service scheduling, forcing hospitals to synchronize web, mobile, kiosk, and voice menus. Oracle Health clients that adopted its upgraded portal cut no-show rates by 22%. Retail disruptors like Amazon Clinic deliver same-day virtual visits plus doorstep pharma fulfilment, resetting expectations. Competition drives incumbent systems to modernize, thereby expanding the digital front door market.
Smartphone and Broadband Proliferation
APAC nations ride 5G rollouts and low-cost devices to push virtual care into previously offline regions. India’s health ID scheme surpassed 450 million users in 2024, opening a massive addressable base. Chinese regulators require tertiary hospitals to offer online booking, fueling platforms that process hundreds of millions of consultations. Governments in MEA and South America replicate these playbooks, though infrastructure gaps temper early momentum. The cumulative connectivity lift supports long-run adoption and keeps the digital front door market on double-digit growth.
Restraints Impact Analysis*
| Restraint | ()~% Impact on CAGR Forecast | Geographic Relevance | Impact Timeline |
|---|---|---|---|
| Data-Privacy & Cybersecurity Concerns | -2.1% | Global, acute in EU (GDPR) and U.S. (HIPAA enforcement) | Short term (≤ 2 years) |
| Interoperability Gaps across Disparate EHRs | -1.8% | Global, most severe in fragmented markets (India, Brazil) | Medium term (2-4 years) |
| Digital-App Fatigue Reducing Sustained Engagement | -1.4% | North America and Europe, emerging in urban APAC markets | Medium term (2-4 years) |
| Unclear ROI amid Margin Compression & Multi-Vendor Costs | -1.2% | Global, most acute in U.S. health systems with thin margins | Short term (≤ 2 years) |
| Source: Mordor Intelligence | |||
Data-Privacy and Cybersecurity Concerns
HHS logged 725 large breaches affecting 133 million people in 2024, eroding trust in patient-facing apps[3]U.S. Department of Health and Human Services Office for Civil Rights, “Breach Portal 2024,” hhs.gov. GDPR fines of up to 4% of revenue deter smaller vendors from entering the European market. Behavioral-health and reproductive-care users show the highest reluctance, with 38% withholding data in one JAMA Network Open study. Hospitals react by prolonging procurement cycles and tightening risk scoring, which delays deployments and constrains near-term revenue in the digital front door market.
Interoperability Gaps Across Disparate EHRs
ONC reported that only 42% of U.S. hospitals could fully integrate external records without manual steps in 2024[4]Office of the National Coordinator for Health Information Technology, “Annual Report on Health IT 2024,” healthit.gov . Vendors still build and maintain hundreds of custom connectors, inflating cost and time-to-value. Fragmentation is sharper in India and Brazil, where private facilities run proprietary systems that seldom expose structured APIs. Although FHIR norms set a baseline, variable implementations require continual mapping work, tempering the economics of scale for the digital front door industry. Progress is steady but the drag remains material through the medium term.
*Our forecasts treat driver/restraint impacts as directional, not additive. The impact forecasts reflect baseline growth, mix effects, and variable interactions.
Segment Analysis
By Component: Services Gain as Implementation Complexity Rises
Software accounted for 57.55% of 2025 revenue, underscoring hospitals’ initial focus on platform licenses that deliver visible functionality quickly. As workflows mature, buyers see that lasting impact requires redesign, governance, and analytics, a realization that fuels an 18.25% CAGR for services through 2031. Advisory firms orchestrate multi-vendor stacks, rationalize API layers, and run continuous A/B tests to keep adoption high. That recurring engagement converts one-time licenses into higher lifetime value, thereby increasing the total addressable digital front door market. The trend favors consultancies able to bridge clinical insight with consumer design, widening the moat against purely technical integrators.
Services also resonate with mid-size systems that lack internal SMEs. Providers enlist partners to manage change-management sprints, clinician training, and KPI dashboards that link consumer behavior to value-based reimbursements. Epic and Oracle upsell their own professional services, but health systems still tap neutral advisors for complex environments that span multiple EHRs. This dual-sourcing pattern broadens the services pool and diversifies the digital front door industry revenue mix.


By Deployment Mode: Cloud Dominance Driven by Interoperability and Scalability
Cloud deployments captured 65.23% of the digital front door market share in 2025, as health systems prioritized elastic compute to handle traffic spikes triggered by real-time APIs. The mode grows at 19.15% CAGR because capital-intensive on-premise stacks cannot scale without downtime. CMS rules indirectly nudge adopters toward the cloud by setting performance standards that most legacy data centers cannot meet cost-effectively. Even security-conscious academic medical centers adopt hybrid approaches, keeping PHI on local servers while hosting portals in regional cloud zones that comply with sovereignty requirements.
The commercial cloud model also eases attainment of ISO 27001 and HITRUST certifications because hyperscalers amortize compliance across thousands of customers. Predictable subscription fees align with tightening margins, helping CFOs avoid capex spikes. Vendors exploit shared infrastructure to push weekly upgrades, a cadence on-premise clients rarely tolerate. These dynamics reinforce buyers' confidence that the cloud is the default path and sustain double-digit growth in the digital front door market.
By Application: Digital Triage Surges as Payers and Providers Seek Cost Deflection
Appointment management still accounts for the largest slice at 35.15% because it solved an immediate call-center pain point. Yet chatbots and AI symptom checkers are growing fastest at a 22.51% CAGR, reflecting payer pressure to avoid low-acuity in-person visits. A 2024 JAMIA study found 14% fewer unnecessary visits after integrating AI triage, directly improving the medical loss ratio. Hospitals pilot hybrid models that escalate complex cases to live navigators, boosting completion rates and trust. Vendors that combine structured triage with seamless hand-offs enjoy stickier contracts and greater upsell potential, thereby expanding the overall digital front door market.
Payment collection modules rise as deductibles climb, prompting consumers to seek upfront cost clarity. Phreesia processed USD 18.3 billion in transactions during 2024 by embedding card-on-file prompts at check-in. Virtual consultation volumes plateau, yet tools now embed longitudinal care plans that elevate chronic-care engagement. The mosaic of expanded functions sustains cross-selling and lifts average revenue per customer inside the digital front door market.
By End-User: Retail and Urgent-Care Centers Disrupt Traditional Access Models
Hospitals and health systems accounted for 48.35% of spending in 2025, reflecting large site counts and strict CMS requirements. Retail clinics, however, race ahead with a 19.11% CAGR as CVS, Walgreens, and Amazon integrate scheduling, triage, and prescription pickup into unified apps. The consumer-centric model siphons insured traffic from primary-care offices, prompting incumbents to accelerate upgrades or lose market share. Insurers embed digital front doors into member portals to coax usage toward in-network options; Anthem’s Sydney Health logged 47 million interactions in 2024, with 62% completing triage before care.
Independent physician practices trail because many rely on practice-management vendors that only recently opened APIs. The American Medical Association noted that 38% of clinics offer online scheduling, compared with 72% of hospital-owned groups. As turnkey SaaS portals drop in price, even smaller practices enter the digital front-door market, expanding the long-tail opportunity. Direct-to-consumer symptom apps form a nascent but growing category, though monetization hinges on ad-supported or pay-per-match models rather than subscriptions.


Geography Analysis
North America retained 42.25% of revenue in 2025 as deep EHR penetration and CMS enforcement elevated interoperability stakes. U.S. health systems shift from platform rollouts to optimization cycles that knit ambulatory, acute, and post-acute sites into a single fabric. Canada is focusing on harmonizing provincial portals under a national blueprint that aims to achieve universal patient access by 2027. Mexico sees slower uptake due to persistent rural broadband gaps, but private hospital chains leverage digital front doors to attract medical tourists.
Europe grows steadily on the back of the European Health Data Space and strong national programs. Germany’s electronic record activation rate jumped to 68% in 2024 after Gematik simplified sign-up, accelerating the local digital front-door market. The United Kingdom’s NHS App counted 35 million active users in 2024, proving that large-scale consumer engagement is achievable. Interoperability with private providers remains uneven, which limits full-journey experiences.
Asia-Pacific registers the fastest 19.02% CAGR as smartphone ubiquity meets government mandates. India’s 450 million health IDs create a massive pool for third-party apps, though private hospital integration is still below 15%. China compels tertiary hospitals to offer online scheduling, pushing platforms such as WeDoctor to 280 million annual consultations. Australia’s My Health Record opens secure APIs to private insurers, and request volume rose 140% in 2024. GCC countries fund national virtual-care hubs, while Brazil leads South America with 42% of private hospitals offering portals.

Competitive Landscape
The digital front door market is moderately fragmented, with incumbent EHR vendors bundling access modules and specialized firms filling usability gaps. Epic’s MyChart sits inside more than 1,200 U.S. systems and gains stickiness through embedded labs, messaging, and video visits. Oracle Health replicates the strategy with Cerner Millennium runs on cloud-native APIs that encourage third-party extensions. Yet point solutions such as Phreesia excel at high-conversion intake and payment flows, processing transactions for 2,300 organizations.
Retail giants change the chessboard by funneling pharmacy, primary care, and benefits into proprietary ecosystems. CVS Health tied MinuteClinic, specialty pharmacy, and at-home labs inside one mobile journey, reporting 31% growth in visit volume. Amazon harnesses logistics and Prime membership to promise medication delivery within two days. Their moves force hospitals to match consumer features or risk churn among commercially insured patients who cross-shop for convenience.
Strategic plays center on vertical and horizontal expansion. Payers acquire telehealth firms to lock in downstream utilization, while AI startups like HYRO.AI handle 12 million voice interactions to relieve call centers. Technology differentiation shifts toward predictive nudges and natural language chat that personalize journeys. Security posture is a gating factor; after several breaches, buyers demand ISO and HITRUST audits before signing multiyear deals. These forces together shape a competitive field where no single vendor yet holds outsized power.
Digital Front Door Industry Leaders
Amwell
Epic Systems
Oracle Health (Cerner)
Teladoc Health
Veradigm (Allscripts)
- *Disclaimer: Major Players sorted in no particular order

Recent Industry Developments
- October 2025: Yosi Health launched an AI Voice Agent that automates phone, SMS, and web chat across intake and follow-up.
- August 2025: NHS London reported sustained migration from telephone lines to its digital front door for primary-care access.


Global Digital Front Door Market Report Scope
As per the report's scope, the digital front door refers to a unified, patient‑centric digital entry point into healthcare services. It integrates tools such as patient portals, mobile apps, chatbots, and telehealth platforms to streamline access, scheduling, communication, and care navigation. By offering a seamless digital experience, it improves patient engagement, reduces administrative friction, and enhances overall healthcare delivery.
The digital front door market segmentation includes components, deployment modes, applications, end users, and geography. By components, the market is segmented into software and services. By deployment mode, the market is segmented into cloud-based, on-Premise, and hybrid. By application, the market is segmented into appointment management, patient engagement, virtual consultation, digital triage & chatbots, billing & payment, and care navigation & way-finding. By end-user, the market is segmented into hospitals & health systems, clinics & physician practices, payers & insurance companies, patients / individuals, and retail & urgent-care centers. By geography, the market is segmented into North America, Europe, Asia-Pacific, the Middle East and Africa, and South America. The market report also covers estimated market sizes and market trends for 17 countries across major regions worldwide. The report offers market value (in USD) for the above segments.
| Software |
| Services |
| Cloud-based |
| On-Premise |
| Hybrid |
| Appointment Management |
| Patient Engagement |
| Virtual Consultation |
| Digital Triage & Chatbots |
| Billing & Payment |
| Care Navigation & Way-finding |
| Hospitals & Health Systems |
| Clinics & Physician Practices |
| Payers & Insurance Companies |
| Patients / Individuals |
| Retail & Urgent-care Centers |
| North America | United States |
| Canada | |
| Mexico | |
| Europe | Germany |
| United Kingdom | |
| France | |
| Italy | |
| Spain | |
| Rest of Europe | |
| Asia-Pacific | China |
| India | |
| Japan | |
| Australia | |
| South Korea | |
| Rest of Asia-Pacific | |
| Middle East and Africa | GCC |
| South Africa | |
| Rest of Middle East and Africa | |
| South America | Brazil |
| Argentina | |
| Rest of South America |
| By Component | Software | |
| Services | ||
| By Deployment Mode | Cloud-based | |
| On-Premise | ||
| Hybrid | ||
| By Application | Appointment Management | |
| Patient Engagement | ||
| Virtual Consultation | ||
| Digital Triage & Chatbots | ||
| Billing & Payment | ||
| Care Navigation & Way-finding | ||
| By End-User | Hospitals & Health Systems | |
| Clinics & Physician Practices | ||
| Payers & Insurance Companies | ||
| Patients / Individuals | ||
| Retail & Urgent-care Centers | ||
| By Geography | North America | United States |
| Canada | ||
| Mexico | ||
| Europe | Germany | |
| United Kingdom | ||
| France | ||
| Italy | ||
| Spain | ||
| Rest of Europe | ||
| Asia-Pacific | China | |
| India | ||
| Japan | ||
| Australia | ||
| South Korea | ||
| Rest of Asia-Pacific | ||
| Middle East and Africa | GCC | |
| South Africa | ||
| Rest of Middle East and Africa | ||
| South America | Brazil | |
| Argentina | ||
| Rest of South America | ||


Key Questions Answered in the Report
How fast is the digital front door market growing between 2026 and 2031?
The market expands at a 17.25% CAGR, moving from USD 31.66 billion in 2026 to USD 82.25 billion by 2031.
Which application is rising quickest in adoption?
Digital triage and chatbot modules grow at 22.51% CAGR because payers and providers use them to steer patients away from costly in-person visits.
Why is cloud deployment preferred over on-premise options?
Cloud holds 65.23% of revenue in 2025 and rises at 19.15% CAGR thanks to scalable API throughput, lower capex, and streamlined HITRUST and ISO audits.
Which region delivers the highest future growth?
Asia-Pacific leads with a 19.02% CAGR as governments in India, China, and Australia combine smartphone ubiquity with national telehealth mandates.
How are retail clinics influencing the competitive landscape?
Chains such as CVS and Walgreens integrate scheduling, triage, and pharmacy in one app, capturing consumers who value omnichannel convenience and pressuring hospitals to accelerate digital upgrades.
Page last updated on:


