Dental Gypsum Market Size and Share
Market Overview
| Study Period | 2020 - 2031 |
|---|---|
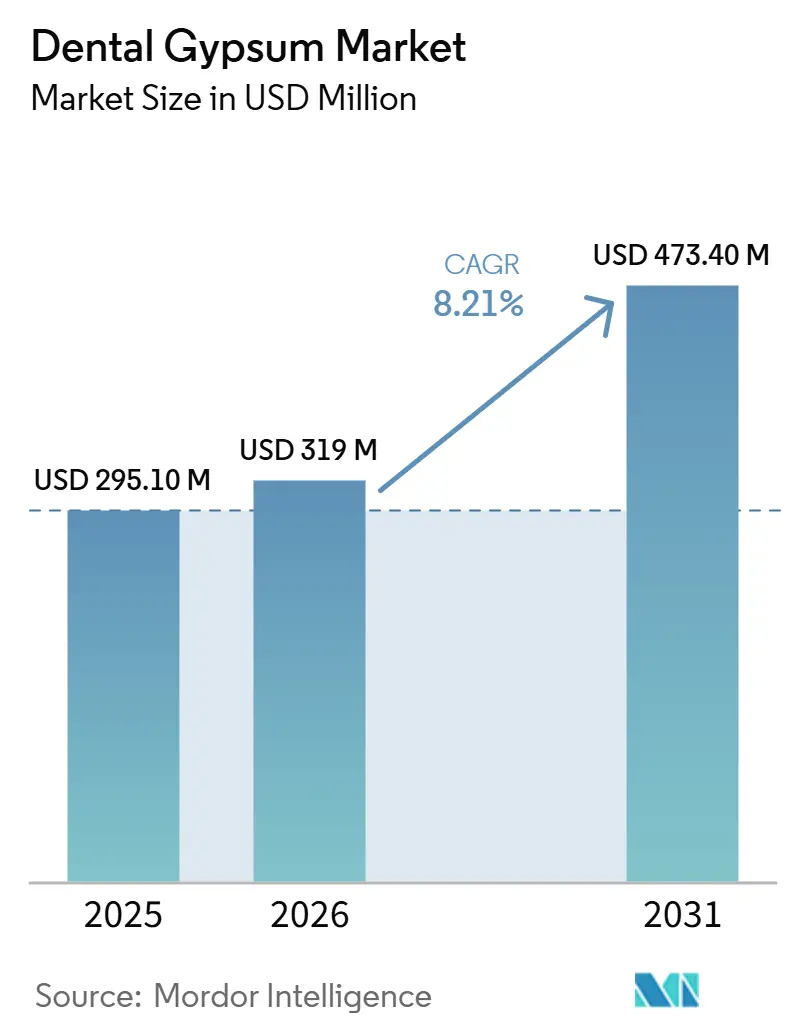
| Market Size (2026) | USD 319 Million |
| Market Size (2031) | USD 473.40 Million |
| Growth Rate (2026 - 2031) | 8.21% CAGR |
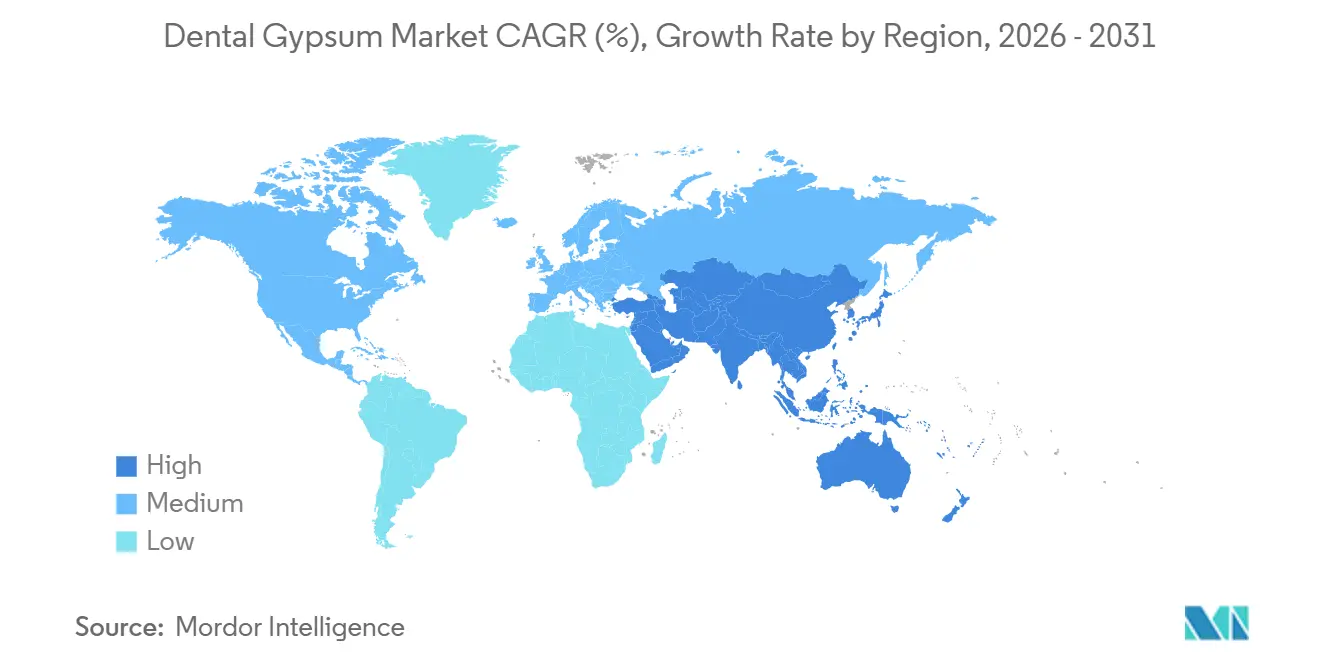
| Fastest Growing Market | Asia Pacific |
| Largest Market | North America |
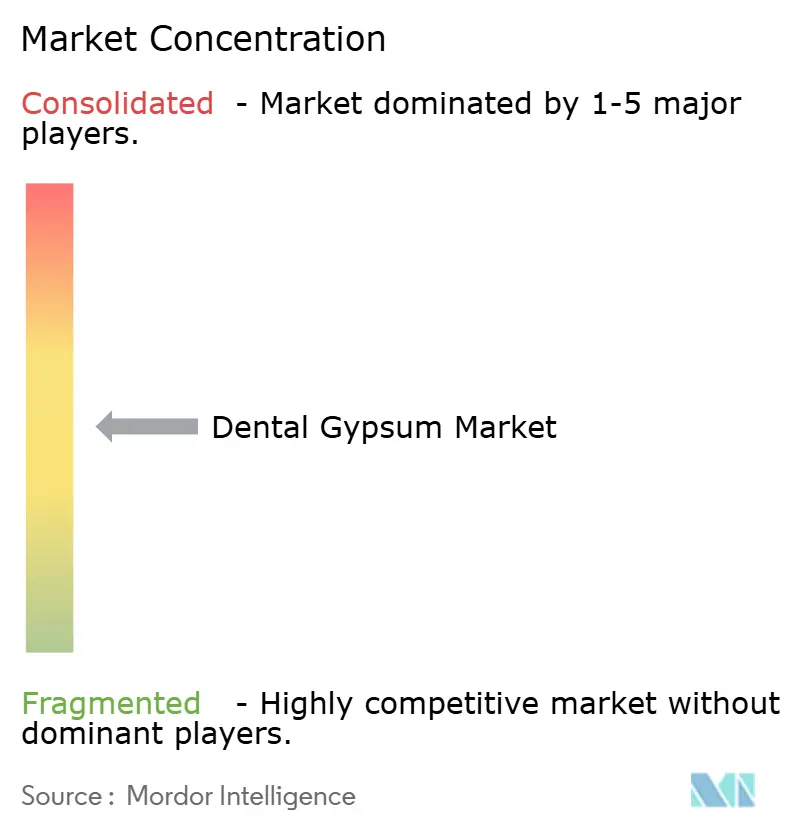
| Market Concentration | Medium |
Major Players *Disclaimer: Major Players sorted in no particular order Image © Mordor Intelligence. Reuse requires attribution under CC BY 4.0. | |
Dental Gypsum Market Analysis by Mordor Intelligence
The Dental Gypsum Market size is projected to expand from USD 295.10 million in 2025 and USD 319 million in 2026 to USD 473.40 million by 2031, registering a CAGR of 8.21% between 2026 to 2031.
Orthodontic and prosthodontic procedure growth is reinforcing the clinical relevance of study models, even as intraoral scanners and 3-D printers gain traction in urban practices. High-strength Type IV formulations are winning share because implant verification and full-arch restorations still demand compressive strengths above 5,000 psi for repeatable seating trials. Cross-border laboratory outsourcing, enabled by ISO 6873 dimensional-stability thresholds, is reorganizing procurement patterns, shifting bulk purchases of the dental gypsum market toward China and India while pressuring suppliers to differentiate through low-dust and fast-set options. North American demand remains solid, but OSHA crystalline-silica standards, hydrogen-sulfide disposal rules, and resin-printing alternatives are trimming volume growth at independent laboratories.
Key Report Takeaways
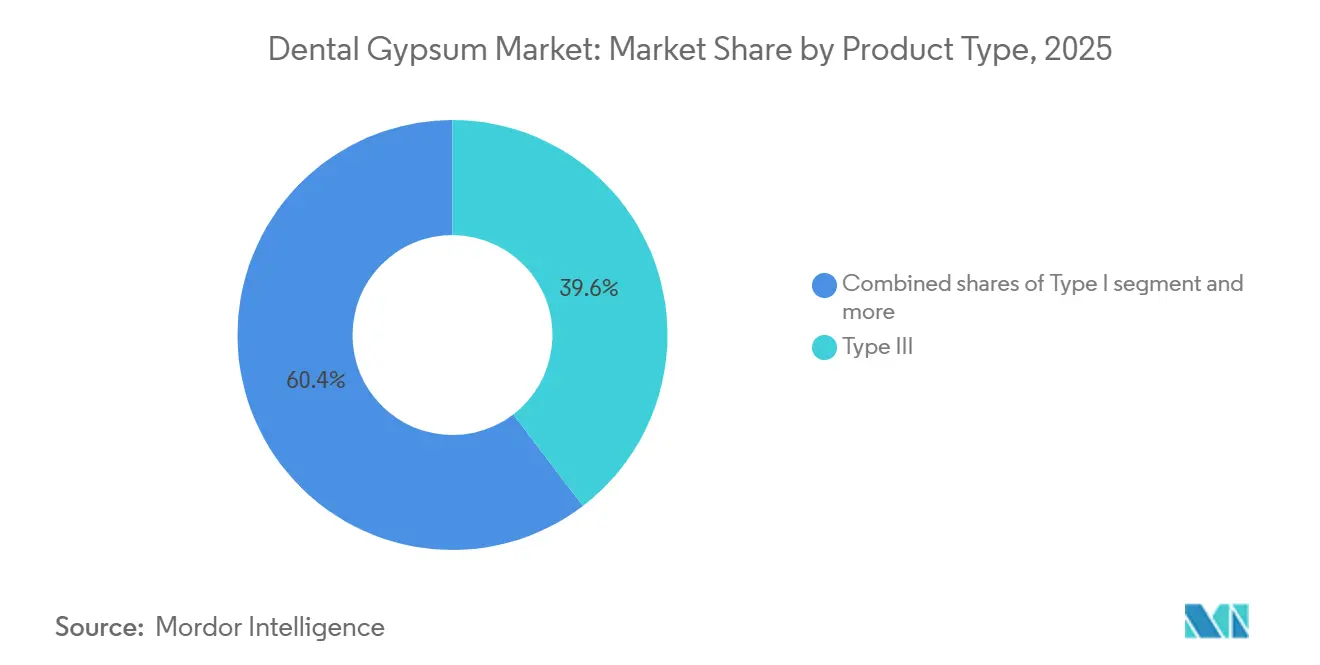
- By product type, Type III led with 39.63% revenue share in 2025, while Type IV is projected to expand at an 8.67% CAGR through 2031.
- By application, study, and diagnostic models captured 42.78% of the dental gypsum market share in 2025, but implant models and verification jigs are forecast to advance at an 8.57% CAGR through 2031.
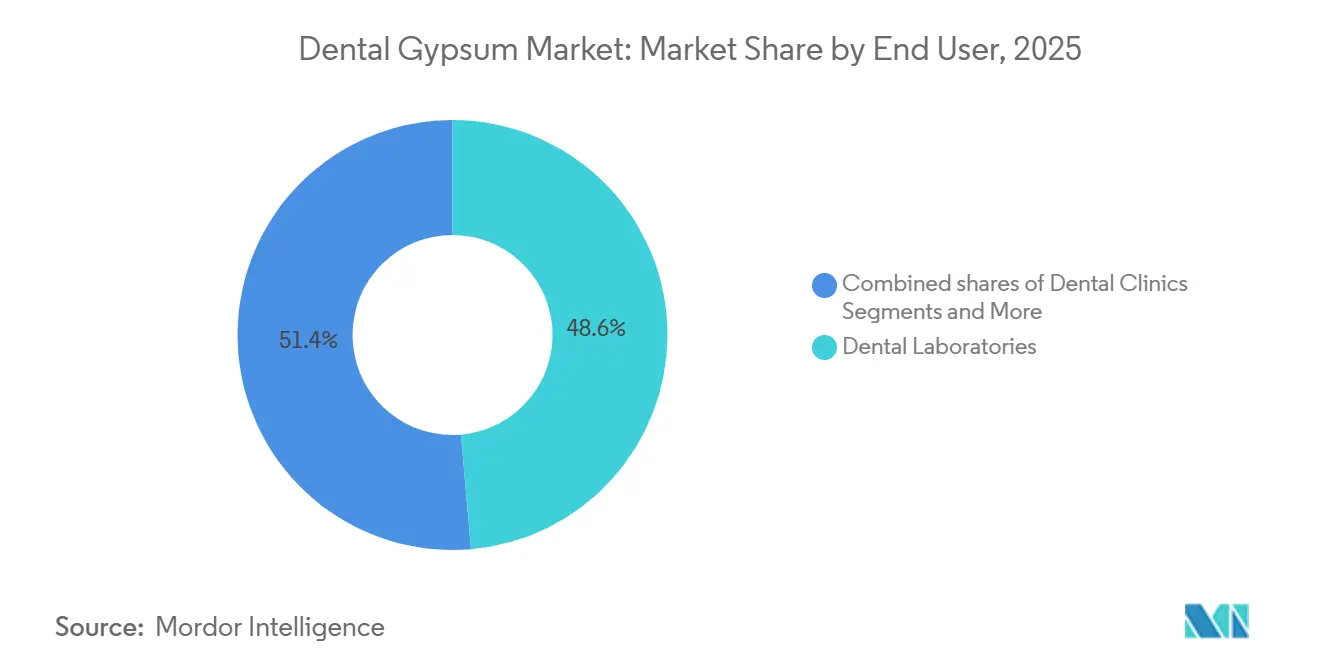
- By end user, dental laboratories held 48.63% share of the dental gypsum market size in 2025, whereas dental clinics are on track for the fastest 8.49% CAGR to 2031.
- By geography, North America accounted for 38.13% of the 2025 value, yet Asia-Pacific is set to grow quickest at an 8.41% CAGR to 2031.
Note: Market size and forecast figures in this report are generated using Mordor Intelligence’s proprietary estimation framework, updated with the latest available data and insights as of January 2026.
Global Dental Gypsum Market Trends and Insights
Drivers Impact Analysis*
| Driver | (~) % Impact on CAGR Forecast | Geographic Relevance | Impact Timeline |
|---|---|---|---|
| Rising prosthodontic case volumes | +1.8% | Global, especially aging North America and Europe | Medium term (2-4 years) |
| Expansion of dental laboratories and outsourcing | +1.5% | China, India, Vietnam with spill-over to MEA | Long term (≥ 4 years) |
| Orthodontic treatment growth, especially in APAC | +1.6% | China, India, South Korea, emerging Latin America | Medium term (2-4 years) |
| ISO 6873 standardization supports quality and cross-market adoption | +0.9% | Global | Long term (≥ 4 years) |
| Implant model and verification workflows still favor high-strength die stones | +1.4% | North America, Europe, urban APAC | Medium term (2-4 years) |
| Cost/time advantage of gypsum for select high-throughput study models vs 3-D printed | +1.0% | North America, Europe, price-sensitive APAC labs | Short term (≤ 2 years) |
| Source: Mordor Intelligence | |||
Rising Prosthodontic Case Volumes
The aging population in North America and Western Europe is driving demand for crowns, bridges, and complete dentures, lifting restorative revenues at a 6.1% trajectory to 2032 [1]PubMed Central, “Prosthodontic Treatment Trends and Demographics,” pmc.ncbi.nlm.nih.gov. Even as digital dentures trim chairside visits by almost one-third, laboratories still pour Type III bases to stabilize flasks during polymerization and occlusal remounting. Clinical studies confirm that gypsum master casts detect CAD/CAM milling artifacts invisible on-screen, safeguarding marginal integrity. Because a USD 2 gypsum pour averts a USD 3,000 remake, clinicians retain the material in their quality-control protocol. Consequently, prosthodontics is expected to add more than 14 million additional pours annually by 2031, underpinning steady expansion of the dental gypsum market.
Expansion of Dental Laboratories and Outsourcing
ISO-standard tolerance convergence now lets a die poured in Shenzhen seat a crown milled in Chicago with the same 50-micrometer margin fidelity. This regulatory parity catalyzed a shift of over 65% of North American CAD/CAM crown-and-bridge work to APAC super-labs, concentrating procurement and dropping delivered Type III costs below USD 0.50 per cast. Indian dental-tourism clinics, treating half a million foreign patients in 2024, own in-house labs that favor gypsum for treatment planning guides, adding another growth channel. Automated mixing silos and vacuum conditioning cut set-time variation, encouraging high-volume labs to sign multi-year contracts that secure raw gypsum at mine-gate pricing. These dynamics collectively lift long-term demand for the dental gypsum market and heighten supplier competition on service, not chemistry.
Orthodontic Treatment Growth, Especially in Asia-Pacific
Clear-aligner therapy is scaling at 10.7% per year, yet physical retention checks every two months still rely on quick-set orthodontic stone [2]Journal of Clinical Orthodontics, “Clear Aligner Therapy Growth,” jco-online.com. Adolescents in China and India, spurred by rising disposable income, are pushing appliance penetration beyond 8%. Each fixed-appliance case consumes about 150 grams of Type III stone for arch-length analysis, while every aligner case typically generates two poured verification models. South Korean clinics with scanner penetration above 60% nonetheless pour gypsum before patient dismissal, shortening correction cycles by catching tray-fit errors instantly. The result is a sustained mid-term boost for the dental gypsum market even in highly digital regions.
ISO 6873 Standardization Enabling Cross-Market Adoption
The 2013 revision introduced 24-hour expansion testing and a 5,000-psi floor for Type IV compressive strength, creating a global reference that short-circuits redundant regional approvals [3]FDA, “Premarket Notification 510(k),” fda.gov. Compliance satisfies U.S. 510(k) filings and simplifies EU CE marking, allowing Asian manufacturers to enter Western channels without extensive revalidation. While commoditization squeezes margins, suppliers leverage the open standard to bundle value-adds like cartridge dosing, color coding, and silica-free variants that reduce OSHA burden. Standardization also underpins multi-facility digital workflows where model verification in one country protects restorative accuracy in another, reinforcing systemic demand across the dental gypsum market.
Restraints Impact Analysis*
| Restraint | (~) % Impact on CAGR Forecast | Geographic Relevance | Impact Timeline |
|---|---|---|---|
| Rapid adoption of intraoral scanners enabling model-free or printed workflows | –1.2% | North America, Europe, urban APAC | Short term (≤ 2 years) |
| Shift to 3-D-printed models displacing poured stone in labs | –0.9% | North America, Europe, early-adopter APAC | Medium term (2-4 years) |
| OSHA/NIOSH silica exposure compliance burden in labs | –0.6% | United States, with spill-over to Canada | Long term (≥ 4 years) |
| Gypsum disposal constraints (H₂S risk) raising handling costs | –0.4% | EU, select U.S. states with strict environmental rules | Long term (≥ 4 years) |
| Source: Mordor Intelligence | |||
Rapid Adoption of Intraoral Scanners Enabling Model-Free or Printed Workflows
Scanner penetration reached 44% of general dentists and 45% of orthodontists by 2024, letting clinicians mill single-unit crowns or order aligners without physical impressions. Powder-free optics cut full-arch capture to 90 seconds, while chairside CAD/CAM systems present same-day placement in a single visit. Each digital case eliminates 200–300 grams of Type III stone, eroding incidental demand. Capital expense still curbs uptake in smaller or rural practices, but in top urban ZIP codes, usage already exceeds 60%, creating a near-term drag on the dental gypsum market.
Shift to 3-D-Printed Models Displacing Poured Stone in Labs
Desktop stereolithography printers costing USD 3,000 to 8,000 now hit 34-micrometer accuracy, meeting ISO-defined expansion limits and letting labs print snap-on dies that speed waxing. Kulzer’s Cara Print Cube produces five full arches in a single cycle, and batch post-cure slashes turnaround to 20 minutes. Large commercial labs have diverted 15–20% of former Type III volume toward resins for orthodontic setups. Yet resin fragility still forces technicians to pour gypsum working casts for fine-margin crowns, tempering the restraint’s overall severity on the dental gypsum market.
*Our forecasts treat driver/restraint impacts as directional, not additive. The impact forecasts reflect baseline growth, mix effects, and variable interactions.
Segment Analysis
By Product Type: Precision Demand Lifts Type IV Growth
Type IV captured an 8.67% CAGR outlook as implant verification and full-arch restorations require compressive strengths past 5,000 psi, sustaining premium pricing within the dental gypsum market size. Type III retained 39.63% dental gypsum market share in 2025 because high-throughput study models still favor its balance of cost and 0.15% expansion consistency. Laboratories producing more than 200 daily casts report that automated vacuum mixers trim porosity, cutting die adjustments by 12% and saving technician hours. Type II remains niche for articulator mounting, while Type I is largely obsolete outside specialized edentulous impressions. Emerging Type V stones, topping 7,000 psi, service zirconia substructures but face limited uptake due to longer set-times that hinder same-day workflows.
ISO 6873 alignment lets suppliers ship identical formulations worldwide, fostering cross-border price convergence and turning logistics efficiency into a core differentiator. Whip Mix’s Silky-Rock achieves 0.09% linear expansion and separates in five minutes, an advantage for labs racing against surge volumes of aligner checks. Kulzer’s Die-Stone offers pre-weighed satchels that reduce mixing errors to below 1 g, a driver of adoption among small clinics venturing into in-office milling. As competitive intensity rises, vendors bundle automated dispensers and dust-free packaging, cementing long-term penetration of Type IV within the broader dental gypsum market.


By Application: Implant Models Outpace Study Casts
Study and diagnostic models held 42.78% of the 2025 volume because virtually every prosthodontic or orthodontic case begins with a baseline pour. However, implant models and verification jigs are on course to eclipse growth at an 8.57% CAGR to 2031, reflecting a rising 5.0% global implant-placement trajectory. Clinical trials show gypsum casts yield 42-micrometer mean error, nearly half that of printed resins, preserving passivity in screw-retained bars and underpinning malpractice mitigation.
Protocol evolution in digital dentures still requires gypsum for base-plate flasking, limiting resin cannibalization. Orthodontic clear-aligner workflows mandate periodic retention checks, each consuming one fast-set Type III pour and fortifying application diversity. Labs targeting full-arch implant hybrids note that a USD 2 Type IV verification cast prevents USD 3,000 re-milling, cementing gypsum’s indispensability for precision work. While opposing-arch casts may migrate to resins over time, implant verification’s clinical criticality sustains a resilient share of the dental gypsum market.
By End User: Clinics Close the Gap With Labs
Dental laboratories commanded 48.63% of the spend in 2025, bulk-buying pallets that push material cost below USD 0.50 per Type III cast. Yet dental clinics are projected for an 8.49% CAGR, propelled by in-office scanners and compact milling units now installed in 30% of U.S. offices. Each same-day crown still needs a rapid opposing-arch check, and clinics favor five-minute separation stones to support a 120-minute turnaround. Hospitals and teaching institutes remain stable buyers, relying on gypsum for resident training and research requiring repeatable dimensional benchmarks.
Vertical integration is redrawing procurement. Group practices negotiate directly with manufacturers, bypassing distributors and eroding legacy lab volumes. Whip Mix’s 2023 retreat from third-party hardware sales signals a renewed bet on core materials as labs and clinics converge on hybrid analog-digital workflows. Smaller regional labs, squeezed by OSHA compliance and capital outlays, either outsource to APAC giants or pivot toward value-added prosthetics, leaving commodity casting to larger peers. These shifts collectively reallocate volumes inside the dental gypsum market while keeping aggregate demand on a steady incline.
Geography Analysis
North America generated 38.13% of the 2025 value, anchored by more than 7,000 certified laboratories and widespread insurance coverage for crowns and implants. OSHA respirable-silica regulation, however, is inflating ventilation and monitoring costs, nudging some independent labs to outsource model production offshore or adopt silica-free formulations. The dental gypsum market size in the region is therefore expanding more slowly than the global average, even though procedural demand remains robust.
Asia-Pacific is forecast for an 8.41% CAGR through 2031, the fastest worldwide. Chinese super-labs process two-thirds of North American CAD/CAM cases, buoyed by ISO-aligned quality assurances that reduce remakes to under 2%. India’s inbound dental-tourism clinics poured more than 1.2 million diagnostic casts in 2025 alone, reinforcing material pull. South Korean and Japanese orthodontic hubs maintain gypsum verification even with high scanner adoption, reflecting cultural emphasis on precision. Collectively, these drivers are tilting procurement gravity toward the region, intensifying supplier competition inside the dental gypsum market.
Europe shows stable, aging-driven demand but faces landfill bans on mixed gypsum that escalate disposal fees to USD 150 per ton in Germany and France. Many labs respond by shifting low-risk study models to printed resins, freeing gypsum budgets for high precision Type IV and Type V applications. The Middle East and Africa, while smaller, are opening new teaching hospitals that mandate ISO-certified materials, offering long-tail growth. South America’s public oral-health programs and university networks sustain a modest but dependable call for study models, rounding out the global footprint of the dental gypsum market.

Competitive Landscape
The dental gypsum market is moderately fragmented; the top five vendors, USG, Saint-Gobain Formula GmbH, Heraeus Kulzer, Whip Mix, and GC Corporation, collectively hold the majority of revenue in 2025. ISO 13485 certification is now an entry ticket, and product lines increasingly bundle automated dispensers, color designators, and low-dust chemistry to ease OSHA obligations. Bulk purchasers press suppliers to lock multi-year contracts at cost-plus terms, compressing gross margins and prompting diversification into investments, articulators, or 3-D resins.
Kulzer’s March 2025 release of the cara Print Cube reflects a hedging strategy: offer both gypsum and high-resolution printing so labs can toggle between materials within a single brand ecosystem. Whip Mix’s 2023 realignment back to precision materials underscores the view that formulation science, not equipment retailing, will underpin long-term defensibility. Dentsply Sirona’s February 2026 restructuring, triggered by USD 144 million in equipment impairments, signals the profitability squeeze on integrated platforms and the importance of agile channel partnerships.
Asian private-label manufacturers are the dark horses, leveraging proximity to Shandong gypsum mines and low labor costs to undercut branded players prices significantly. While their current penetration is limited to distributor house brands, ISO compliance and rising Western price sensitivity could open broader doors. Amid these shifts, value-added features such as five-minute separation, silica-free blends, and pre-mixed cartridges are likely to decide wallet share rather than basic physical properties.
Dental Gypsum Industry Leaders
USG
Saint-Gobain Formula GmbH
Heraeus Kulzer
Whip Mix Corporation
GC Corporation
- *Disclaimer: Major Players sorted in no particular order

Recent Industry Developments
- January 2026: GTCR LLC completed the purchase of Dentalcorp Holdings Ltd. at roughly CAD 11 per share. The deal extends private-equity ownership in dental service groups and will likely influence how large clinic networks source and standardize materials such as gypsum.
- September 2025: Kerr Dental earned Dental Advisor’s Innovative Company of the Year award for 2025, recognizing its work on restorative materials and precision tools that fit easily into gypsum-based workflows.
- January 2025: Saint-Gobain Recycled Plasterboard introduced a line made entirely from recycled gypsum, marking a concrete step toward more sustainable products in the segment.


Global Dental Gypsum Market Report Scope
As per the scope of the report, dental gypsum is a foundational mineral used to create accurate physical replicas of a patient's oral structures, such as teeth and surrounding soft tissues. When dental gypsum powder is mixed with water, it undergoes a chemical reaction that converts it back into a solid dihydrate mass through a crystallization process, eventually forming a rigid, dimensionally stable model.
The dental gypsum market is segmented by product type, applications, end users, and geography. By product type, the market is segmented into type I, type II, type III, type IV, and type V. By applications, the market is segmented into study/diagnostic models, working casts & dies, implant models & verification jigs, orthodontic models, articulator mounting, and denture flasking. By end users, the market is segmented into dental laboratories, dental clinics, and hospitals & academic/teaching institutes.
Geographically, the market is segmented across North America, Europe, the Asia-Pacific region, the Middle East & Africa, and South America. The market report also covers the estimated market sizes and trends for 17 countries across major regions globally. For each segment, the market size and forecast are provided in terms of value (USD).
| Type I |
| Type II |
| Type III |
| Type IV |
| Type V |
| Study/diagnostic models |
| Working casts & dies |
| Implant models & verification jigs |
| Orthodontic models |
| Articulator mounting |
| Denture flasking/base pours |
| Dental Laboratories |
| Dental Clinics |
| Hospitals & Academic/Teaching Institutes |
| North America | United States |
| Canada | |
| Mexico | |
| Europe | Germany |
| United Kingdom | |
| France | |
| Italy | |
| Spain | |
| Rest of Europe | |
| Asia-Pacific | China |
| India | |
| Japan | |
| South Korea | |
| Australia | |
| Rest of Asia-Pacific | |
| Middle East and Africa | GCC |
| South Africa | |
| Rest of Middle East and Africa | |
| South America | Brazil |
| Argentina | |
| Rest of South America |
| By Product Type | Type I | |
| Type II | ||
| Type III | ||
| Type IV | ||
| Type V | ||
| By Application | Study/diagnostic models | |
| Working casts & dies | ||
| Implant models & verification jigs | ||
| Orthodontic models | ||
| Articulator mounting | ||
| Denture flasking/base pours | ||
| By End User | Dental Laboratories | |
| Dental Clinics | ||
| Hospitals & Academic/Teaching Institutes | ||
| By Geography | North America | United States |
| Canada | ||
| Mexico | ||
| Europe | Germany | |
| United Kingdom | ||
| France | ||
| Italy | ||
| Spain | ||
| Rest of Europe | ||
| Asia-Pacific | China | |
| India | ||
| Japan | ||
| South Korea | ||
| Australia | ||
| Rest of Asia-Pacific | ||
| Middle East and Africa | GCC | |
| South Africa | ||
| Rest of Middle East and Africa | ||
| South America | Brazil | |
| Argentina | ||
| Rest of South America | ||


Key Questions Answered in the Report
How large will the dental gypsum market be by 2031?
It is projected to reach USD 0.47 billion by 2031, expanding at an 8.2% CAGR from 2026 to 2031.
Which product type is growing fastest?
Type IV, driven by implant verification needs, is forecast to post an 8.67% CAGR through 2031.
Why is Asia-Pacific the fastest-growing region?
Outsourced CAD/CAM production in China and expanding orthodontic adoption in India and South Korea are pushing regional growth to an 8.41% CAGR.
Will 3-D printing eliminate gypsum casts?
Printed models are displacing some study casts, but gypsum remains essential for high-strength die work and implant verification due to superior hardness and lower unit cost
Page last updated on:


