Dental Charting Software Market Size and Share
Market Overview
| Study Period | 2020 - 2031 |
|---|---|
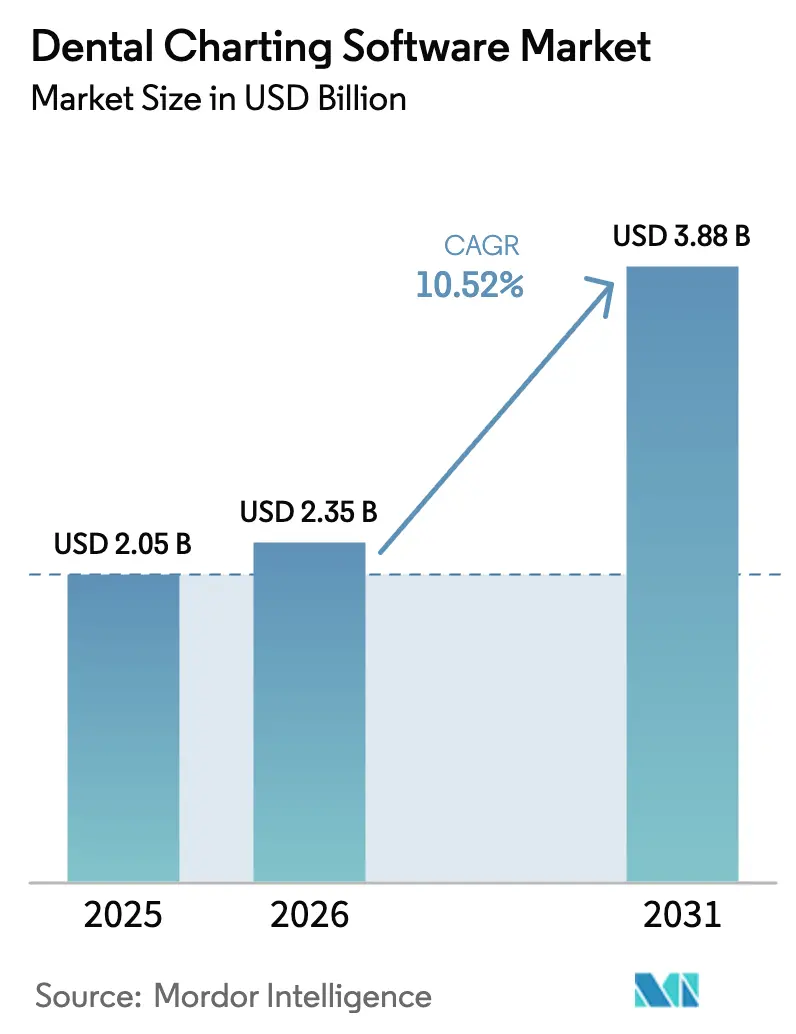
| Market Size (2026) | USD 2.35 Billion |
| Market Size (2031) | USD 3.88 Billion |
| Growth Rate (2026 - 2031) | 10.52% CAGR |
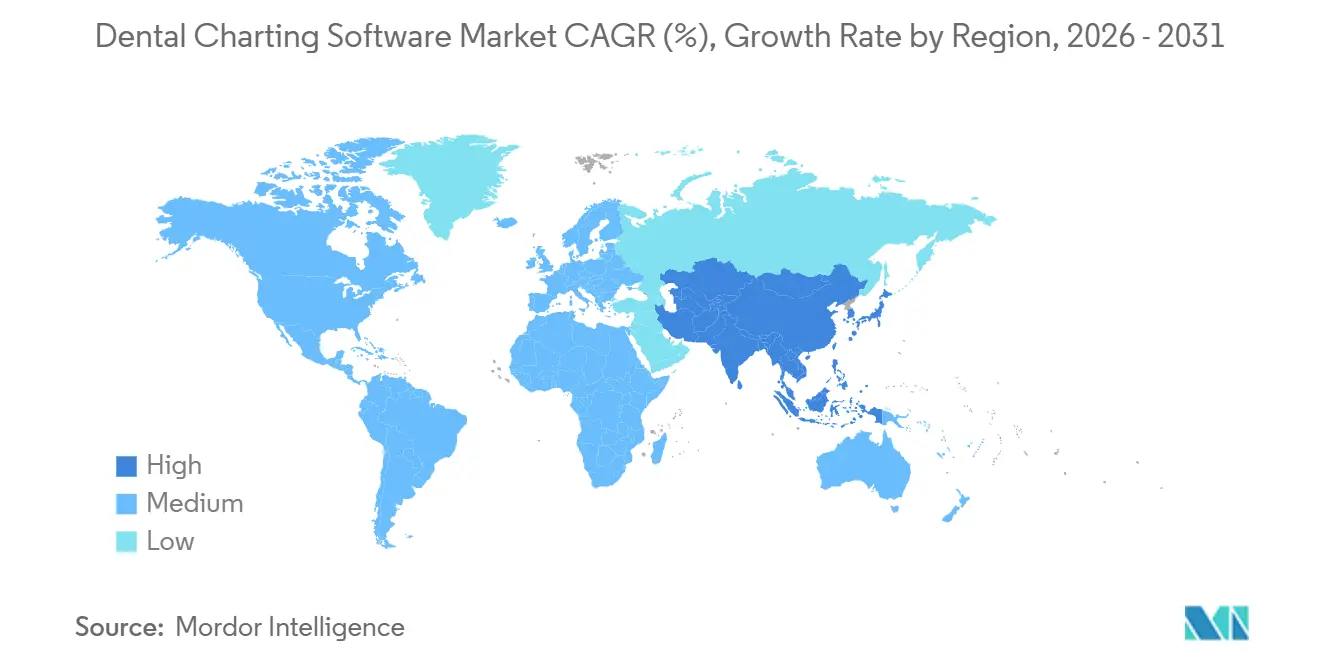
| Fastest Growing Market | Asia Pacific |
| Largest Market | North America |
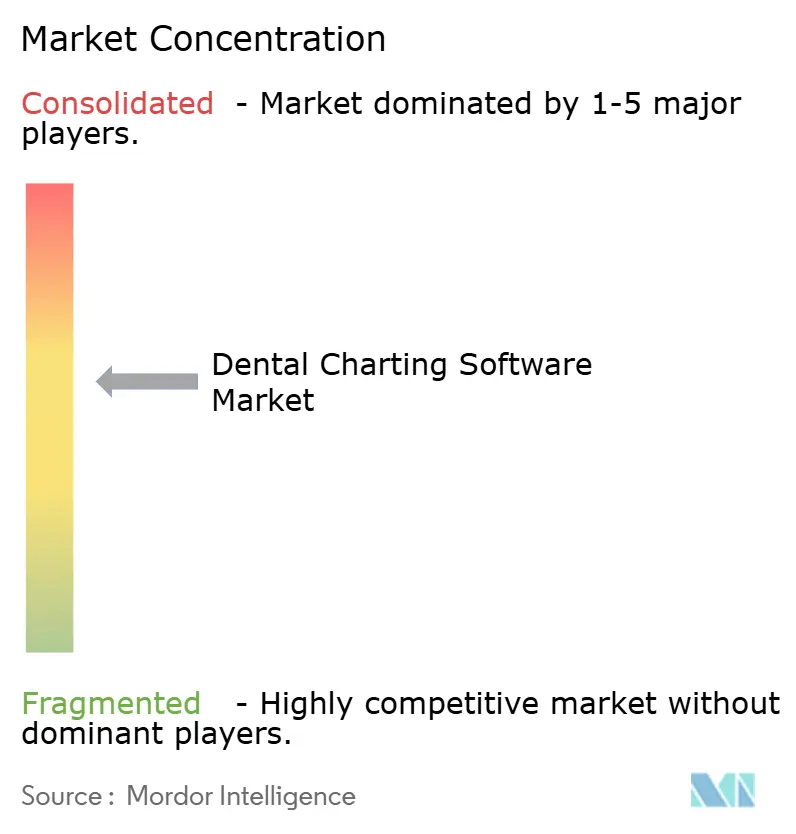
| Market Concentration | Medium |
Major Players *Disclaimer: Major Players sorted in no particular order Image © Mordor Intelligence. Reuse requires attribution under CC BY 4.0. | |
Dental Charting Software Market Analysis by Mordor Intelligence
The Dental Charting Software Market size is expected to grow from USD 2.05 billion in 2025 to USD 2.35 billion in 2026 and is forecast to reach USD 3.88 billion by 2031 at 10.52% CAGR over 2026-2031.
Demand is scaling as dental groups migrate from on-premises servers to cloud platforms, adopt FDA-cleared AI diagnostics, and comply with new data-sharing rules, such as HL7 FHIR and Section 524B cybersecurity requirements. Cloud deployment models already dominate the dental charting software market, and their advantage widens as Dental Support Organizations (DSOs) expand, because automatic updates, real-time analytics, and lower per-chair infrastructure costs improve operating margins. Functionally, AI-driven charting and diagnostic add-ons record the fastest uptake, turning algorithmic image analysis into higher case acceptance and revenue. Regionally, North America leads on revenue, yet Asia-Pacific posts the highest growth as governments in the Gulf Cooperation Council (GCC), India, and China mandate electronic records in private clinics.
Key Report Takeaways
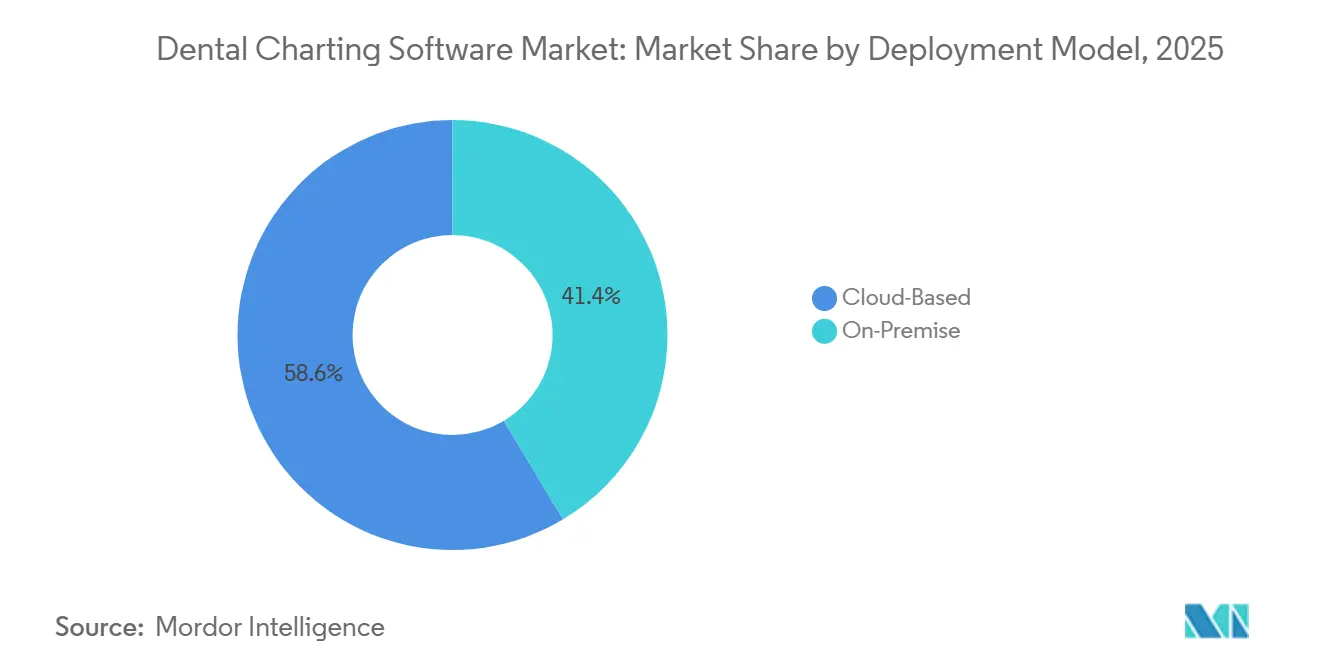
- By deployment model, cloud platforms commanded 58.55% of the dental charting software market share in 2025 and will expand at a 12.25% CAGR to 2031.
- By functionality, AI-driven charting and diagnostics will register the fastest growth at 13.15% CAGR, while advanced charting and integration retained 46.23% share in 2025.
- By end user, Group Practices accounted for 40.33% share of the market size in 2025 and Dental Support Organizations (DSOs) are advancing at a 12.25% CAGR through 2031.
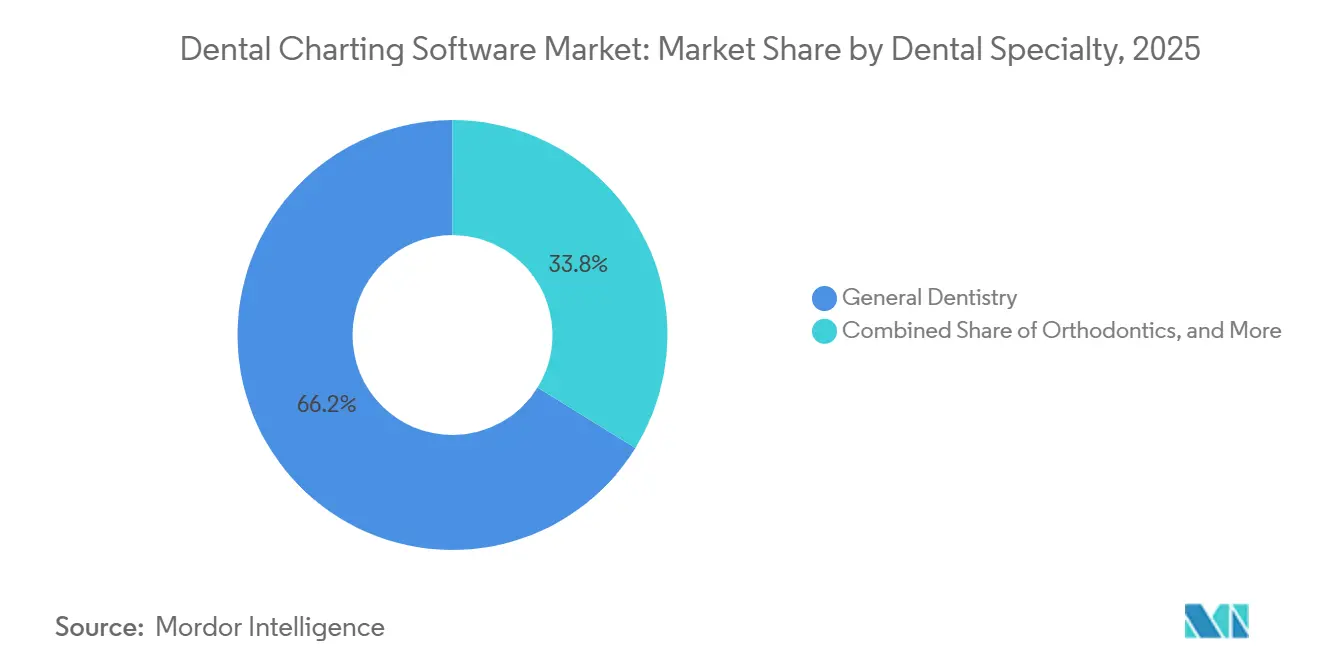
- By dental specialty, orthodontics is forecast to expand at 11.15% CAGR through 2031, ahead of general dentistry’s base of 66.23% demand in 2025.
- By geography, Asia–Pacific will accelerate at a 12.82% CAGR through 2031, eclipsing North America’s mature 41.25% revenue base.
Note: Market size and forecast figures in this report are generated using Mordor Intelligence’s proprietary estimation framework, updated with the latest available data and insights as of January 2026.
Global Dental Charting Software Market Trends and Insights
Driver Impact Analysis*
| Driver | (~) % Impact on CAGR Forecast | Geographic Relevance | Impact Timeline |
|---|---|---|---|
| Shift From on-Premise to Cloud Dental Platforms | +2.8% | North America and Europe lead; Asia-Pacific accelerates | Medium term (2-4 years) |
| Regulatory Mandates for Digital Records and e-Prescriptions | +2.1% | North America, Europe, GCC | Short term (≤ 2 years) |
| Expansion of Dental Support Organizations | +1.9% | North America core; spill-over to Europe and Asia-Pacific | Medium term (2-4 years) |
| Chair-Side Integration of 3-D Imaging & CBCT | +1.4% | High-income urban markets worldwide | Long term (≥ 4 years) |
| AI-powered Caries Detection & Auto-Charting | +1.6% | Early clinical adoption in North America and Europe | Medium term (2-4 years) |
| Mobile Tablet Charting for Hygienists | +0.7% | Global, strongest in North America and Australia | Short term (≤ 2 years) |
| Source: Mordor Intelligence | |||
Growing Shift From On-Premise to Cloud-Based Dental Practice Platforms
Cloud systems eliminate server hardware costs and enable DSOs to view multi-site dashboards in real time. Planet DDS reported that over half of the top 60 U.S. DSOs used its Denticon platform in 2025, confirming that procurement teams favor solutions with proven multi-tenant scalability. Subscription fees ranging from USD 300 to USD 600 per provider per month deter solo clinics, yet the calculus changes once a second location opens, as remote access and automated updates offset VPN and IT labor costs.
Regulatory Mandates for Digital Patient Records & E-Prescriptions
The U.S. Office of the National Coordinator for Health Information Technology began enforcing information-blocking penalties in 2024, imposing civil fines of up to USD 1 million per violation on providers that restrict electronic record exchange[1]U.S. Department of Health and Human Services, “Information Blocking,” HealthIT.gov. In parallel, the European Union’s European Health Data Space (EHDS) regulation, adopted in 2024, obliges cross-border interoperability of dental records by 2027[2]European Commission, “European Health Data Space,” Health.ec.europa.eu. GCC states are rolling out national health information exchanges with similar deadlines. Vendors with certified HL7 FHIR libraries gain a compliance moat, while smaller rivals struggle to meet audit documentation demands.
Expansion of Dental Support Organizations (DSOs) Worldwide
Benesch Law’s 2025 analysis found that 8 of the 10 largest U.S. DSOs had adopted AI diagnostics between 2022 and 2025, compared with fewer than 18% of solo practices. Guardian Dentistry Partners deployed integrated AI across more than 160 locations in 2025, cutting its vendor sales cycle from 18 months to 6 months by consolidating procurement. Such a scale fosters standard treatment protocols and predictable margins attractive to private-equity owners.
AI-Powered Caries Detection & Auto-Charting Tools Gain Clinical Validation
The U.S. FDA cleared four AI dental algorithms, Pearl, VideaHealth, Denti.AI, and Cube Click SMILE Dx, between January 2024 and December 2025. Practices using Pearl’s Second Opinion software detected 37% more decay per patient in 2025 and increased per-patient production by 23% by flagging lesions clinicians overlooked on annotated radiographs. Overjet deployments in DSOs increased case acceptance rates by 25%, demonstrating tangible ROI before insurers assign a unique CDT code.
Restraints Impact Analysis*
| Restraint | (~) % Impact on CAGR Forecast | Geographic Relevance | Impact Timeline |
|---|---|---|---|
| Cyber-Security and HIPAA/GDPR Compliance | -1.3% | Global scrutiny, strongest in North America and Europe | Short term (≤ 2 years) |
| Limited IT Budgets in Emerging Markets | -1.1% | Asia-Pacific (excluding Japan, Australia), Latin America, MEA | Medium term (2-4 years) |
| Workflow Disruption During Data Migration | -0.8% | Solo and small group practices worldwide | Short term (≤ 2 years) |
| Interoperability Gaps with Older Hardware | -0.9% | Practices running imaging gear older than 5 years | Medium term (2-4 years) |
| Source: Mordor Intelligence | |||
Cyber-Security & HIPAA/GDPR Compliance Concerns
Section 524B of the U.S. FDA’s cybersecurity guidance, effective October 2023, requires software bills of materials and vulnerability-patch timelines for new medical device submissions[3]U.S. Food and Drug Administration, “Cybersecurity in Medical Devices: Quality System Considerations,” FDA.gov. A 2024 scoping review found that 88.2% of digital dentistry projects cited data security as the primary risk, ahead of liability and patient consent. HIPAA penalties can reach USD 50,000 per patient record, while GDPR fines climb to 4% of global turnover, putting small practices under severe financial strain.
Limited IT Budgets Across Emerging-Market Practices
A 2024 Brazilian study reported that only 21% of clinics had switched to digital radiography, with 52% still using film and 27% outsourcing imaging, highlighting the capital hurdle that is slowing the dental charting software market in Latin America. Similar budget ceilings apply in India, Indonesia, and sub-Saharan Africa, where a monthly cloud fee of USD 300-600 can consume up to 10% of a solo dentist's gross revenue.
*Our forecasts treat driver/restraint impacts as directional, not additive. The impact forecasts reflect baseline growth, mix effects, and variable interactions.
Segment Analysis
By Deployment Model: Cloud Leads With DSO Momentum
Cloud platforms captured 58.55% of the 2025 revenue in the dental charting software market and are set to expand at a 12.25% CAGR through 2031. Centralized hosting eliminates server maintenance and aligns with DSO growth strategies that demand multi-site production dashboards and quick rollouts for acquired clinics. On-premise systems persist among solo offices that value a one-time license and local control, yet their share declines as vendors phase out server-based updates. Interoperability with imaging hardware remains a pain point; obsolete sensors without DICOM drivers often necessitate USD 15,000 equipment upgrades. Compliance adds pressure because practices managing their own servers must maintain software bills of materials and patch logs to satisfy Section 524B audits.
Regional connectivity also shapes adoption. In areas where broadband outages are common, clinics hesitate to rely on cloud uptime. Yet once a DSO standardizes on a cloud vendor, scale economics tilt decisively toward hosted models, reinforcing the gravitational pull of centralized analytics and automatic upgrades. Consequently, the dental charting software market continues to consolidate around vendors with proven multi-tenant architectures and HIPAA-compliant disaster-recovery infrastructure.


By Functionality: AI Diagnostics Accelerate Revenue Per Patient
Advanced charting and integration functions held 46.23% share in 2025, while AI-driven modules will grow at a 13.15% CAGR to 2031, the fastest slice of the dental charting software market. Pearl’s FDA-cleared Second Opinion and Overjet’s radiograph annotation engines demonstrate how algorithmic detection boosts acceptance of restorative treatment, lifting the dental charting software market for AI solutions. Practices view the subscription, typically USD 200-400 per provider per month, as a revenue catalyst rather than a cost when it increases case acceptance by double digits. Basic tooth-diagram modules are still used in cost-sensitive public clinics but lack extensibility. Voice-activated perio charting, introduced by Planet DDS in February 2026, further reduces data-entry time and positions hygienists to record six-point periodontal probing without an assistant, deepening workflow efficiency at large group practices.
Mobile charting apps also progress as tablets replace shared workstations, cutting chair-side documentation time. Yet reimbursement remains the pivot. Once the American Dental Association secures separate CDT codes for AI-assisted diagnosis, projected for review in 2026, late adopters will likely convert rapidly, unlocking a second-wave surge in functionality upgrades.
By End User: DSOs Anchor Growth
Group practices accounted for 40.33% of 2025 revenue, but DSOs will outpace all other end users, with a 12.25% CAGR through 2031. Consolidators favor platforms that deliver enterprise dashboards, centralized billing, and tight integration with imaging systems. Guardian Dentistry Partners offers a case in point: its 160-plus locations deployed AI in 2025 to level provider variation, evidencing the sales-cycle compression possible when buying decisions shift from individual dentists to corporate IT committees. Solo practices remain numerous, yet migration lags because monthly cloud fees exceed typical 3% IT budget thresholds. Hospitals and academic centers require HL7 FHIR bridges into enterprise EHRs, while public health clinics opt for low-cost, multilingual interfaces that minimize staff training.
By Dental Specialty: Orthodontics Digitalizes Fastest
General dentistry delivered 66.23% of the 2025 demand. Orthodontics, however, is forecast to grow at a 11.15% CAGR. Clear-aligner workflows depend on real-time 3-D modeling and mobile case submission, requirements that are incompatible with many legacy on-premises systems. Straumann’s ClearCorrect Virtuo Vivo, updated in 2024, lets orthodontists send cases directly from chair-side tablets and review AI-generated treatment plans. 3Shape and Planmeca similarly merge CBCT imaging, cephalometric analysis, and treatment simulation in unified suites, sharpening demand for specialty-grade charting. Periodontics and endodontics lag because patient volumes are smaller, yet vendors now bundle probing-depth capture and canal-length calculators to make niche modules more accessible.

Geography Analysis
North America accounted for 41.25% of 2025 revenue, driven by private insurance penetration and DSO consolidation. The United States, where 77% of residents held dental coverage in 2024, incentivizes electronic charting to speed claims adjudication. Canada imposes data-residency rules under PHIPA, so vendors maintain local data centers to win provincial contracts. Mexico’s dental tourism clinics use bilingual charting to issue English treatment plans for visiting U.S. patients while meeting Spanish-language requirements for regulators. Growth in North America moderates as urban saturation rises, prompting vendors to shift their focus to rural service gaps.
Asia–Pacific is the fastest-growing region at a 12.82% CAGR to 2031. GCC mandates, such as Dubai’s NABIDH, require every licensed dental office to integrate with a national health information exchange by 2026. Compliance deadlines spur private practices to shift from legacy software to cloud platforms with certified HL7 FHIR endpoints. In India and China, expanding urban middle classes boost private dental visits, and chains like Clove Dental deploy cloud charting to unify protocols across 100-plus sites. Broadband reliability still limits rural adoption, but mobile hotspots and offline-sync features ease the barrier gradually.
Europe shows mature yet uneven adoption. The EHDS regulation obliges cross-border dental record sharing by 2027, pressing vendors to harmonize data models for multi-country DSO groups. Language localization and fragmented reimbursement regimes raise go-to-market costs, yet German, French, and U.K. clinics maintain high willingness to pay for AI modules that support malpractice defense. South America trails; only 21% of Brazilian clinics used digital radiography in 2024, and new federal teledentistry rules have faced patchy municipal rollout. Argentina’s currency volatility tempers capital investment, although some expatriate-focused practices adopt bilingual charting for medical tourists.

Competitive Landscape
The dental charting software market is fragmented, with no single vendor exerting dominant control. Henry Schein’s Dentrix family serves over 50,000 mostly solo practices, leveraging its supply distribution network to upsell software. Planet DDS, by contrast, centers on DSOs: more than half of the top 60 groups used its Denticon cloud platform in 2025. Open Dental remains a popular open-source choice in price-sensitive markets, though community-led development complicates rapid regulatory updates. Curve Dental and tab32 differentiate through cloud-native stacks that combine scheduling, payments, and patient messaging under one login.
The U.S. FDA’s Section 524B cyber rules create a regulatory moat. Vendors with established quality-system teams can document software bills of materials and secure new 510(k) clearances more easily than start-ups, tightening competition. AI innovators Pearl, Overjet, and VideaHealth price their modules as revenue enablers rather than cost centers, yet payer reimbursement remains the gating factor. White-space remains largest among 4- to 10-location group practices that lack DSO bargaining power but still desire enterprise dashboards, opening the door to modular, mid-tier cloud offerings.
Dental Charting Software Industry Leaders
ABELDent
Carestream Dental
Curve Dental
Planet DDS (Denticon)
QSIDental
- *Disclaimer: Major Players sorted in no particular order

Recent Industry Developments
- February 2026: Planet DDS launched AI Voice Perio, the first voice-powered periodontal charting tool inside Denticon, enabling hands-free six-point probing across multi-location DSOs.
- April 2025: XDENT released an upgraded practice-management suite featuring 3D charting and enhanced patient engagement workflows.


Global Dental Charting Software Market Report Scope
As per the report's scope, dental charting software is a digital tool used by dental professionals to record, visualize, and manage patient oral health data. It replaces traditional paper charts with interactive diagrams that track tooth conditions, treatments, and procedures. By integrating with practice management systems, it enhances accuracy, streamlines workflows, and improves patient communication.
The dental charting software market segmentation includes deployment model, functionality, end user, dental specialty, and geography. By deployment model, the market is segmented into cloud-based and on-premise. By functionality, the market is segmented into basic charting, advanced charting & integration, AI-driven charting & diagnostics, and mobile/tablet charting apps. By end user, the market is segmented into dental clinics, dental support organizations (DSOs), hospitals & academic centers, and public health clinics. By dental specialty, the market is segmented into general dentistry, orthodontics, periodontics, endodontics, and oral & maxillofacial surgery. By geography, the market is segmented into North America, Europe, Asia-Pacific, the Middle East and Africa, and South America. The market report also covers estimated market sizes and market trends for 17 countries across major regions worldwide. The report offers market value (in USD) for the above segments.
| Cloud-Based |
| On-Premise |
| Basic Charting |
| Advanced Charting & Integration |
| AI-Driven Charting & Diagnostics |
| Mobile/Tablet Charting Apps |
| Dental Clinics |
| Dental Support Organizations (DSOs) |
| Hospitals & Academic Centers |
| Public Health Clinics |
| General Dentistry |
| Orthodontics |
| Periodontics |
| Endodontics |
| Oral & Maxillofacial Surgery |
| North America | United States |
| Canada | |
| Mexico | |
| Europe | Germany |
| United Kingdom | |
| France | |
| Italy | |
| Spain | |
| Rest of Europe | |
| Asia-Pacific | China |
| India | |
| Japan | |
| Australia | |
| South Korea | |
| Rest of Asia-Pacific | |
| Middle East and Africa | GCC |
| South Africa | |
| Rest of Middle East and Africa | |
| South America | Brazil |
| Argentina | |
| Rest of South America |
| By Deployment Model | Cloud-Based | |
| On-Premise | ||
| By Functionality | Basic Charting | |
| Advanced Charting & Integration | ||
| AI-Driven Charting & Diagnostics | ||
| Mobile/Tablet Charting Apps | ||
| By End User | Dental Clinics | |
| Dental Support Organizations (DSOs) | ||
| Hospitals & Academic Centers | ||
| Public Health Clinics | ||
| By Dental Specialty | General Dentistry | |
| Orthodontics | ||
| Periodontics | ||
| Endodontics | ||
| Oral & Maxillofacial Surgery | ||
| By Geography | North America | United States |
| Canada | ||
| Mexico | ||
| Europe | Germany | |
| United Kingdom | ||
| France | ||
| Italy | ||
| Spain | ||
| Rest of Europe | ||
| Asia-Pacific | China | |
| India | ||
| Japan | ||
| Australia | ||
| South Korea | ||
| Rest of Asia-Pacific | ||
| Middle East and Africa | GCC | |
| South Africa | ||
| Rest of Middle East and Africa | ||
| South America | Brazil | |
| Argentina | ||
| Rest of South America | ||


Key Questions Answered in the Report
How large is the dental charting software market in 2026?
The dental charting software market size is valued at USD 2.35 billion in 2026.
What CAGR will the market record through 2031?
The market is forecast to register a 10.52% CAGR from 2026 to 2031.
Which deployment model is growing fastest?
Cloud-based platforms will expand at a 12.25% CAGR, outpacing on-premise systems.
Why is Asia–Pacific the fastest-growing region?
Government mandates for electronic health records and rapid private-clinic expansion push Asia–Pacific demand at a 12.82% CAGR.
How is AI affecting adoption?
FDA-cleared AI tools boost decay detection and case acceptance, spurring a 13.15% CAGR for AI-driven functionality upgrades.
Page last updated on:


