Content Delivery Network Market Size and Share
Market Overview
| Study Period | 2020 - 2031 |
|---|---|
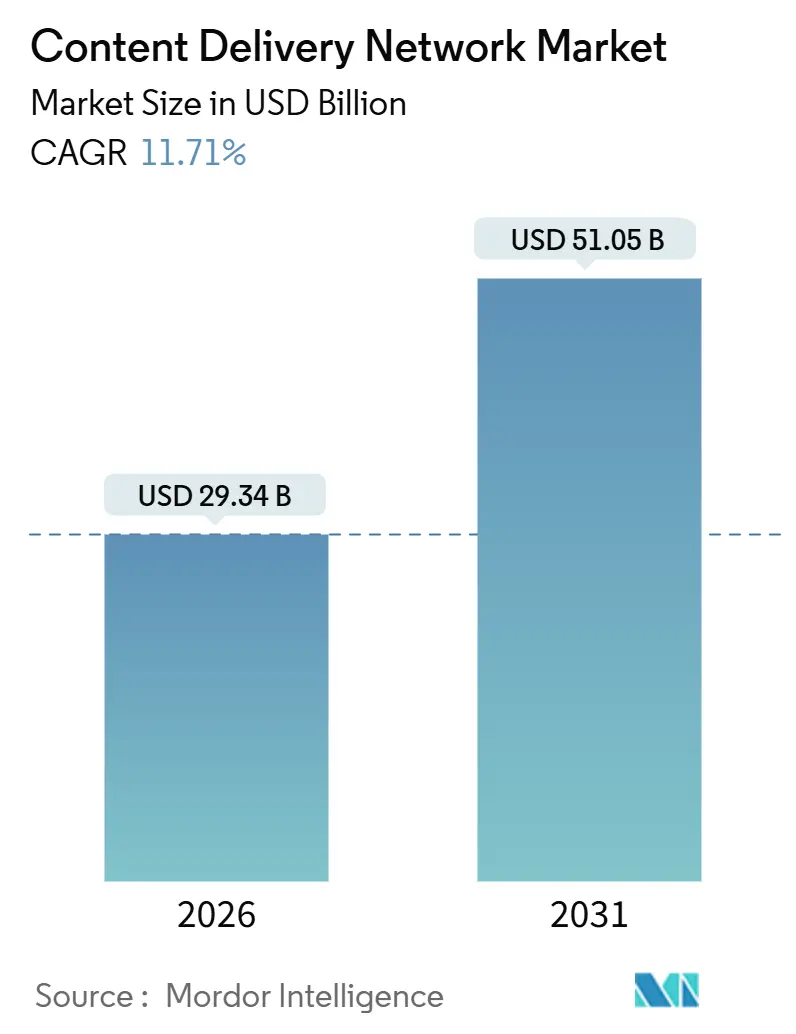
| Market Size (2026) | USD 29.34 Billion |
| Market Size (2031) | USD 51.05 Billion |
| Growth Rate (2026 - 2031) | 11.71% CAGR |
| Fastest Growing Market | Asia Pacific |
| Largest Market | North America |
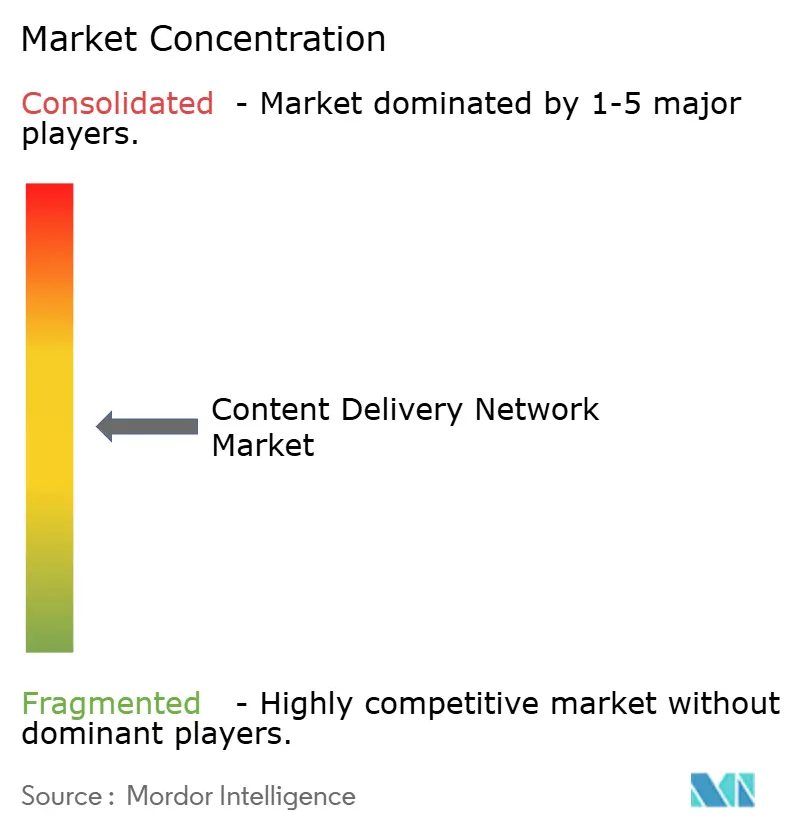
| Market Concentration | Medium |
Major Players *Disclaimer: Major Players sorted in no particular order Image © Mordor Intelligence. Reuse requires attribution under CC BY 4.0. | |
Content Delivery Network Market Analysis by Mordor Intelligence
The Content Delivery Network market size reached USD 29.34 billion in 2026 and is forecast to climb to USD 51.05 billion by 2031, expanding at an 11.71% CAGR. Three structural changes are accelerating demand. Hyperscale providers are inserting artificial-intelligence traffic-routing engines that trim egress bills by 20% to 30%, while telecommunications operators are opening 5G edge infrastructure through network-as-code application programming interfaces, and streaming platforms are raising the baseline to 4K and 8K formats that need sub-20-millisecond latency. Together, these trends push enterprises to outsource delivery, bolster capital spending on cache density, and search for platforms that combine low-cost bandwidth with integrated security. Competition is moving from raw gigabyte pricing to value-added services such as serverless functions and real-time analytics, which offer higher margins even as bandwidth commoditizes. Vendors with the scale to balance footprint density, advanced routing, and zero-trust security remain best positioned as large over-the-top video providers begin to in-source traffic and squeeze independent operators.
Key Report Takeaways
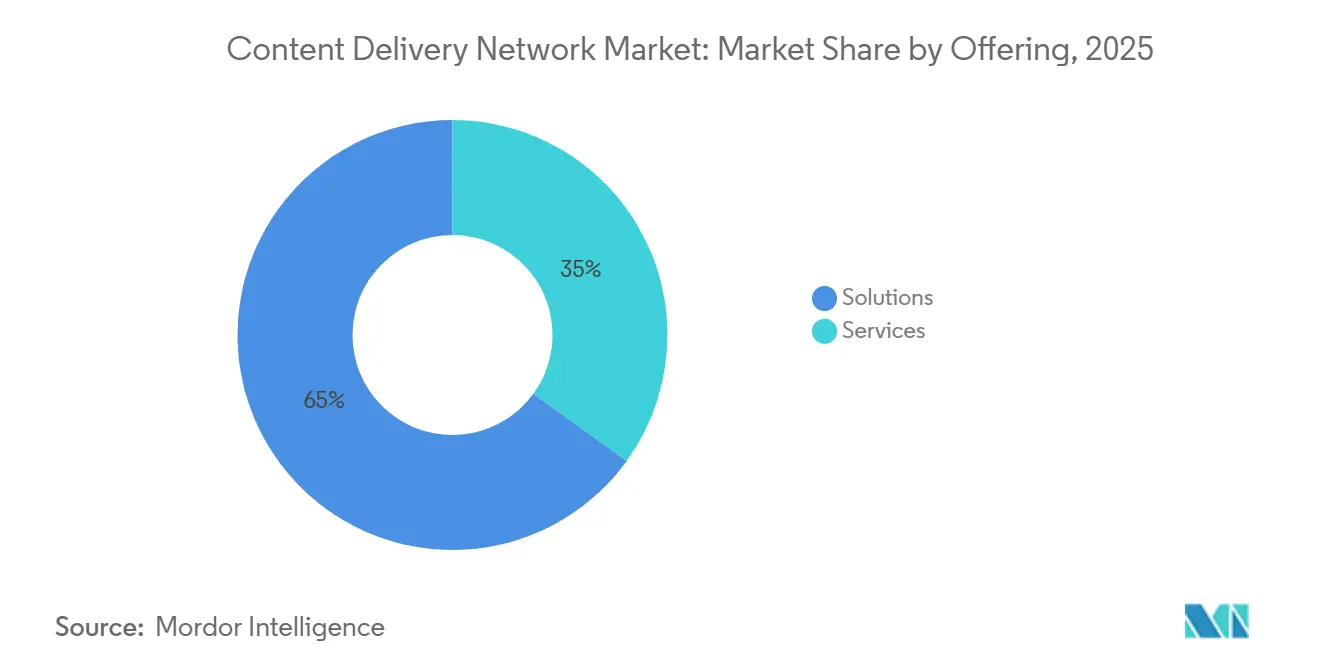
- By offering, solutions commanded 65.03% of 2025 revenue, while services are projected to advance at a 12.44% CAGR through 2031.
- By content type, Video CDN captured 62.41% of 2025 spend and is forecast to expand at a 13.01% CAGR through 2031, whereas non-video workloads grow more slowly but are critical for application programming interface delivery.
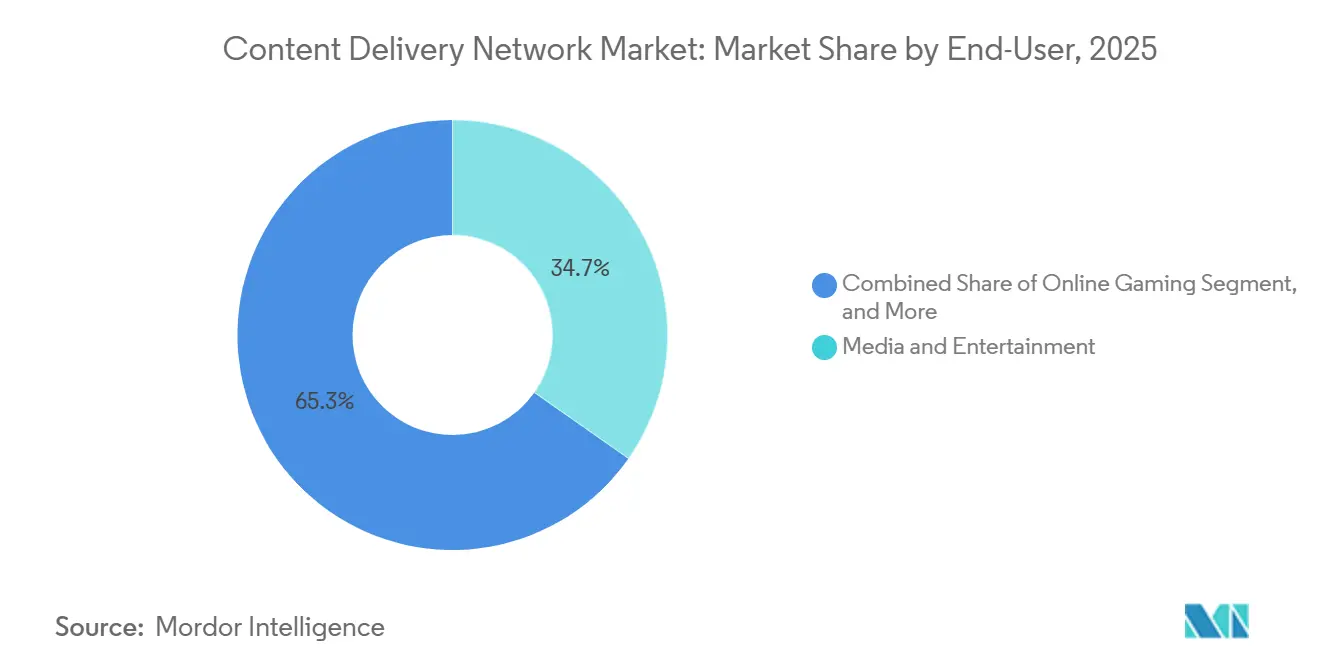
- By end user, Media and entertainment contributed 34.73% of 2025 end-user revenue; online gaming is expected to post the fastest 12.31% CAGR to 2031 on the back of esports and cloud platforms.
- By service-provider type ,traditional and telecommunications CDNs held 45.49% of 2025 revenue, yet peer-to-peer architectures are projected to grow at a 12.38% CAGR through 2031 by redistributing traffic across user devices.
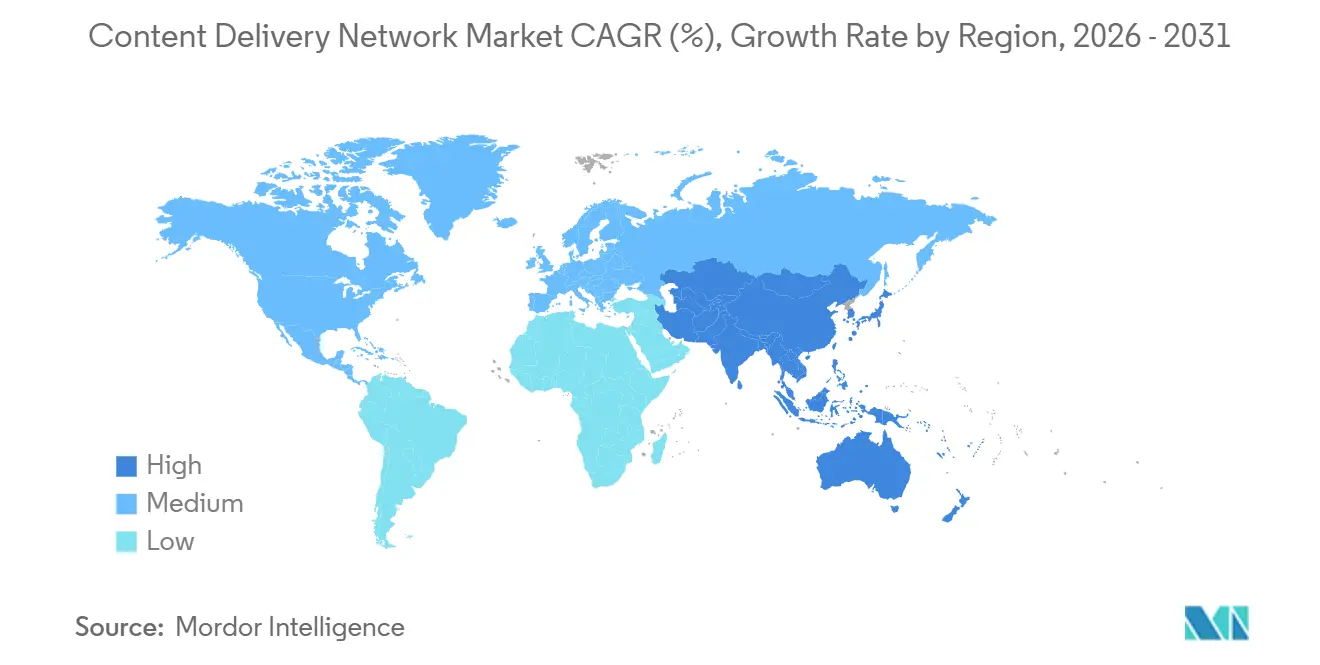
- By geography, North America accounted for 38.91% of 2025 revenue, while Asia Pacific is set to register the quickest 12.89% CAGR owing to surging mobile-video consumption in India, Indonesia, and Vietnam.
Note: Market size and forecast figures in this report are generated using Mordor Intelligence’s proprietary estimation framework, updated with the latest available data and insights as of January 2026.
Global Content Delivery Network Market Trends and Insights
Drivers Impact Analysis*
| Driver | (~) % Impact on CAGR Forecast | Geographic Relevance | Impact Timeline |
|---|---|---|---|
| Explosion of OTT Video Traffic and 4K/8K Adoption | +2.80% | Global, with concentration in North America and Asia Pacific | Medium term (2-4 years) |
| Proliferation of Edge-Native, Low-Latency Use-Cases (AR/VR, Cloud Gaming) | +2.30% | North America, Europe, and APAC urban centers | Medium term (2-4 years) |
| Integration of Zero-Trust and WAAP Security Bundles in CDN Stacks | +1.90% | Global, regulatory-driven in Europe and North America | Short term (≤ 2 years) |
| AI-Optimized Traffic Routing Reducing Egress Bills for Hyperscalers | +1.70% | Global, led by hyperscale cloud providers | Short term (≤ 2 years) |
| Telco Network-API Exposure Accelerating Network-as-Code CDNs | +1.50% | Europe, Asia Pacific, with CAMARA adoption | Long term (≥ 4 years) |
| Demand-Response Incentives for Power-Hungry PoPs Amid Grid Constraints | +0.90% | Europe, California, Singapore | Long term (≥ 4 years) |
| Source: Mordor Intelligence | |||
Explosion of OTT Video Traffic and 4K/8K Adoption
Streaming now represents more than 80% of global internet traffic, and 4K feeds account for 35% of premium subscriptions, while 8K pilots are appearing in live sports broadcasts.[1]“Global Video Traffic Forecast,” Cisco Systems Inc., cisco.com A single 4K stream draws about 25 megabits per second, a five-fold jump from 1080p, so cache placement near viewers is essential to prevent buffering that drives customer churn. Every 10-point rise in cache-hit ratio can shave as much as 20% from origin-fetch costs, allowing edge-storage investments to pay back inside 18 months.[2]“2025 DDoS Trends Report,” Cloudflare Inc., cloudflare.com Broadcasters encode up to twelve adaptive-bit rate levels, which multiplies storage overhead but let’s playback shift down smoothly during congestion. Mobile operators in Asia Pacific are provisioning 5G slices that guarantee video quality of service, turning premium delivery into a differentiated revenue stream.[3]“5G Network Slicing for Media,” Telefonaktiebolaget LM Ericsson, ericsson.com
Proliferation of Edge-Native, Low-Latency Use-Cases (AR/VR, Cloud Gaming)
Cloud gaming and immersive reality require round-trip latency below 20 milliseconds, a figure that core data centers cannot achieve for users more than 500 kilometers away. CDN operators are therefore installing graphics-processing-unit nodes in tier-two and tier-three cities, converting delivery networks into distributed compute fabrics. Microsoft reported that trimming latency from 30 milliseconds to 18 milliseconds extended average gaming sessions by 22%. Each edge deployment with 10 high-end GPUs can cost roughly USD 500,000, which encourages multi-year contracts to secure utilization. Telecommunications carriers are placing compute directly inside radio networks to cut backhaul hops and power real-time augmented-reality navigation for mobile users.
Integration of Zero-Trust and WAAP Security Bundles in CDN Stacks
Distributed denial-of-service attacks climbed 25% in 2025, with the largest incident spiking at 5.6 terabits per second. Firms are merging delivery and protection to avoid the latency penalty of distinct scrubbing centers, effectively blurring the line between CDN and web-application firewall offerings. Zero-trust designs enforce continuous authentication, so inspection must occur at the edge where encrypted payloads can be checked before they strain origin servers. The European Union’s NIS2 rule now requires breach reports inside 24 hours and enables fines of up to 2% of global revenue, turning integrated security from a nice-to-have feature into a compliance baseline. Bot-management modules already account for nearly one-fifth of CDN services revenue as retailers fight credential-stuffing and inventory-hoarding software.
AI-Optimized Traffic Routing Cutting Hyperscaler Egress Bills
Hyperscalers can face cross-region egress charges of USD 0.08 per gigabyte, so machine-learning models that predict congestion and divert flows toward cheaper paths have become a priority. Real-time telemetry feeds from border-gateway-protocol sessions and internet-exchange probes refresh optimization every five minutes to maintain latency under 50 milliseconds while lowering egress spend by up to 30%. A 10% cut in traffic fees can finance another 500 edge nodes, creating a flywheel effect in cache proximity. Smaller networks license open-source optimization engines, which erodes the first-mover advantage of large providers and returns competition to raw cost per gigabyte. As predictive routing becomes standard, vendors will need other levers, such as integrated compute and analytics, to retain pricing power.
Restraints Impact Analysis*
| Restraint | (~) % Impact on CAGR Forecast | Geographic Relevance | Impact Timeline |
|---|---|---|---|
| Large OTTs In-sourcing DIY CDNs | -1.80% | Global, concentrated in North America and Europe | Short term (≤ 2 years) |
| Commodity Pricing Pressure and Margin Squeeze | -1.40% | Global, most acute in competitive markets | Medium term (2-4 years) |
| Last-Mile Bandwidth Bottlenecks in Emerging Economies | -0.90% | Asia Pacific, Africa, Latin America | Long term (≥ 4 years) |
| Rising Data-Centre Energy Caps and Sustainability Mandates | -0.70% | Europe, California, Singapore | Medium term (2-4 years) |
| Source: Mordor Intelligence | |||
Large OTTs In-sourcing DIY CDNs
Netflix has deployed more than 30,000 Open Connect appliances inside internet-service-provider facilities, caching 95% of its streams locally and saving hundreds of millions of dollars in third-party fees. Disney+ and Prime Video are following suit, pulling large traffic volumes away from commercial vendors and diluting the volume leverage that once underpinned aggressive point-of-presence expansion. Cheap white-box hardware has dropped appliance cost from USD 50,000 to USD 15,000, making self-build viable even for regional broadcasters, which further shrinks the addressable pool for traditional providers. The result is a bifurcated Content Delivery Network market where tier-one video brands own distribution and independent operators chase mid-tier clients who prize turnkey services over scale. To defend margins, incumbents are packaging real-time analytics, edge compute, and advanced security, services that do not translate easily to do-it-yourself infrastructures.
Commodity Pricing Pressure and Margin Squeeze
Global transit prices fell 12% year over year in 2025 as fresh subsea cables and long-haul fiber tempered capacity scarcity. Gross margins for tier-one CDN operators slid from 65% in 2020 to 58% in 2025, prompting data-center consolidation and workforce cuts as providers race to protect profitability. Start-ups such as Bunny.net list transfer at USD 0.01 per gigabyte, half the rate of legacy players, and rely on self-service portals to keep overhead low. Cloud hyperscalers bundle delivery into compute contracts at no additional fee, turning CDN into a loss leader that amplifies lock-in. Independent vendors therefore climb the value chain with serverless runtimes and programmable edge logic that command 20%-30% higher gross margins, but this pivot demands developer-centric ecosystems and sales motions many lack.
*Our forecasts treat driver/restraint impacts as directional, not additive. The impact forecasts reflect baseline growth, mix effects, and variable interactions.
Segment Analysis
By Offering: Solutions Lead, Services Accelerate Through Managed Security
Solutions accounted for 65.03% of 2025 revenue as enterprises invested in caching appliances, traffic-management software, and edge compute that sit on their own balance sheets. Services, however, are projected to grow at a 12.44% CAGR to 2031, reflecting an ongoing shift toward outsourcing optimization and security tasks that firms no longer treat as core. Managed-security offerings now make up 22% of the services category, bundling distributed-denial-of-service mitigation, web-application firewalls, and bot control into a single contract that slashes procurement friction. Professional services contribute another 18% and cater to media brands that need bespoke workflows for live events and flash sales. Software-defined delivery architectures are lowering the capital intensity of on-premises hardware, which slows new solution installs but widens the user base for pay-as-you-go services. API-driven automation that lets developers purge objects or update rules through code is emerging as the chief competitive wedge. Customers that integrate delivery into continuous-integration pipelines move faster and cut operational toil, advantages that reinforce the services growth streak in the Content Delivery Network market.
The spending pivot also improves resiliency for smaller organizations that once relied on thin internal teams. Outsourced services deliver round-the-clock monitoring and incident response that individual companies cannot staff locally. Providers capture steady subscription revenue, which cushions them against the volatility of usage-based solution sales. Yet margin pressure persists, so vendors bundle higher-value consulting and compliance audits to raise average contract value. As a result, managed offerings will keep outpacing hardware even though solutions remain the single largest revenue pool within the Content Delivery Network market.


By Content Type: Video CDN Dominates, Non-Video Gains in API and IoT Traffic
Video workloads represented 62.41% of 2025 spending, and the segment is poised to post a 13.01% CAGR through 2031 as 4K and 8K streams saturate consumer demand. Adaptive-bitrate ladders have expanded storage footprints, yet efficiencies from new codecs such as AV1 offset some of the bandwidth burden. Non-video traffic that covers web pages, software downloads, and API responses holds 37.59% share and grows more slowly, but reliability demands are strict. API calls that underpin payments or inventory checks must return in under 200 milliseconds, so operators deploy advanced routing and edge logic to protect latency. The rise of single-page applications and microservices inflates the number of API requests per user, raising cacheable objects and expanding the monetizable surface.
Edge compute is blurring the lines between video and non-video. Serverless functions that manipulate manifests or personalize content now execute on the same node that serves static media, cutting backhaul hops and improving responsiveness. Providers able to consolidate both content classes on one platform reduce contract complexity and lower total cost of ownership by as much as 20%. These efficiencies lock in customers and fortify wallet share, supporting revenue diversity in the Content Delivery Network market.
By End User: Media Leads, Online Gaming Surges on Esports and Cloud Platforms
Media and entertainment delivered 34.73% of 2025 revenue as over-the-top streaming services, broadcasters, and music platforms pushed petabytes through edge caches every day. Online gaming, although smaller, is the clear growth star at a 12.31% CAGR to 2031 because esports tournaments and cloud platforms demand deterministic latency that traditional best-effort networks cannot meet. E-commerce stands at 19%, driven by flash sales such as Black Friday, where traffic can spike fourfold. Healthcare sits at 8% and focuses on secure telemedicine and imaging transfers that meet Health Insurance Portability and Accountability Act obligations. Financial services contribute 12%, prioritizing low-latency APIs for fraud detection and mobile banking, while education and research supply 6% through online courses and data-sharing collaborations. Advertising handles 11%, where real-time bidding hinges on microsecond delivery.
Vertical specialization is becoming table stakes. Gaming clouds need packet-level acceleration, healthcare insists on regional data-residency, and commerce requires Payment Card Industry certification. Providers that obtain these credentials can command premiums and extend lifetime value. The diverse mix protects the Content Delivery Network industry from overreliance on any single sector, yet it also spreads compliance costs across an expanding matrix of standards.

By Service-Provider Type: Telco CDNs Hold Share, Peer-to-Peer Architectures Disrupt
Traditional and telecommunications operators controlled 45.49% of the 2025 revenue pool by leveraging fiber footprints and pre-existing service-level agreements that reassure risk-averse enterprises. Cloud CDNs linked to hyperscale compute clouds captured 42%, bundling delivery at low or zero incremental cost to deepen customer lock-in. Peer-to-peer models, although starting from a small base, are expected to grow at a 12.38% CAGR by offloading as much as 70% of peak live-event traffic onto viewer devices and slashing origin load. The economic appeal is clear; streaming services with 10 million concurrent users can trim delivery bills by USD 2 million each month. Telecommunications operators seek to monetize 5G infrastructure by exposing quality-of-service APIs standardized by the CAMARA initiative, giving developers deterministic latency and device-location data.
The multiplicity of architectures fragments demand but also widens choice. Enterprises weigh pure performance against integration depth with existing cloud workloads, cost transparency, and regulatory alignment. In this competitive mix, providers that flexibly route across telco, cloud, and peer-to-peer paths stand to win contracts that prize resilience as much as speed. Their ability to abstract complexity determines their share of the Content Delivery Network market share at regional and global levels.
Geography Analysis
North America retained 38.91% of global revenue in 2025, anchored by large streaming platforms, hyperscale data centers, and an internet-exchange landscape that delivers sub-10-millisecond round trips between major cities. The region’s dense fiber grid supports premium pricing for latency-sensitive sectors such as algorithmic trading and cloud gaming. However, electricity constraints in California and Virginia delay new builds, prompting operators to join demand-response programs that reduce compute during grid stress. Canada’s revised Broadcasting Act channels 5% of local streaming revenue into domestic content, putting indirect funding behind edge nodes that distribute Canadian programming. Mexico’s growing middle class fuels mobile-video consumption, yet rural bandwidth limits temper demand for 4K delivery.
Asia Pacific is forecast to grow at a 12.89% CAGR to 2031, driven by mobile-first internet adoption in India, Indonesia, and Vietnam, where smartphone users outnumber broadband lines ten to one. China’s market follows separate regulatory logic, requiring foreign providers to partner locally and comply with content-filtering mandates. Japan and South Korea are rolling out 5G standalone cores that enable guaranteed service slices for video, establishing two-tier delivery models where premium speed carries a surcharge. India’s net-neutrality framework bans zero-rated video plans, which shifts cost sensitivity squarely onto content owners. Southeast Asia’s archipelagic geography inflates subsea-cable latency, so operators must place caches within each key market despite higher unit costs, while Australia’s National Broadband Network upgrade to fiber unlocks 4K demand on the continent.
Europe generated 24% of 2025 revenue and remains shaped by data-sovereignty policy. The General Data Protection Regulation and the forthcoming Data Act oblige providers to store personal data within the economic area, compelling in-region caching and audit trails. The Energy Efficiency Directive now forces facilities above 500 kilowatts to publish power-usage effectiveness, nudging operators toward renewable power-purchase agreements and liquid-cooling retrofits. Germany’s push for open-access fiber reduces interconnection fees and invites smaller entrants that compete on quality rather than footprint. The United Kingdom must manage separate adequacy rulings post-Brexit, adding administrative burden to cross-border delivery. Nordic states lure energy-intensive edge compute with clean hydroelectric and geothermal supply, while Italy and Spain lag in fiber density, limiting 4K uptake despite similar income levels.

Competitive Landscape
The Content Delivery Network market features moderate concentration. The top five providers Akamai Technologies Inc., Cloudflare Inc., Amazon Web Services Inc. CloudFront, Google LLC Cloud CDN, and Microsoft Corporation Azure CDN held about 60% of 2025 global revenue. Hyperscalers package delivery with compute, turning CDN into a loss-leader to secure higher-margin workloads. Independent operators respond by specializing in verticals such as gaming or healthcare where domain expertise trumps sheer scale. Emerging disruptors like BunnyWay d.o.o. (Bunny.net) and G-Core Labs S.A. publish transparent tariff menus and target underserved regions, which pressures incumbents to rationalize underused nodes.
Technology leadership is another separation line. Patent filings related to machine-learning cache prediction and edge-function orchestration jumped 40% in 2025, underscoring the arms race around software differentiation. Standards bodies such as the Internet Engineering Task Force are advancing inter-CDN federation protocols that allow independent networks to share capacity during flash crowds, a move that could erode proprietary footprint advantages. Sustainability is an emerging tender criterion as many European enterprises pledge net-zero operations, so providers tout renewable power sourcing and liquid-cooled racks to win contracts.
Mergers and acquisitions are heating up. Akamai bought Linode LLC for USD 900 million to fuse compute and delivery, while Deutsche Telekom AG and Vodafone Group Plc launched a joint network-as-code platform that exposes 5G quality-of-service APIs to developers. Exit activity also accelerated; Lumen Technologies Inc. divested its Latin American assets to focus on North America where it can leverage enterprise sales relationships. Strategic moves show that scale, integrated compute, and telco alliances dominate boardroom agendas as competition intensifies inside the Content Delivery Network market.
Content Delivery Network Industry Leaders
Amazon Web Services Inc. (Amazon.com Inc.)
Akamai Technologies Inc.
Google LLC (Alphabet Inc.)
Cloudflare Inc.
Edgio Inc.
- *Disclaimer: Major Players sorted in no particular order

Recent Industry Developments
- April 2025: Lumen Technologies and Google Cloud activated 400 Gbps private fiber links at 50,000 sites to support AI workloads and low-latency edge services.
- February 2025: Fastly introduced AI Accelerator, using edge semantic caching to cut OpenAI API calls and latency for developers.
- February 2025: Akamai signed a USD 100 million multi-year deal to supply full-stack cloud computing and security services to a global technology firm.
- January 2025: Akamai confirmed its mainland-China CDN exit by June 2026, coordinating customer migration via Tencent Cloud and Wangsu.


Global Content Delivery Network Market Report Scope
The Content Delivery Network Market Report is Segmented by Offering (Solutions, Services), Content Type (Video CDN, Non-Video CDN), End User (Media and Entertainment, Online Gaming, E-Commerce, Healthcare, BFSI, Education and Research, Advertising), Service-Provider Type (Traditional/Telco CDN, Cloud/Hyper-Scale CDN, Peer-to-Peer CDN), and Geography (North America, South America, Europe, Asia Pacific, Middle East and Africa). The Market Forecasts are Provided in Terms of Value (USD).
| Solutions |
| Services |
| Video CDN |
| Non-Video CDN |
| Media and Entertainment |
| Online Gaming |
| E-Commerce |
| Healthcare |
| BFSI |
| Education and Research |
| Advertising |
| Traditional/Telco CDN |
| Cloud/Hyper-Scale CDN |
| Peer-to-Peer CDN |
| North America | United States | |
| Canada | ||
| Mexico | ||
| South America | Brazil | |
| Argentina | ||
| Rest of South America | ||
| Europe | United Kingdom | |
| Germany | ||
| France | ||
| Italy | ||
| Spain | ||
| Nordics | ||
| Rest of Europe | ||
| Asia Pacific | China | |
| India | ||
| Japan | ||
| South Korea | ||
| ASEAN | ||
| Rest of Asia Pacific | ||
| Middle East and Africa | Middle East | Saudi Arabia |
| United Arab Emirates | ||
| Turkey | ||
| Rest of Middle East | ||
| Africa | South Africa | |
| Egypt | ||
| Nigeria | ||
| Rest of Africa | ||
| By Offering | Solutions | ||
| Services | |||
| By Content Type | Video CDN | ||
| Non-Video CDN | |||
| By End User | Media and Entertainment | ||
| Online Gaming | |||
| E-Commerce | |||
| Healthcare | |||
| BFSI | |||
| Education and Research | |||
| Advertising | |||
| By Service-Provider Type | Traditional/Telco CDN | ||
| Cloud/Hyper-Scale CDN | |||
| Peer-to-Peer CDN | |||
| By Geography | North America | United States | |
| Canada | |||
| Mexico | |||
| South America | Brazil | ||
| Argentina | |||
| Rest of South America | |||
| Europe | United Kingdom | ||
| Germany | |||
| France | |||
| Italy | |||
| Spain | |||
| Nordics | |||
| Rest of Europe | |||
| Asia Pacific | China | ||
| India | |||
| Japan | |||
| South Korea | |||
| ASEAN | |||
| Rest of Asia Pacific | |||
| Middle East and Africa | Middle East | Saudi Arabia | |
| United Arab Emirates | |||
| Turkey | |||
| Rest of Middle East | |||
| Africa | South Africa | ||
| Egypt | |||
| Nigeria | |||
| Rest of Africa | |||


Key Questions Answered in the Report
What was the value of the Content Delivery Network market in 2026?
The market stood at USD 29.34 billion in 2026.
Which segment holds the largest Content Delivery Network market share?
Solutions held the largest share at 65.03% of 2025 revenue.
Which region is forecast to grow fastest through 2031?
Asia Pacific is projected to post the highest 12.89% CAGR.
Why are peer-to-peer CDNs gaining traction?
They cut up to 70% of live-event traffic costs by leveraging viewer devices.
How are hyperscalers influencing CDN prices?
They bundle delivery with compute at little or no extra cost, driving down per-gigabyte rates.
What latency threshold does cloud gaming typically require?
Successful cloud gaming targets end-to-end latency below 20 milliseconds.
Page last updated on:


