Computational Drug Discovery Market Size and Share
Market Overview
| Study Period | 2020 - 2031 |
|---|---|
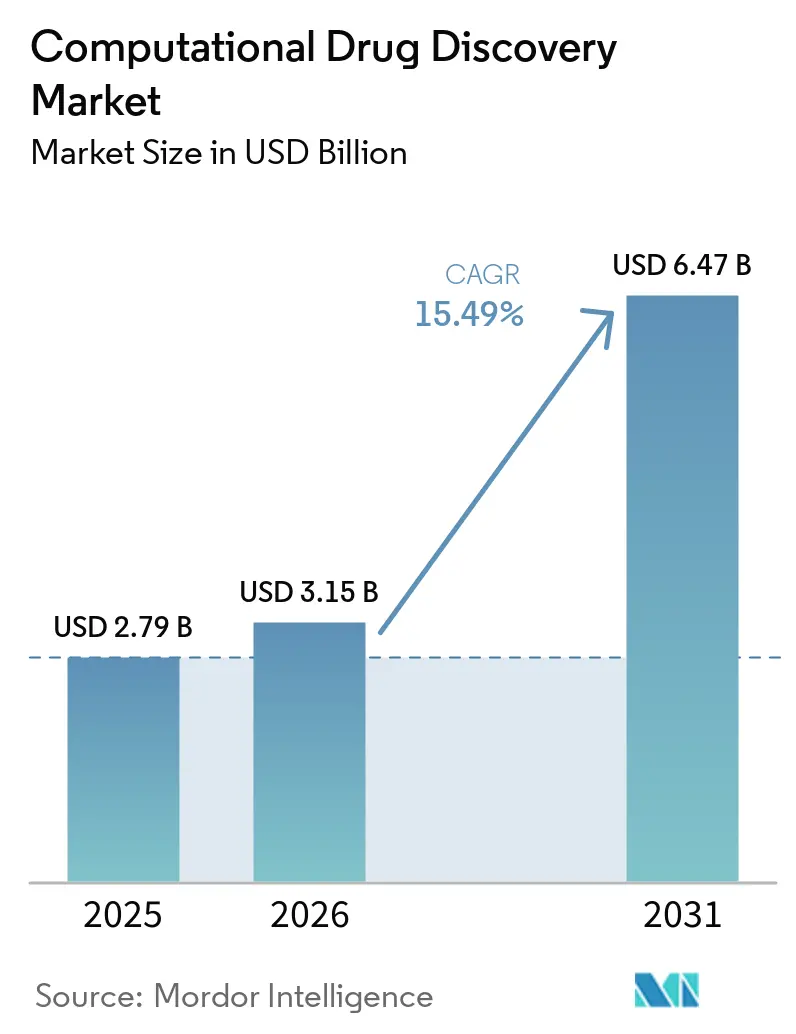
| Market Size (2026) | USD 3.15 Billion |
| Market Size (2031) | USD 6.47 Billion |
| Growth Rate (2026 - 2031) | 15.49% CAGR |
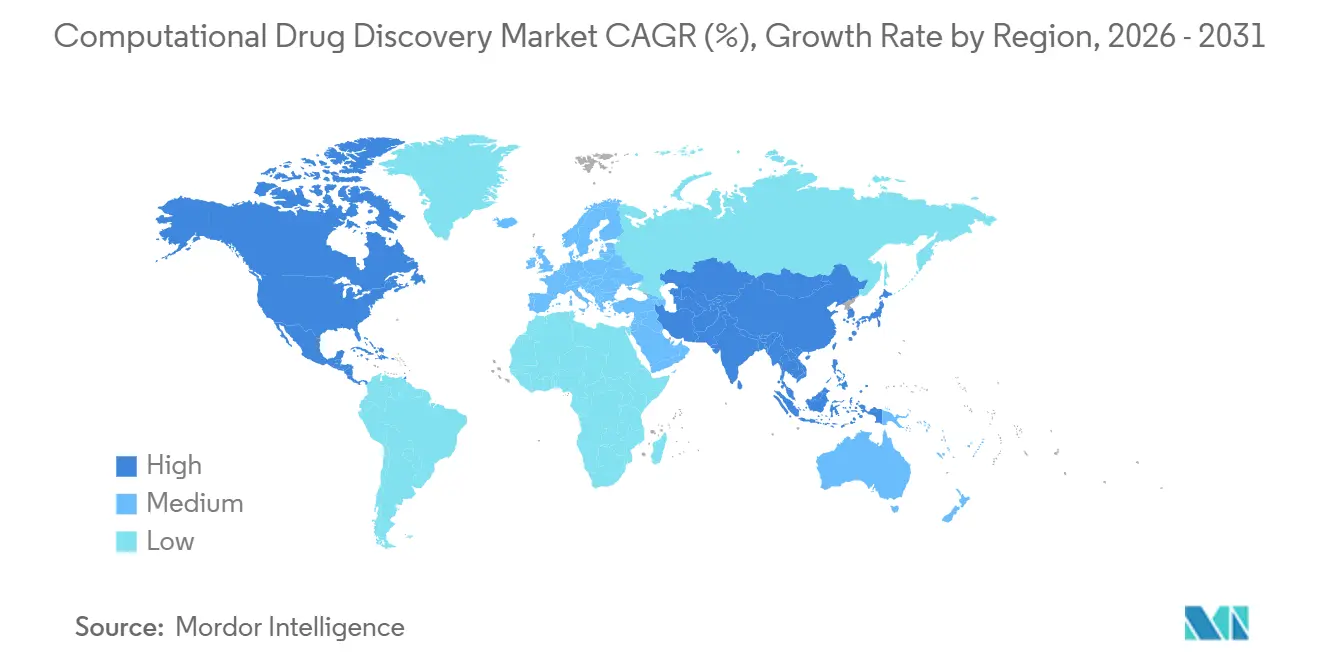
| Fastest Growing Market | Asia Pacific |
| Largest Market | North America |
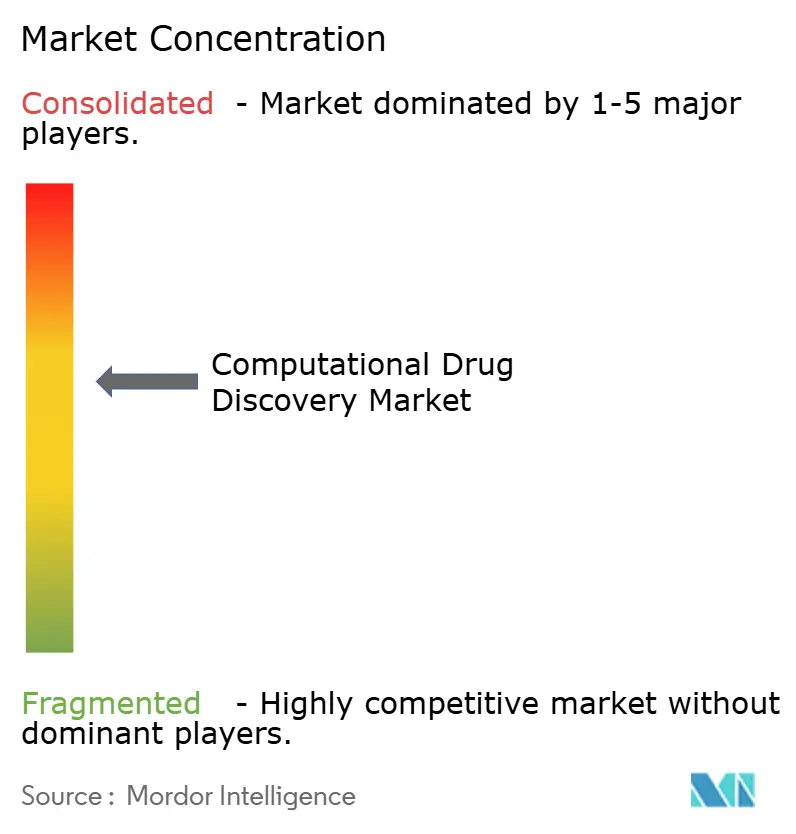
| Market Concentration | Medium |
Major Players *Disclaimer: Major Players sorted in no particular order Image © Mordor Intelligence. Reuse requires attribution under CC BY 4.0. | |
Computational Drug Discovery Market Analysis by Mordor Intelligence
The computational drug discovery market size is expected to be USD 2.79 billion in 2025, USD 3.15 billion in 2026, and reach USD 6.47 billion by 2031, growing at a CAGR of 15.49% from 2026 to 2031. Strong momentum stems from soaring R&D expenses, a widening venture-funding gap for traditional biotech, and headline deals such as Eli Lilly’s USD 2.75 billion alliance with Insilico Medicine, which proved that AI-native platforms now attract valuations comparable with late-stage asset acquisitions. Merger activity—illustrated by the USD 688 million Recursion–Exscientia tie-up in August 2024—compressed competitive lines and deepened data moats. Pharmaceutical sponsors are internalizing algorithms rather than outsourcing routine modeling, driving software and AI platforms to 59.58% of 2025 revenue and catalyzing a pivot from fee-for-service engagements to subscription models. Meanwhile, ultra-large virtual screening now assesses 10 trillion protein–molecule pairs a day through frameworks such as DrugCLIP, unlocking lead-generation bandwidth once reserved for the world’s largest HPC centers.
Key Report Takeaways
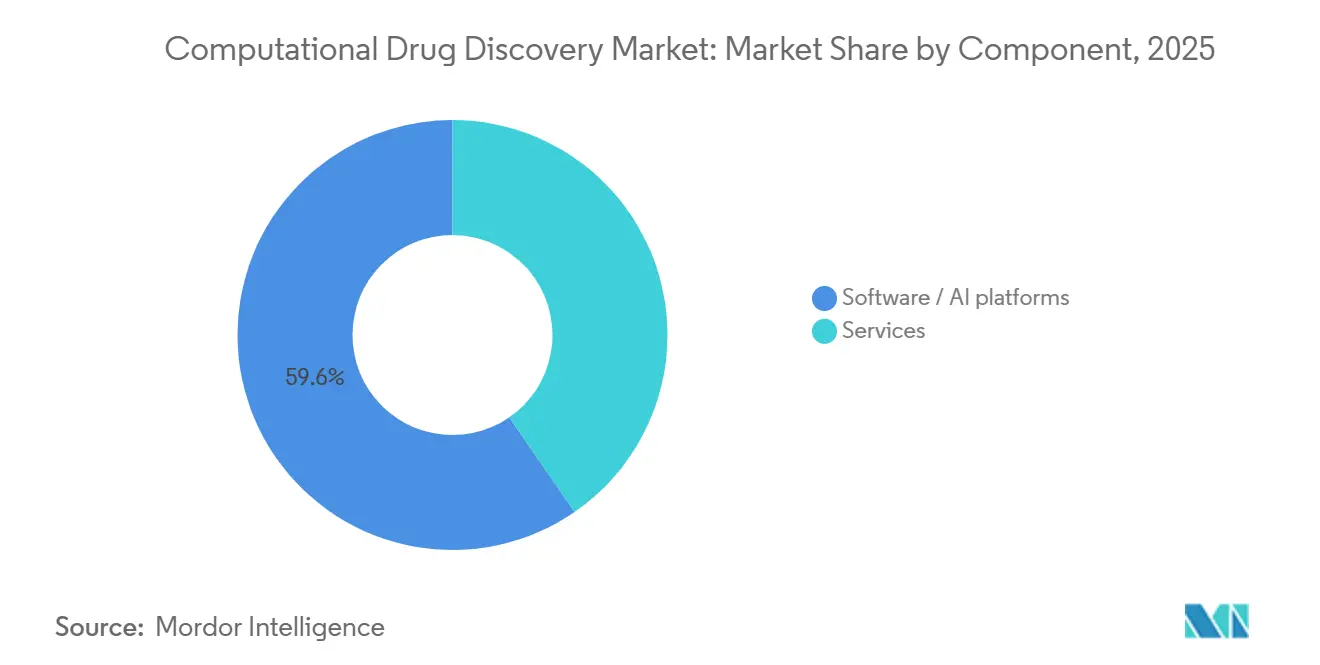
- By component, software/AI platforms captured 59.58% of the computational drug discovery market share in 2025. The same component segment is advancing at a 17.24% CAGR through 2031.
- By workflow, target identification and validation commanded 56.53% of 2025 revenue, while lead discovery is the fastest-growing workflow at a 16.82% CAGR to 2031.
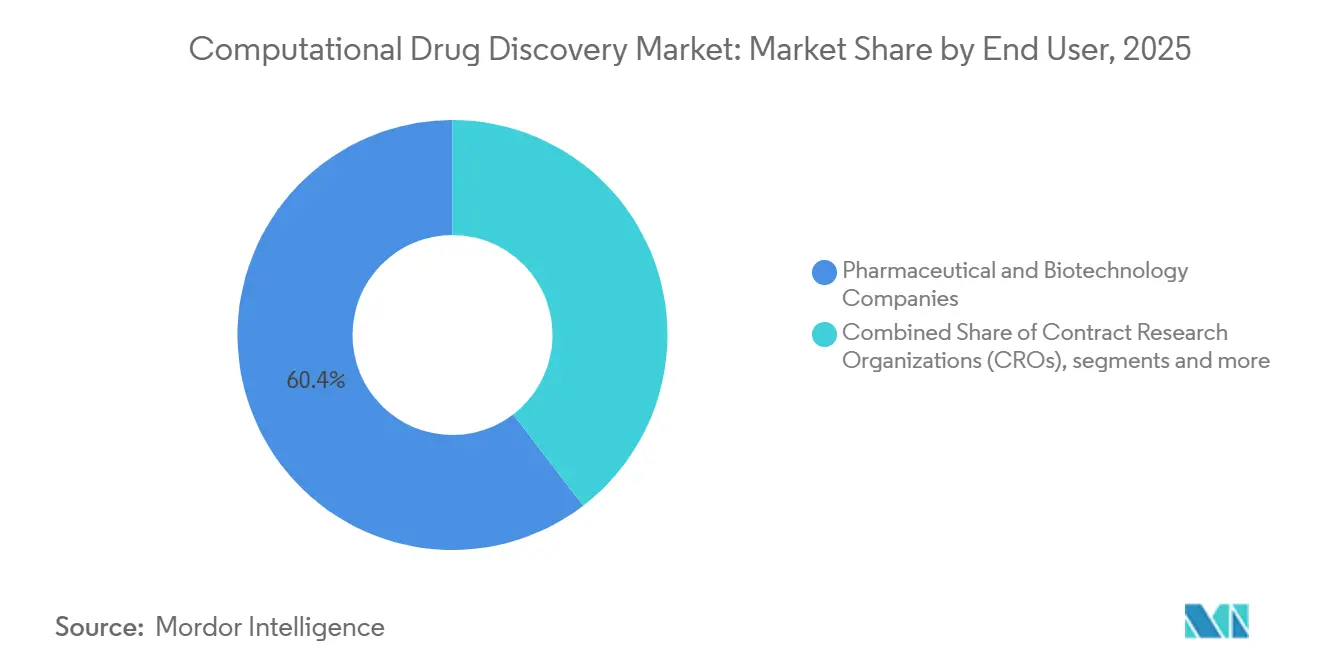
- By end user, pharmaceutical and biotechnology companies held 60.44% of 2025 spending; contract research organizations exhibit the quickest expansion at 16.91% annually to 2031.
- By technology, structure-based drug design accounted for a 56.23% slice of the computational drug discovery market size in 2025; quantum and accelerated computing platforms are forecast to expand at 17.42% CAGR through 2031.
- By geography, North America led with 47.76% revenue in 2025, while Asia-Pacific is projected to post a 17.34% CAGR to 2031.
Note: Market size and forecast figures in this report are generated using Mordor Intelligence’s proprietary estimation framework, updated with the latest available data and insights as of January 2026.
Global Computational Drug Discovery Market Trends and Insights
Drivers Impact Analysis*
| Driver | (~) % Impact on CAGR Forecast | Geographic Relevance | Impact Timeline |
|---|---|---|---|
| Escalating R&D cost pressures driving adoption of in-silico platforms | +3.2% | Global | Long term (≥ 4 years) |
| Rapid advances in AI/ML and generative chemistry algorithms | +3.5% | North America, EU, China | Medium term (2–4 years) |
| Cloud/SaaS delivery models lowering entry barriers | +2.8% | Global, notably APAC & South America | Short term (≤ 2 years) |
| Regulatory embrace of model-informed drug-development guidelines | +2.1% | North America, EU, Japan | Medium term (2–4 years) |
| Quantum computing breakthroughs enabling sub-hour free-energy calculations | +1.9% | North America & EU, early China adoption | Long term (≥ 4 years) |
| Patient digital-twin integration fueling in-silico trial-simulation demand | +1.6% | North America & EU, pilot APAC sites | Medium term (2–4 years) |
| Source: Mordor Intelligence | |||
Escalating R&D Cost Pressures Driving Adoption of In-Silico Platforms
Per-drug R&D costs topped USD 2.6 billion in 2024 while Phase II oncology success rates stalled near 8%, forcing sponsors to trim attrition early. Virtual workflows collapse target-to-candidate cycles from six years to under two, letting teams fail fast and cheaply. Eli Lilly’s USD 2.75 billion pact with Insilico Medicine delivered Rentosertib into Phase IIa inside 30 months, validating the approach.[1]Insilico Medicine, “Insilico Medicine Partnerships and Pipeline,” insilicomedicine.comVenture funding, down 40% for classic biotech Series A rounds in 2025, now favors asset-light AI business models. CROs meanwhile mandate ADME/Tox predictions before wet-lab studies, cutting preclinical attrition up to one-third and saving USD 1–3 million per program.
Rapid Advances in AI/ML and Generative Chemistry Algorithms
DrugCLIP screens 10 trillion protein–molecule pairs daily, shrinking month-long hit campaigns to hours. Isomorphic Labs’ IsoDDE improves antibody-antigen accuracy 2.3-fold over AlphaFold3, enabling design without crystal structures.[2]Isomorphic Labs, “IsoDDE: Next-Generation Protein Structure Prediction,” isomorphiclabs.comAstraZeneca’s MapDiff halves the loop from virtual hit to synthesized analog, and GPU clusters built on H100 silicon trim model-training windows from 18 months to six for Genesis Therapeutics. Latent Labs’ antibody platform iterates affinity maturation 56 times faster than hybridoma, proving generative AI’s reach beyond small molecules. Together these gains expand pipeline breadth while slashing per-program cost.
Cloud/SaaS Delivery Models Lowering Entry Barriers
Quantori’s Q-Discover lets startups run million-compound screens for under USD 10,000, eliminating capital expense for on-premise HPC. Mind the Byte prices ADME prediction at USD 0.05 a molecule—95% below traditional CRO quotes. Rescale offers quantum-chemistry SaaS that spins up 10,000-core clusters on demand. As 62% of biopharma IT budgets shifted to cloud in 2025, elastic pricing became the default procurement model. Lower entry barriers widen customer reach to academic labs and small biotechs that previously lacked compute access.
Regulatory Embrace of Model-Informed Drug-Development Guidelines
ICH M15, adopted January 2026 and effective July 2026, for the first time harmonizes use of quantitative models in submissions.[3]International Organization for Standardization, “ISO 13485 Medical Devices Quality Management,” iso.org The FDA’s paired-meeting program, expanded in 2025, cuts 3–6 months from pre-IND alignment when sponsors present validated simulations. EMA draft guidance mandates dataset provenance and uncertainty quantification, creating a predictable template for EU filings. Japan’s PMDA consultation on in-silico toxicity substitutes signals widening Asian acceptance. By letting certain animal studies be bypassed, regulators save up to USD 1 million and nine months off early development.
Restraints Impact Analysis*
| Restraint | (~) % Impact on CAGR Forecast | Geographic Relevance | Impact Timeline |
|---|---|---|---|
| High upfront HPC and specialized-talent requirements | -1.8% | Global, acute in emerging markets | Short term (≤ 2 years) |
| Data silos and poor interoperability across multi-omics datasets | -1.4% | Global | Medium term (2–4 years) |
| Regulatory pushback on explainability of AI-designed molecules | -0.9% | North America, EU, and Japan | Medium term (2–4 years) |
| GPU/compute supply-chain crunch limiting capacity (2026–2029) | -1.2% | Global, peak 2026–2028 | Short term (≤ 2 years) |
| Source: Mordor Intelligence | |||
High Upfront HPC and Specialized-Talent Requirements
Building a fit-for-purpose cluster costs USD 2–5 million, with another USD 0.5–1 million a year to operate, figures that deter mid-size biotechs. Less than 10,000 experts globally command cross-disciplinary AI and medicinal-chemistry skills, and salaries top USD 200,000 in major hubs. Academic grants rarely cover GPUs, forcing labs into national queues stretching past six months. Emerging economies face higher cloud pricing—20–30% above U.S. rates—because of limited data-center capacity. Training supply lags demand; fewer than 50 universities offer dedicated AI-drug-discovery programs, producing only a small fraction of the 5,000 specialists needed yearly.
Data Silos and Poor Interoperability Across Multi-Omics Datasets
Just 15% of biopharma datasets meet full FAIR criteria, so data scientists spend up to 60% of project hours harmonizing incompatible formats. Proprietary file types from Schrödinger or Dassault hinder migration, inflating switching costs and stifling innovation. Public repositories like ChEMBL and PubChem use diverging identifiers, demanding custom parsers for integration. Multi-omics joins are hardest: linking CRISPR, RNA-seq, and imaging data often introduces 20–30% error that degrades model accuracy. Without standardized ontologies, AI platforms cannot fully exploit expanding biological datasets.
*Our forecasts treat driver/restraint impacts as directional, not additive. The impact forecasts reflect baseline growth, mix effects, and variable interactions.
Segment Analysis
By Component: Internal Software /AI Platforms Outpace Services
Software/AI platforms led the computational drug discovery market size with a 59.58% revenue share in 2025 and are projected to expand at a 17.24% CAGR to 2031. Their dominance reflects pharma’s pivot toward owning core algorithms, exemplified by Lilly’s decision to run Insilico’s generative engine on internal servers after the USD 2.75 billion deal. Services still matter for smaller sponsors seeking turnkey campaigns, but cloud-native pricing models—USD 0.05 per ADME prediction on Mind the Byte—have eroded the premium once charged by CROs.
Rising subscription footprints mean platform vendors now bundle quarterly model updates, compliance toolkits, and user training, blurring the former product–service divide. Certara’s Simcyp package, re-launched in 2025, adds automatic PBPK template refreshes and on-demand webinars, fostering stickiness while helping clients satisfy ICH M15 traceability rules. Services revenue therefore grows modestly as sponsors emphasize skills transfer rather than perpetual outsourcing.


By Workflow: Lead Discovery Surges on Ultra-Large Virtual Screening
Target identification and validation held 56.53% of 2025 spending, yet lead discovery is advancing at a 16.82% CAGR, tightening the gap. Breakthroughs like DrugCLIP’s 10 trillion-pair daily throughput allow sponsors to compress hit-identification from six months to under a week, turbo-charging internal medicinal chemistry.
Ultra-large screens also democratize fragment expansion for rare-disease targets once deemed commercially unattractive. PyRMD2Dock’s 7.3% sub-micromolar hit rate against CD28 shows that algorithmic scale can rival physical HTS quality for a fraction of the cost. Regulatory constraints still require wet-lab confirmation for pre-clinical ADME/Tox predictions, but integration with quantum-enabled free-energy estimation shortens cycle times even there.
By End User: Contract Research Organizations (CROs) Adopt AI Tools to Defend Margins
Pharmaceutical and biotechnology companies held 60.44% of outlays in 2025, yet the contract research organizations (CROs) customer set shows the steepest climb at 16.91% annually to 2031 as sponsors push for lower-cost blended service bundles. Charles River, Covance, and others license Schrödinger or Atomwise engines to package virtual screening, synthesis, and bioassays into single contracts, cutting discovery timelines by one-quarter.
Academic institutes struggle with infrastructure budgets, but elastic supercomputers such as Atommap’s allow pay-per-task usage that scales from a lone target to portfolio-wide campaigns, opening computational drug discovery market opportunities across teaching hospitals and smaller research centers.
By Technology: Quantum and Accelerated Computing Rapidly Gain Share
Structure-based drug design dominated with 56.23% of 2025 revenue, yet quantum/accelerated computing technology is expanding 17.42% per year, pulled by AstraZeneca’s 20-fold quantum speedups and NVIDIA’s ALCHEMI toolkit delivering up to 33-fold faster molecular dynamics. Hybrid quantum–classical workflows now routinize tasks once booked on national supercomputers, such as sub-kilocalorie binding-affinity prediction, while keeping data in secure on-premise clusters.
Ligand-based approaches remain relevant for first-pass SAR, but tighter regulatory scrutiny on interpretability favors structure-anchored methods that align with ICH M15. GPU-native molecular-dynamics engines, including NAMD’s recent GPU-resident mode, enable microsecond simulations on departmental budgets and underpin the computational drug discovery market share lead held by structure-based tools.
Geography Analysis
North America contributed 47.76% of 2025 global revenue, driven by venture capital depth, dense pharma headquarters, and first-mover cloud adoption. FDA programs such as model-informed paired meetings and Project Optimus have accelerated regulatory comfort with algorithmic dossiers, reducing cycle times and anchoring platform vendors’ largest commercial footprints.
Asia-Pacific posts the fastest expansion, a 17.34% CAGR, as China, India, and Japan bankroll sovereign AI and streamline approval pathways. China hosts one-third of the global innovation pipeline, executing parallel in-silico and wet-lab campaigns that shorten hit-to-IND durations to 18 months. India’s Peptris capital-raise and Japan’s Ono–Congruence partnership in 2026 highlight rising regional sophistication in peptide and biophysics-driven discovery, respectively.
Europe benefits from high-caliber academic consortia and EMA openness to digital-biology evidence, though venture funding lags the United States and regulatory fragmentation across member states hampers scale. Middle East & Africa and South America remain nascent but attract multinational clinical trials as local CROs adopt cloud SaaS platforms that circumvent HPC shortages.

Competitive Landscape
The computational drug discovery market is moderately concentrated, with the majority of platform revenue held by the top vendors. Market leaders such as Schrödinger, Certara, and Dassault Systèmes maintain their position by bundling enterprise‑grade suites with long‑term validation and compliance support, including alignment with ICH M15 audit requirements. AI-native challengers—Insilico, Exscientia, Recursion—counter with data-rich foundation models that spawn proprietary assets and milestone-laden mega-deals, such as Recursion’s USD 1.7 billion Bayer alliance covering 10 programs.
Data gravity is the principal moat: Recursion’s 50 petabytes of cellular imaging and Exscientia’s trillion-scale compound predictions furnish training sets most peers cannot match. NVIDIA’s ALCHEMI and cuQuantum SDKs elevate hardware vendors to ecosystem linchpins, enabling 30-fold speedups that tilt total cost of ownership in favor of GPU-native stacks. Quantum specialists IonQ and IBM Quantum enter through free-energy acceleration, forging partnerships focused on oncology, mRNA, and complex allosteric targets.
Compliance posture separates serious contenders from fast-followers. Platforms embedding audit trails, model explainability, and uncertainty quantification aligned with FDA and EMA draft guidances now command price premiums and shorter sales cycles, especially in late-stage co-development projects where regulatory stakes are highest.
Computational Drug Discovery Industry Leaders
Microsoft
Solventum
Abridge
eClinicalWorks
Suki
- *Disclaimer: Major Players sorted in no particular order

Recent Industry Developments
- April 2026: NVIDIA released the ALCHEMI toolkit, delivering 1.7–33 times faster GPU molecular dynamics on departmental infrastructure.
- March 2026: Ono Pharmaceutical teamed with Congruence Therapeutics to apply biophysics-driven AI to oncology pipelines.
- February 2026: Isomorphic Labs launched IsoDDE, improving antibody–antigen accuracy 2.3-fold over AlphaFold3.
- February 2026: Takeda inked a USD 1.7 billion collaboration with Iambic Therapeutics to accelerate multi-asset discovery.


Global Computational Drug Discovery Market Report Scope
According to the report’s scope, computational drug discovery refers to the use of computer‑based methods, such as molecular modeling, virtual screening, docking, pharmacophore modeling, and machine‑learning algorithms, to design, evaluate, and optimize potential drug candidates before laboratory testing. It accelerates early‑stage discovery by predicting molecular interactions, assessing drug‑like properties, and reducing experimental cost and time through in‑silico simulations.
The computational drug discovery market is segmented into component, workflow, end user, technology, and geography. By component, the market is segmented into software / AI platforms and services. By workflow, the market is segmented into target identification and validation, lead discovery, lead optimization, pre-clinical ADME/tox prediction, and others. By end-user, the market is segmented into pharmaceutical and biotechnology companies, contract research organizations (CROs), and academic and research institutes. By technology, the market is segmented into structure-based drug design (SBDD), ligand-based drug design (LBDD), AI / generative-AI platforms, molecular dynamics and simulation, and quantum / accelerated computing. By geography, the market is segmented into North America, Europe, Asia-Pacific, the Middle East and Africa, and South America. The report also covers the estimated market sizes and trends for 17 countries across major regions globally. The report offers values (USD) for all the above segments.
| Software / AI platforms |
| Services |
| Target Identification and Validation |
| Lead Discovery |
| Lead Optimization |
| Pre-clinical ADME/Tox Prediction |
| Others |
| Pharmaceutical and Biotechnology Companies |
| Contract Research Organizations (CROs) |
| Academic and Research Institutes |
| Structure-Based Drug Design (SBDD) |
| Ligand-Based Drug Design (LBDD) |
| AI / Generative-AI Platforms |
| Molecular Dynamics and Simulation |
| Quantum / Accelerated Computing |
| North America | United States |
| Canada | |
| Mexico | |
| Europe | Germany |
| United Kingdom | |
| France | |
| Italy | |
| Spain | |
| Rest of Europe | |
| Asia-Pacific | China |
| Japan | |
| India | |
| Australia | |
| South Korea | |
| Rest of Asia-Pacific | |
| Middle East and Africa | GCC |
| South Africa | |
| Rest of Middle East and Africa | |
| South America | Brazil |
| Argentina | |
| Rest of South America |
| By Component | Software / AI platforms | |
| Services | ||
| By Workflow | Target Identification and Validation | |
| Lead Discovery | ||
| Lead Optimization | ||
| Pre-clinical ADME/Tox Prediction | ||
| Others | ||
| By End-user | Pharmaceutical and Biotechnology Companies | |
| Contract Research Organizations (CROs) | ||
| Academic and Research Institutes | ||
| By Technology | Structure-Based Drug Design (SBDD) | |
| Ligand-Based Drug Design (LBDD) | ||
| AI / Generative-AI Platforms | ||
| Molecular Dynamics and Simulation | ||
| Quantum / Accelerated Computing | ||
| By Geography | North America | United States |
| Canada | ||
| Mexico | ||
| Europe | Germany | |
| United Kingdom | ||
| France | ||
| Italy | ||
| Spain | ||
| Rest of Europe | ||
| Asia-Pacific | China | |
| Japan | ||
| India | ||
| Australia | ||
| South Korea | ||
| Rest of Asia-Pacific | ||
| Middle East and Africa | GCC | |
| South Africa | ||
| Rest of Middle East and Africa | ||
| South America | Brazil | |
| Argentina | ||
| Rest of South America | ||


Key Questions Answered in the Report
How large is the computational drug discovery market in 2026?
The computational drug discovery market size is USD 3.15 billion in 2026, with Mordor Intelligence forecasting a rise to USD 6.47 billion by 2031.
What CAGR is expected for computational AI platforms?
Software/AI platforms are projected to grow at a 17.24% CAGR over 2026-31, faster than any other component segment, according to Mordor Intelligence.
Which region shows the highest growth momentum?
Asia-Pacific is forecast to post a 17.34% CAGR to 2031, fueled by China, India, and Japan’s investment in sovereign AI capabilities.
What workflow will expand fastest through 2031?
Lead discovery, propelled by ultra-large virtual screening, is projected to expand at 16.82% CAGR, outpacing target identification.
Page last updated on:


