
Commercial Auto Insurance Market Size and Share
Market Overview
| Study Period | 2020 - 2031 |
|---|---|
| Market Size (2026) | USD 302.17 Billion |
| Market Size (2031) | USD 413.80 Billion |
| Growth Rate (2026 - 2031) | 6.49 % |
| Fastest Growing Market | Asia-Pacific |
| Largest Market | North America |
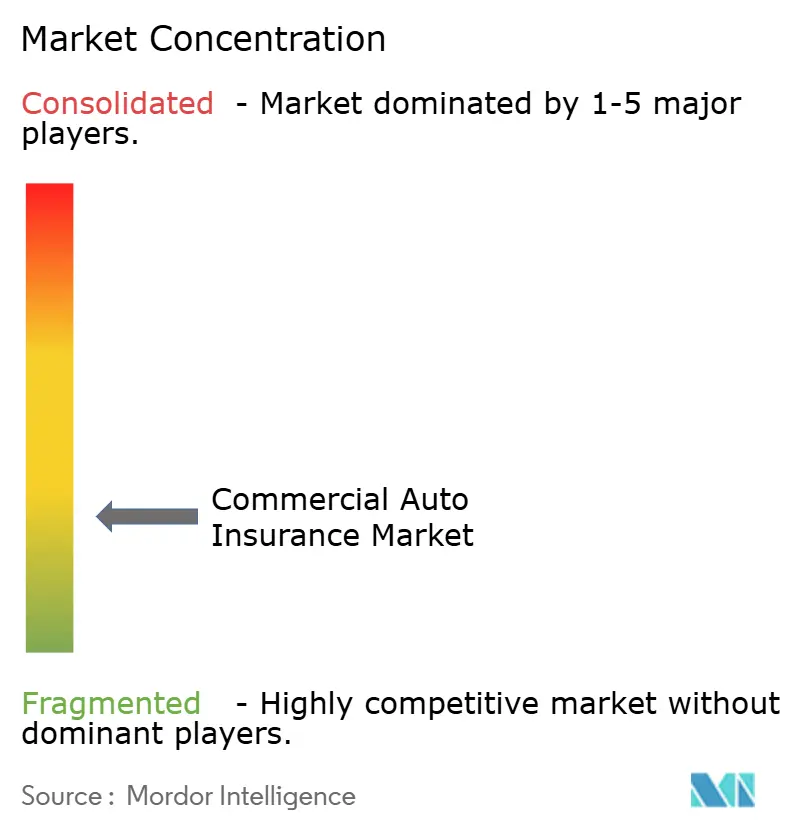
| Market Concentration | Low |
Major Players *Disclaimer: Major Players sorted in no particular order Image © Mordor Intelligence. Reuse requires attribution under CC BY 4.0. | |
Commercial Auto Insurance Market Analysis by Mordor Intelligence
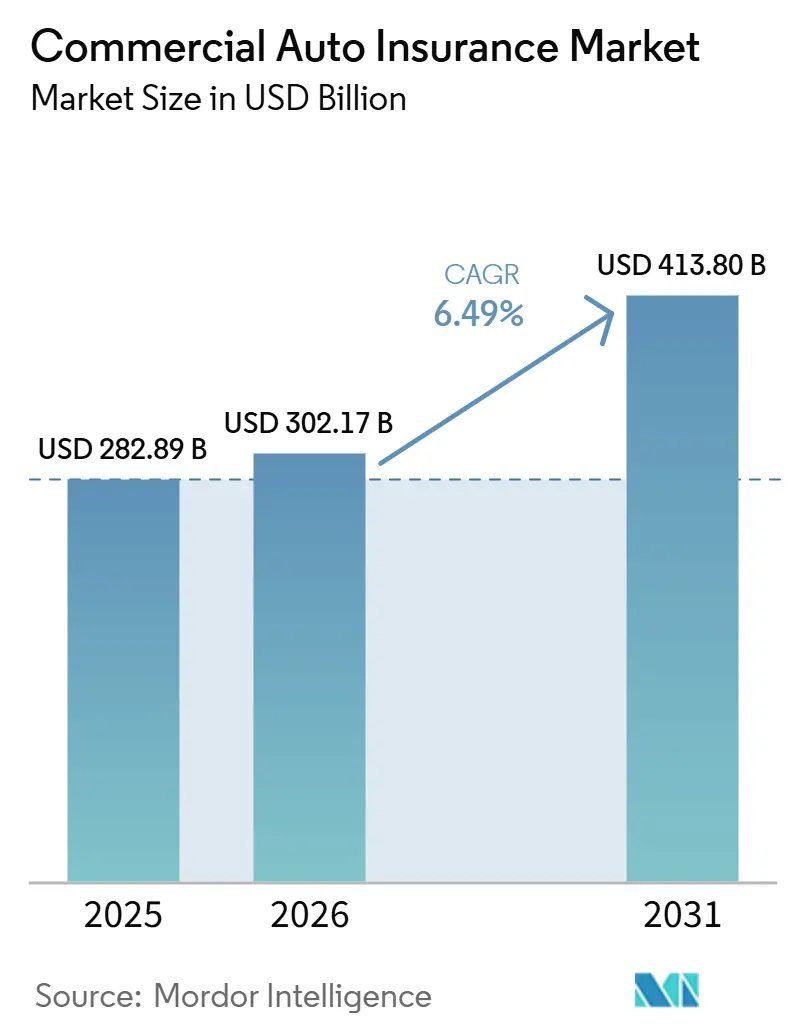
The Commercial Auto Insurance Market size is projected to be USD 282.89 billion in 2025, USD 302.17 billion in 2026, and reach USD 413.80 billion by 2031, growing at a CAGR of 6.49% from 2026 to 2031.
The commercial auto insurance market is supported by freight movement, fleet replacement, and mandatory liability rules that keep policy demand active across most operating environments. The commercial auto insurance market is also being shaped by growth in last-mile delivery, as more vans and service vehicles, along with higher route density, increase the number of insurable units in daily use. Telematics adoption is changing how the commercial auto insurance market is priced, as carriers can now separate monitored from unmonitored fleets with greater precision and link coverage terms more closely to observed driving behavior. The commercial auto insurance market also has room to expand in underinsured fleet corridors across South and Southeast Asia, where formal commercial vehicle coverage still lags that of developed markets, creating a longer runway for carrier expansion. Fleet electrification adds another layer to this growth path because EV repair complexity, battery exposure, and charging liability are increasing premium intensity per vehicle, even when underwriting conditions remain difficult.
Key Report Takeaways
- By vehicle type, light commercial vehicles captured 44.9% of the commercial auto insurance market share in 2025 and are projected to grow at 7.4% CAGR through 2031.
- By coverage type, third-party liability accounted for 52.1% of the commercial auto insurance market share in 2025, while supplementary and optional covers are projected to grow at 8.6% CAGR through 2031.
- By distribution channel, agents and brokers held 58.6% of the commercial auto insurance market share in 2025, while digital, embedded, and affinity channels are projected to grow at 12.2% CAGR through 2031.
- By end-use industry, logistics and transportation captured a 41.2% of the commercial auto insurance market share in 2025 and are projected to grow at a 7.8% CAGR through 2031.
- By geography, North America held 39.3% of the commercial auto insurance market share in 2025, while the Asia-Pacific is projected to grow at 8.1% CAGR through 2031.
Note: Market size and forecast figures in this report are generated using Mordor Intelligence’s proprietary estimation framework, updated with the latest available data and insights as of January 2026.
Market Trends and Insights
Drivers Impact Analysis of Commercial Auto Insurance Market*
| Driver | (~) % Impact on CAGR Forecast | Geographic Relevance | Impact Timeline |
|---|---|---|---|
| E-Commerce And Last-Mile Fleet Expansion | +1.5% | Global, concentrated in North America, Asia-Pacific, and Western Europe | Short term (≤ 2 years) |
| Telematics-Enabled Risk-Based Pricing Adoption | +1.2% | North America and Europe core, with spillover to Asia-Pacific and Middle East, and Africa | Medium term (2-4 years) |
| Mandatory Liability Compliance Across Fleets | +0.8% | Global, with early gains in India, Southeast Asia, the Middle East, and Africa | Medium term (2-4 years) |
| Electrified Commercial Fleet Coverage Expansion | +0.6% | Asia-Pacific core, especially China and India, with spillover to Europe | Long term (≥ 4 years) |
| Embedded Insurance In OEM And Leasing Ecosystems | +0.5% | North America and Europe | Medium term (2-4 years) |
| Claims Automation And AI-Enabled Underwriting | +0.4% | Global | Long term (≥ 4 years) |
| Source: Mordor Intelligence | |||
E-Commerce and Last-Mile Fleet Expansion
The commercial auto insurance market continues to benefit from e-commerce fulfillment growth, as parcel networks, service partners, and regional delivery operators continue to add van capacity to meet tighter delivery windows. This pattern matters most in light commercial fleets, where daily route density, repeated stop cycles, and urban traffic exposure create a larger insured base and more frequent policy activity. The same operating shift is widening the mix of insured entities, as retailers now rely on private fleets, regional carriers, and platform-linked delivery models rather than a single uniform transport structure. That change supports premium growth in the commercial auto insurance market even when the fleet mix becomes more complex and loss outcomes differ across operators. Carriers that separate urban delivery exposure from broader regional freight exposure are better placed to price this business accurately and protect margins as last-mile activity grows across major trade corridors.
Telematics-Enabled Risk-Based Pricing Adoption
The commercial auto insurance market is moving further toward usage-based and behavior-based underwriting, with telematics now becoming part of core pricing rather than an optional add-on. Fleets that share operating data give insurers a clearer view of braking, speeding, route selection, camera footage, and driver consistency, which supports tighter risk selection and faster claim handling. Louisiana set an early regulatory marker in January 2026 by requiring insurers to actuarially justify dashcam discount programs for equipped fleets, showing that telematics oversight is now reaching formal rate structures[1]. The commercial auto insurance market is likely to reward carriers that can accept data from multiple ELD and camera systems, because that makes adoption easier for fleets that do not want to install proprietary hardware. This shift also supports the growth of connected insurance programs, where telematics data can improve underwriting quality while giving safer operators a clearer path to lower premiums.
Mandatory Liability Compliance Across Fleets
The commercial auto insurance market has a built-in demand floor because fleets in most jurisdictions cannot legally operate without meeting minimum liability requirements. That matters even more in faster-growing markets where enforcement is becoming stricter and informal operators are moving into formal coverage structures. The practical effect is a broader insured base, because more vehicle owners and fleet managers must carry recognized documentation before they can move cargo, people, or service crews. This compliance trend also softens the effect of cyclical weakness, since policy demand is tied not only to freight activity but also to regulatory eligibility for road use. The commercial auto insurance market, therefore, continues to expand in areas where insurance penetration had been low, particularly when regulators link operational compliance with stronger documentation, fleet reporting, and pricing flexibility.
Electrified Commercial Fleet Coverage Expansion
The commercial auto insurance market is gaining a new premium layer from fleet electrification, as electric commercial vehicles introduce battery risk, charging exposure, and specialized repair requirements beyond traditional liability and damage coverage. Battery-electric commercial trucks currently carry annual insurance premiums that are 30% to 50% higher than those of diesel equivalents, thereby increasing premium intensity per insured vehicle. China recorded 871,000 new-energy commercial vehicle sales in 2025, up 63.7% year on year, and short-haul urban delivery penetration surpassed 50%, providing the commercial auto insurance market with a larger EV fleet base to insure. Insurers, including PICC, Ping An, and CPIC, launched dedicated EV commercial auto products in Q1 2026, showing that carriers are no longer treating electrified fleets as a side category. In Europe, fleet EV claims remain more expensive to repair than ICE vehicles, suggesting that pricing pressure will remain elevated even as actuarial familiarity improves and policy forms mature[2].
Restraints Impact Analysis of Commercial Auto Insurance Market*
| Restraint | (~) % Impact on CAGR Forecast | Geographic Relevance | Impact Timeline |
|---|---|---|---|
| Social Inflation And Nuclear Verdict Severity | -1.5% | North America, primarily the United States, with emerging pressure in the United Kingdom and Australia | Medium term (2-4 years) |
| Legacy Loss Ratios Reducing Underwriting Capacity | -0.9% | Global, with the most severe effect in North America | Medium term (2-4 years) |
| Telemetry Privacy Resistance Among Fleet Operators | -0.4% | Europe, especially GDPR-sensitive markets, and North America | Short term (≤ 2 years) |
| Multi-Jurisdiction Compliance Complexity | -0.3% | Global, particularly Middle East and Africa and South America | Long term (≥ 4 years) |
| Source: Mordor Intelligence | |||
Social Inflation and Nuclear Verdict Severity
The commercial auto insurance market remains under pressure from large liability awards, which continue to raise claim severity and make loss trends harder to stabilize. In 2024, 135 corporate defendant cases produced nuclear verdicts, up 52% from 2023, and the total verdict value reached USD 31.3 billion, up 116% year on year[3]. The Insurance Information Institute and the Casualty Actuarial Society estimated that legal system abuse added USD 52.0 billion to USD 70.8 billion to commercial auto liability losses across 2015 to 2024, underscoring how litigation conditions are affecting carrier results. Third-party litigation funding in the United States exceeded an estimated USD 15 billion by 2025, making the pursuit of very large awards more financially viable and persistent. As a result, the commercial auto insurance market places more weight on jurisdictional selection, claim response discipline, and early settlement capability than broad premium scale alone.
Legacy Loss Ratios Reducing Underwriting Capacity
The commercial auto insurance market is also constrained by prior loss development, which continues to absorb capital and reduce the amount of capacity carriers are willing to commit to harder risks. Commercial auto posted a USD 4.9 billion underwriting loss in 2024, marking the 14th consecutive annual deficit for the line, and liability coverage alone lost USD 6.4 billion, resulting in a combined ratio of 107.2. AM Best estimated that the segment remained under-reserved by USD 4 billion to USD 5 billion, which explains why carriers continue to tighten underwriting on mid-size and loss-exposed fleet accounts. S&P Global projected a combined ratio of 104.4 in 2026 and 106.3 by 2029, indicating that premium growth in the commercial auto insurance market will not automatically translate into stronger profitability. This pressure is pushing some businesses into surplus lines and specialty channels, especially in high-verdict states where admitted market appetite is narrowing and coverage terms are becoming more selective.
*Our forecasts treat driver/restraint impacts as directional, not additive. The impact forecasts reflect baseline growth, mix effects, and variable interactions.
Commercial Auto Insurance Market Segment Analysis
By Vehicle Type:
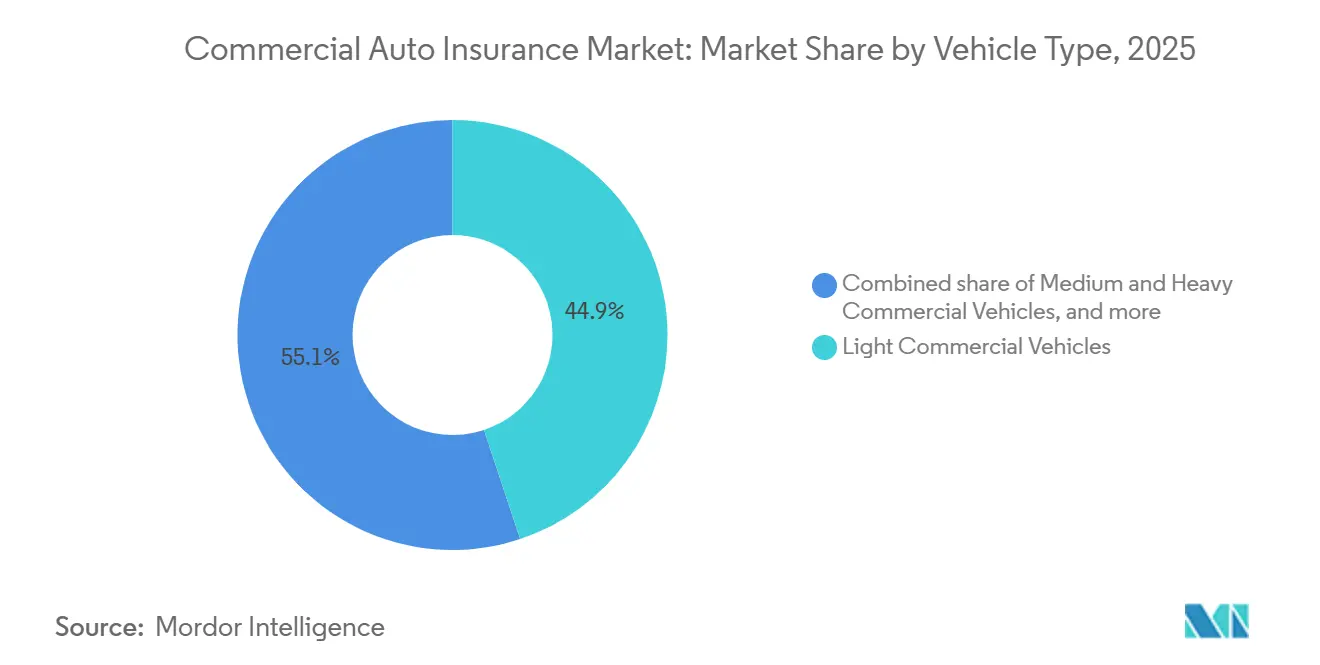
LCV Demand Powers Structural Premium GrowthLight commercial vehicles held 44.9% of global premiums in 2025, making them the largest vehicle category in the commercial auto insurance market. Light commercial vehicles are also the fastest-growing sub-segment, with the commercial auto insurance market size for this category projected to expand at 7.4% CAGR through 2031. Their lead comes from van-fleet growth in parcel delivery, field services, local trade, and other urban operating models that require frequent trips and dense route patterns. Within the commercial auto insurance industry, this segment matters because it combines high unit counts with a wide spread of operator profiles, from organized fleets to smaller owner-led businesses. The result is a premium base that continues to widen even when underwriting results differ sharply between monitored and unmonitored fleets.
The commercial auto insurance market for medium- and heavy-duty commercial vehicles remains important because those vehicles carry greater liability exposure and a higher potential for severe losses on long-haul routes. Trucking-related nuclear verdicts reached USD 4.1 billion in 2024, which shows why per-unit premium weight remains high even when total unit volume is lower than in LCV fleets. Specialized and niche commercial vehicles still represent a smaller share of the commercial auto insurance market. Yet, they often carry higher premiums because cargo sensitivity, emergency response use, and coverage comparability are more limited. A clear split is emerging inside the LCV segment, where monitored fleets with telematics and driver coaching can qualify for premium reductions of 15% to 30% relative to unmonitored peers[4]. That split is turning one broad segment into a two-tier pricing environment, where operating behavior now matters almost as much as vehicle class.
By Coverage Type:
Supplementary Covers Outpace Mature Liability LinesThird-party liability retained 52.1% of premiums in 2025, maintaining its position as the largest coverage pool in the commercial auto insurance market. Its scale reflects mandatory purchase rules across most commercial fleet jurisdictions, which makes liability coverage the core policy layer for nearly every insured operator. In the commercial auto insurance industry, this segment also serves as the base from which other covers are added, priced, or tailored based on fleet behavior and operating geography. Own damage remains the second-largest pool, driven by repair cost inflation and higher parts complexity, especially as EV penetration rises. Repair cost inflation in major European markets reached 5.3% in 2025, reinforcing rate pressure across physical damage portfolios.
Supplementary and optional covers are projected to expand at 8.6% CAGR through 2031, making them the fastest-growing coverage category in the commercial auto insurance market. This group includes telematics-linked riders, cargo cover, cyber extensions, and EV battery protection, which are gaining relevance as fleet operations become more data-dependent and technically complex. The connected insurance telematics platform market reached USD 3.8 billion in 2024, which supports the broader movement toward add-on covers tied to real-time operating data and embedded policy design. A meaningful profitability split is also evident across coverage types: physical damage generated USD 1.5 billion in underwriting profit in 2024, while liability produced record deficits in the United States. That makes coverage mix management a more active lever in the commercial auto insurance market, particularly for carriers seeking growth without taking the same degree of severity exposure across every policy layer.
By Distribution Channel:
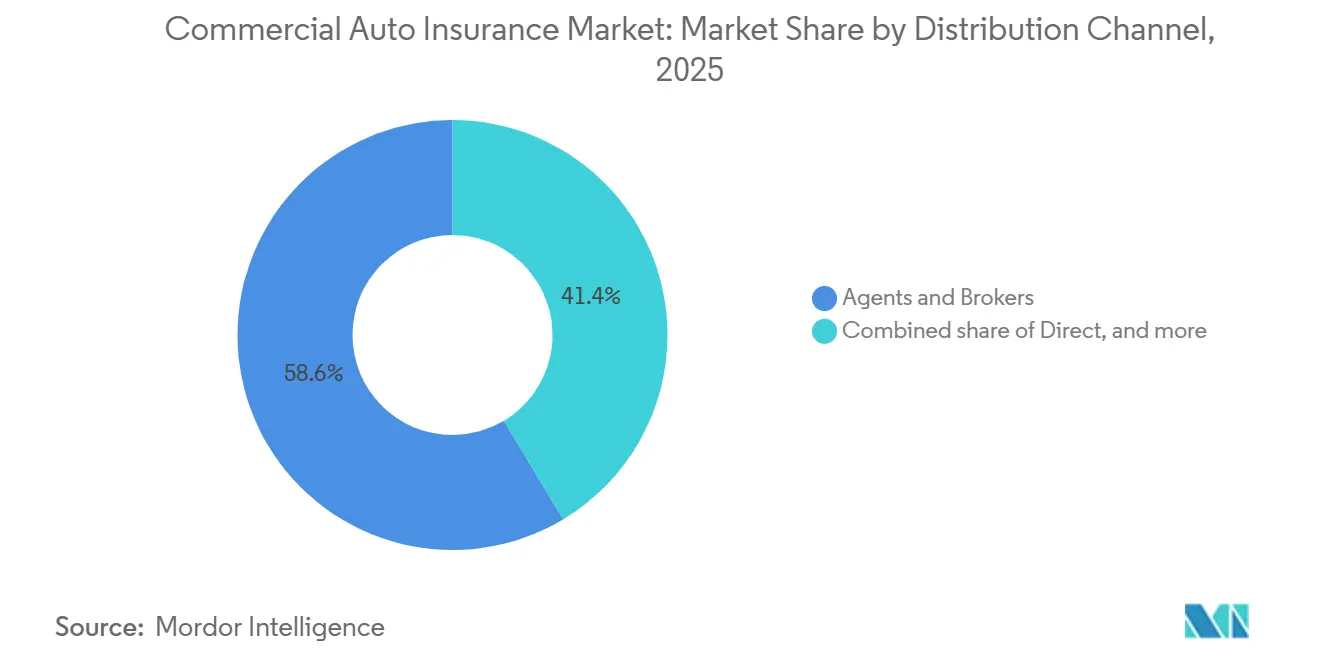
Digital Channels Disrupt an Agent-Dominated MarketAgents and brokers accounted for 58.6% of distribution in 2025, making them the largest route to market in the commercial auto insurance market. Their lead reflects the complexity of fleet placements, the need for advisory support, and the frequent use of tailored policy structures for larger accounts. In the commercial auto insurance industry, intermediaries still play a central role when fleet buyers need layered cover, negotiated terms, or support across multiple jurisdictions. The direct channel remains relevant for small operators that want speed, price clarity, and simpler quoting without extended placement work. This means traditional channels are still deeply embedded, even as digital models are becoming more capable and more visible in smaller fleet categories.
Digital, embedded, and affinity channels are projected to grow at a 12.2% CAGR through 2031, the fastest expansion rate across all segmentation dimensions in the commercial auto insurance market. The commercial auto insurance market for digital, embedded, and affinity channels is growing as small businesses increasingly buy coverage within the software, payment, OEM, and telematics environments they already use. Buddy launched bindable commercial coverage in Stripe's App Marketplace in June 2026, demonstrating that non-insurance operating systems can now serve as credible distribution channels for commercial buyers. OEM-linked connected insurance programs from Daimler Truck Financial Services and GEICO also support this shift, because factory telematics can feed underwriting without additional hardware and simplify adoption for owner-operators. The long-term effect is not the disappearance of brokers, but a sharper split in which simple and small-fleet business moves faster through embedded channels, while complex accounts remain relationship-led.
By End-Use Industry:
Logistics Consolidates Its Lead While Adjacent Verticals MatureLogistics and transportation accounted for 41.2% of premiums in 2025, giving the segment the largest position in the commercial auto insurance market. Logistics and transportation also form the fastest-growing end-use segment, and the commercial auto insurance market size for this vertical is projected to expand at 7.8% CAGR through 2031. This dual lead reflects the direct connection between freight activity and insured fleet growth, because every added delivery van, truck, or route vehicle brings new premium potential. The segment also carries the most visible liability pressure, since trucking produced USD 4.1 billion in nuclear verdicts in 2024 and has become the clearest test of underwriting discipline. As a result, the commercial auto insurance market grows most visibly in logistics, yet profitable participation still depends on route mix, telematics use, and claims control.
Construction and infrastructure remain the second-largest end-use grouping in the commercial auto insurance market, supported by ongoing project activity and vehicle replacement tied to public works and utility upgrades. Public and passenger transport have different risk profiles, because bodily injury exposure can rise quickly when buses, school vehicles, or transit fleets are involved in multi-passenger incidents. Other verticals, such as agriculture, utilities, and service trades, add steadier premium demand to the commercial auto insurance market through routine compliance and business fleet formalization. Specialized EV adoption is also beginning to affect non-logistics fleets, especially in utility vans and compact work vehicles, where claim experience is still developing, and repair networks remain uneven. This leaves adjacent verticals with slower but durable growth, while logistics remains the main source of net new insured vehicle activity across the forecast period.
Geography Analysis
North America Commercial Auto Insurance Market
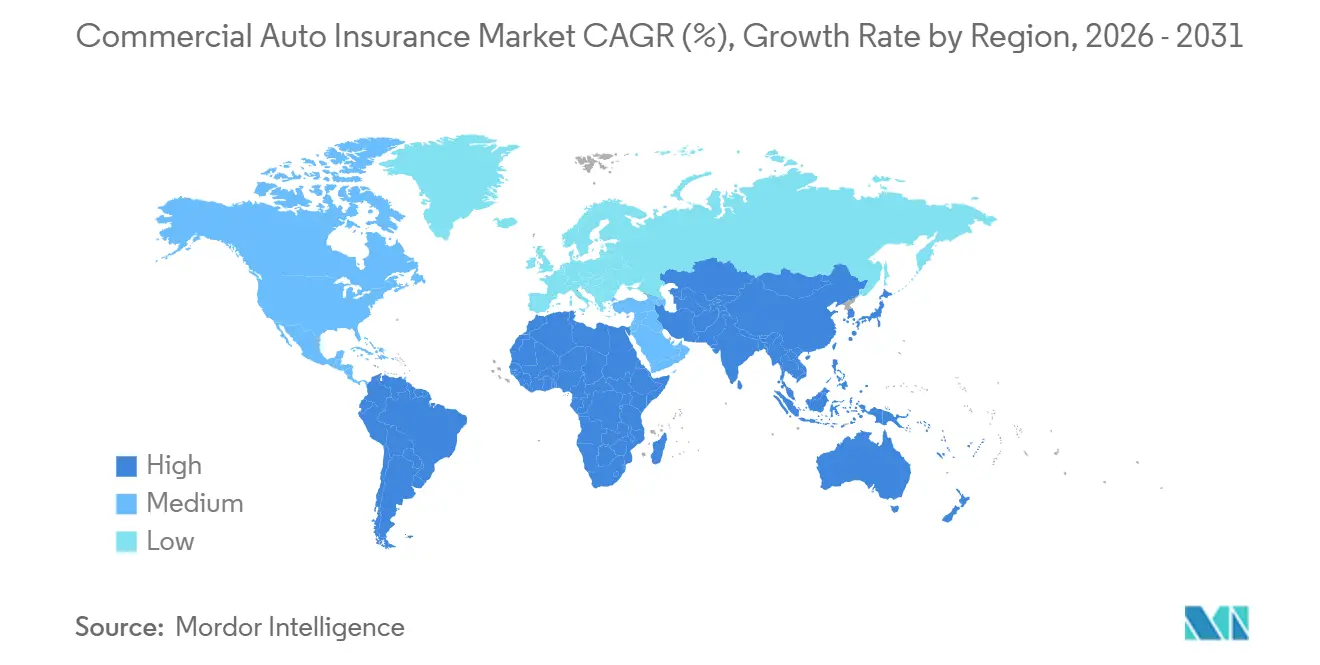
North America held 39.3% of the commercial auto insurance market share in 2025, which made it the largest regional contributor. The region is anchored by the United States, where direct premiums written reached USD 72.2 billion in 2024, underscoring that carrier exposure remains heavily concentrated in one large, technically demanding market. The same market also reported a 107.2 combined ratio in 2024, which explains why underwriting appetite is tightening in higher-risk states and why some business is moving toward surplus lines channels. Canada sees steadier freight-linked demand, while Mexico sees more commercial vehicle insurance activity as nearshoring supports manufacturing and logistics build-out in northern corridors. Across North America, the commercial auto insurance market keeps a firm demand floor because fleets still need documented compliance before they can operate across regulated transport networks.
EMEA Commercial Auto Insurance Market
Europe remains the second-largest regional market for commercial auto insurance, supported by the United Kingdom, Germany, France, and Italy. French fleet insurance premiums grew 4.5% to 5.5% in 2026, with repair cost inflation and EV claims complexity continuing to support upward pricing pressure. The United Kingdom stands out as an innovation center in the commercial auto insurance market, where connected haulage products are being introduced with telematics-led underwriting and early reductions in claim frequency among participating fleets. Southern European markets are also seeing increased demand for supplementary cover as e-commerce logistics expands, especially in urban fleets operating under dense conditions and with higher repair complexity. The Middle East and Africa remain smaller in share. Still, Saudi Arabia and the UAE are playing a larger role as logistics investments and infrastructure programs expand the need for insured commercial mobility.
APAC and South America Commercial Auto Insurance Market
Asia-Pacific is projected to grow at a 8.1% CAGR through 2031, making it the fastest-growing region in the commercial auto insurance market. China is a major driver of that pace, because 871,000 new-energy commercial vehicle sales in 2025 and 63.7% annual growth have already created a much larger EV fleet requiring dedicated product design and pricing. PICC, Ping An, and CPIC introduced dedicated EV commercial auto insurance products with telematics-based pricing in Q1 2026, which shows how the commercial auto insurance market is adapting to electrified fleet risk in real time. India and Southeast Asia add another layer of growth, as formal insurance requirements expand into markets that historically had lower fleet coverage penetration. South America remains smaller by comparison, with Brazil as the main regional anchor. At the same time, enforcement of mandatory insurance and continued investment in logistics support gradual premium expansion across commercial fleet operators.
Competitive Landscape
The commercial auto insurance market is fragmented, with leading global insurers competing alongside numerous regional carriers and specialist fleet insurers. Progressive, Travelers, Liberty Mutual, The Hartford, and Chubb are prominent players in North America, while Allianz, AXA, Zurich Insurance Group, and Tokio Marine maintain strong positions across Europe and Asia-Pacific. Competition extends beyond scale, as underwriting performance varies significantly depending on fleet composition, litigation exposure, telematics adoption, and loss control practices. A 42-point combined ratio spread among the top 20 United States commercial auto writers in 2024 showed that execution quality still matters more than broad presence in this line. That operating reality keeps the commercial auto insurance market competitive even when the leading global names remain well established.
Strategic expansion is continuing through partnerships, embedded distribution, and selective acquisitions across the commercial auto insurance market. Liberty Mutual increased its stake in Liberty General Insurance in India to 74% in May 2026, strengthening its position in a market where formalization and growth in commercial vehicles are supporting a broader insured base. Chubb completed the acquisition of Liberty Mutual's businesses in Thailand and Vietnam in early 2025, strengthening its regional platform in Southeast Asia, where insurance penetration remains below mature-market levels. Roadzen secured a letter of intent for USD 30 million in annual commercial auto underwriting capacity in April 2026, scalable to USD 50 million over 3 years, which shows that AI-led platforms are moving beyond software into managed distribution and underwriting structures. These moves show that the commercial auto insurance market is being contested not only by incumbent insurers, but also by firms that control data, placement workflows, and access to fleet operating ecosystems.
InsurTech challengers such as HDVI, Nirvana, Cover Whale, and Roadzen are gaining attention in the commercial auto insurance market by using telematics-linked underwriting and faster quote-to-bind processes. Their appeal is strongest where fleets want real-time risk feedback, flexible pricing, and a clearer connection between behavior data and premium outcome. OEM-aligned financial services arms are also becoming more visible in the commercial auto insurance market, especially where they can combine asset finance, telematics, and physical damage coverage within a single customer relationship. Volvo Financial Services launched its Rolling Asset Program in February 2026 with fixed, multi-year physical damage rates across mixed truck fleets, providing operators with greater cost certainty and demonstrating how manufacturers can defend customer relationships after the vehicle sale. This leaves the commercial auto insurance market open to several competitive models at once, with large incumbents, data-led specialists, and ecosystem players all trying to secure control of distribution, pricing quality, and retention.
Commercial Auto Insurance Industry Leaders
-
The Travelers Companies, Inc.
-
Liberty Mutual Insurance Company
-
The Hartford Financial Services Group, Inc.
-
Chubb Limited
-
The Progressive Corporation
- *Disclaimer: Major Players sorted in no particular order
Commercial Auto Insurance Market Companies Covered in this Report
- The Progressive Corporation
- The Travelers Companies, Inc.
- Liberty Mutual Insurance Company
- The Hartford Financial Services Group, Inc.
- Chubb Limited
- Berkshire Hathaway Inc.
- Zurich Insurance Group Ltd
- Old Republic International Corporation
- Allianz SE
- AXA SA
- American International Group, Inc.
- Nationwide Mutual Insurance Company
- Fairfax Financial Holdings Limited
- Tokio Marine Holdings, Inc.
- Sompo Holdings, Inc.
- MS&AD Insurance Group Holdings, Inc.
- Aviva plc
- MAPFRE S.A.
- QBE Insurance Group Limited
- State Farm Mutual Automobile Insurance Company
Recent Industry Developments in Commercial Auto Insurance Market
- June 2026: Buddy launched a distribution partnership within Stripe's App Marketplace, enabling commercial insurance carriers and MGAs with binding authority to distribute GL, cyber, workers' compensation, and commercial auto products directly to businesses transacting on Stripe, creating a new embedded distribution channel that bypasses traditional broker networks for small commercial fleet operators.
- April 2026: Roadzen Inc. secured a letter of intent for USD 30 million in annual commercial auto underwriting capacity from a leading United States carrier in Year 1, scaling to USD 50 million over three years, reinforcing its strategy of AI-integrated distribution, underwriting, and program management for commercial auto.
- March 2026: GEICO returned to the Mid-America Trucking Show, reporting that safe truckers sharing data through the DriveEasy Pro telematics program save an average of USD 4,453 annually on truck insurance premiums, with the Daimler Truck and Motive partnerships driving nationwide program expansion throughout 2026.
- February 2026: Volvo Financial Services launched its Rolling Asset Program, extending physical damage coverage with fixed multi-year rates to all makes and models in a customer's mixed truck fleet, providing cost predictability for fleet managers amid ongoing volatility in the commercial trucking insurance market.
Global Commercial Auto Insurance Market Report Scope
Segmentation Overview
| Light Commercial Vehicles |
| Medium and Heavy Commercial Vehicles |
| Specialized & Niche Commercial Vehicles |
| Third Party Liability Coverage |
| Own Damage |
| Supplementary & Optional Covers |
| Agents and Brokers |
| Direct |
| Digital, Embedded & Affinity Channels |
| Logistics & Transportation |
| Construction & Infrastructure |
| Public & Passenger Transport |
| Other Commercial Verticals |
| North America | United States |
| Canada | |
| Mexico | |
| South America | Brazil |
| Argentina | |
| Rest of South America | |
| Europe | United Kingdom |
| Germany | |
| France | |
| Italy | |
| Spain | |
| Rest of Europe | |
| Asia-Pacific | China |
| Japan | |
| India | |
| South Korea | |
| Australia | |
| Indonesia | |
| Thailand | |
| Malaysia | |
| Singapore | |
| Vietnam | |
| Rest of Asia-Pacific | |
| Middle East and Africa | Saudi Arabia |
| United Arab Emirates | |
| Turkey | |
| South Africa | |
| Egypt | |
| Rest of Middle East and Africa |
| By Vehicle Type | Light Commercial Vehicles | |
| Medium and Heavy Commercial Vehicles | ||
| Specialized & Niche Commercial Vehicles | ||
| By Coverage Type | Third Party Liability Coverage | |
| Own Damage | ||
| Supplementary & Optional Covers | ||
| By Distribution Channel | Agents and Brokers | |
| Direct | ||
| Digital, Embedded & Affinity Channels | ||
| By End-Use Industry | Logistics & Transportation | |
| Construction & Infrastructure | ||
| Public & Passenger Transport | ||
| Other Commercial Verticals | ||
| By Geography | North America | United States |
| Canada | ||
| Mexico | ||
| South America | Brazil | |
| Argentina | ||
| Rest of South America | ||
| Europe | United Kingdom | |
| Germany | ||
| France | ||
| Italy | ||
| Spain | ||
| Rest of Europe | ||
| Asia-Pacific | China | |
| Japan | ||
| India | ||
| South Korea | ||
| Australia | ||
| Indonesia | ||
| Thailand | ||
| Malaysia | ||
| Singapore | ||
| Vietnam | ||
| Rest of Asia-Pacific | ||
| Middle East and Africa | Saudi Arabia | |
| United Arab Emirates | ||
| Turkey | ||
| South Africa | ||
| Egypt | ||
| Rest of Middle East and Africa | ||
Key Questions Answered in the Report
What is the 2026 value of the commercial auto insurance market?
The commercial auto insurance market reaches USD 302.2 billion in 2026 and is forecast to reach USD 413.8 billion by 2031 at a 6.5% CAGR.
Which vehicle category leads premium generation?
Light commercial vehicles lead with 44.9% share in 2025 and also post the fastest vehicle-type growth at 7.4% CAGR through 2031.
Which coverage type is growing fastest?
Supplementary and optional covers are growing fastest at 8.6% CAGR through 2031, while third-party liability remains the largest coverage pool with 52.1% share in 2025.
Why are digital channels becoming more important for fleet insurance?
Digital, embedded, and affinity channels are projected to grow at 12.2% CAGR through 2031 because small fleets increasingly buy cover through connected software, OEM, and payment ecosystems.
Which region is expanding the fastest through 2031?
Asia-Pacific is the fastest-growing region with an 8.1% CAGR, supported by China’s EV commercial fleet expansion and wider formalization of fleet insurance across developing markets.
What is the biggest profitability challenge for carriers?
Social inflation and large liability verdicts remain the main pressure point, while legacy reserve strain and elevated combined ratios continue to limit underwriting capacity in higher-risk fleet segments.