Chronic Lymphocytic Leukemia Drugs Market Size and Share
Market Overview
| Study Period | 2020 - 2031 |
|---|---|
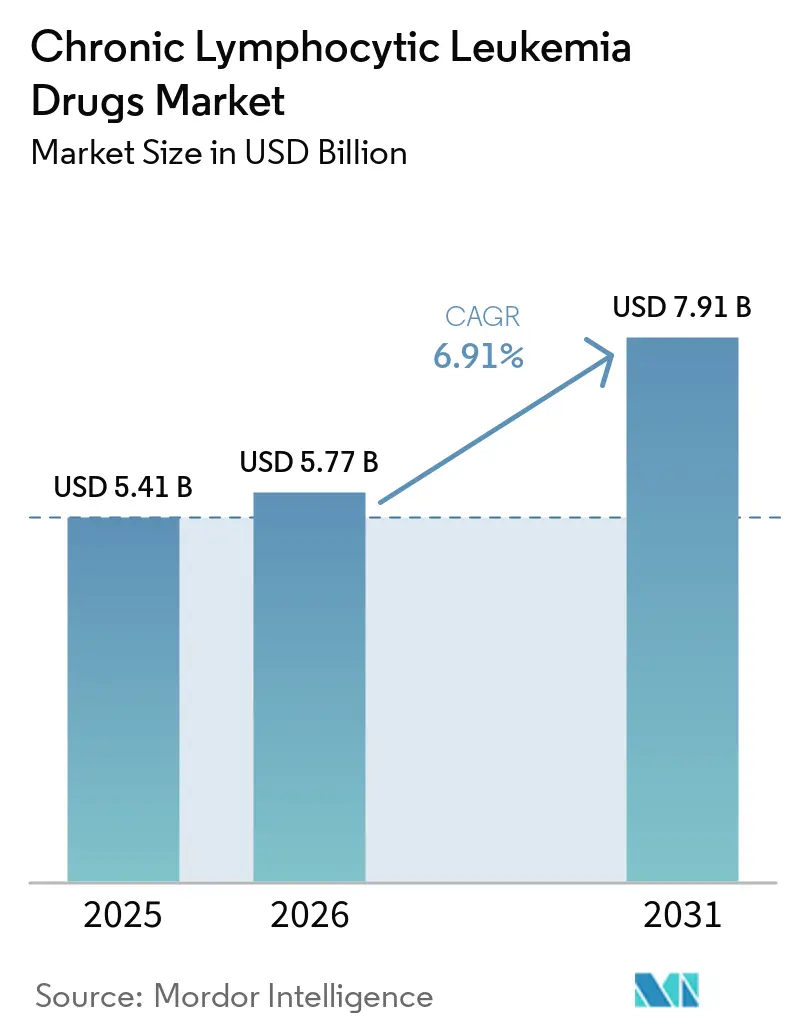
| Market Size (2026) | USD 5.77 Billion |
| Market Size (2031) | USD 7.91 Billion |
| Growth Rate (2026 - 2031) | 6.91% CAGR |
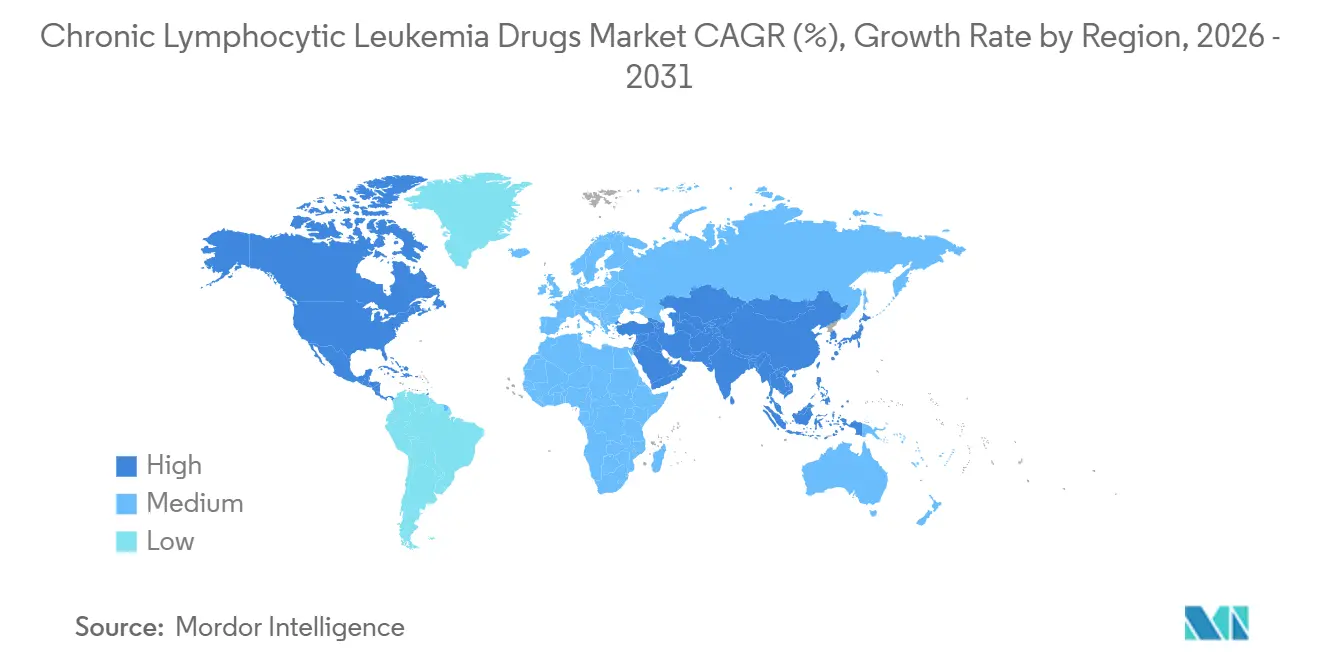
| Fastest Growing Market | Asia-Pacific |
| Largest Market | North America |
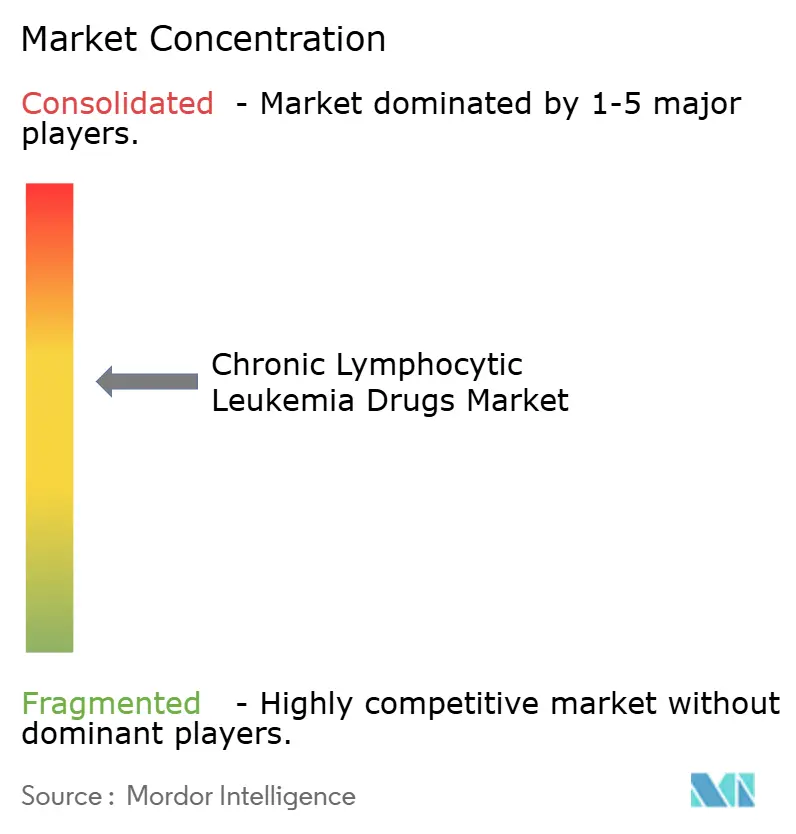
| Market Concentration | Medium |
Major Players *Disclaimer: Major Players sorted in no particular order Image © Mordor Intelligence. Reuse requires attribution under CC BY 4.0. | |
Chronic Lymphocytic Leukemia Drugs Market Analysis by Mordor Intelligence
The Chronic Lymphocytic Leukemia Drugs Market size is projected to be USD 5.41 billion in 2025, USD 5.77 billion in 2026, and reach USD 7.91 billion by 2031, growing at a CAGR of 6.91% from 2026 to 2031.
This steady expansion is fueled by the broad clinical shift from chemoimmunotherapy toward precision-targeted agents that deliver deeper responses with improved tolerability, thereby extending both survival and treatment-free intervals. The uptake of Bruton's tyrosine kinase (BTK) and B-cell lymphoma-2 (BCL-2) inhibitors has expanded rapidly, and the first CAR-T cell product for chronic lymphocytic leukemia signals a growing confidence in cellular approaches. Combination regimens capable of clearing minimal residual disease now achieve rates exceeding 90% undetectable, encouraging physicians to adopt time-limited courses that reduce cumulative toxicity and costs. Regional growth differentials remain wide, with North America continuing to command the largest revenue share, while the Asia-Pacific region is poised to post the fastest growth as approvals accelerate and diagnostic capacity increases.
Key Report Takeaways
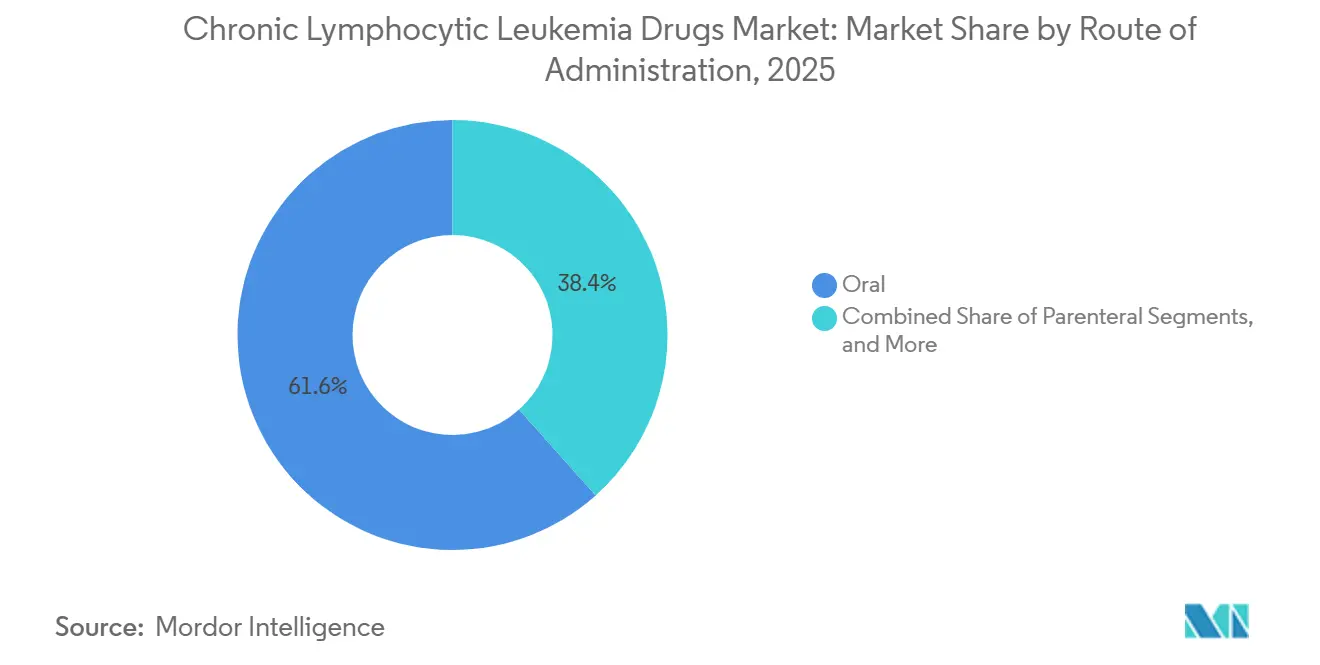
- By route of administration, oral formulations accounted for 61.65% of the chronic lymphocytic leukemia drugs market size in 2025 and are projected to expand at a 9.18% CAGR between 2026 and 2031.
- By therapy type, targeted therapy led with a 48.92% revenue share in 2025; CAR-T and cell therapy are forecasted to advance at a 10.44% CAGR to 2031.
- By drug class, BTK inhibitors captured 45.98% of the chronic lymphocytic leukemia drugs market share in 2025, whereas non-covalent BTK inhibitors are set to grow at an 8.11% CAGR through 2031.
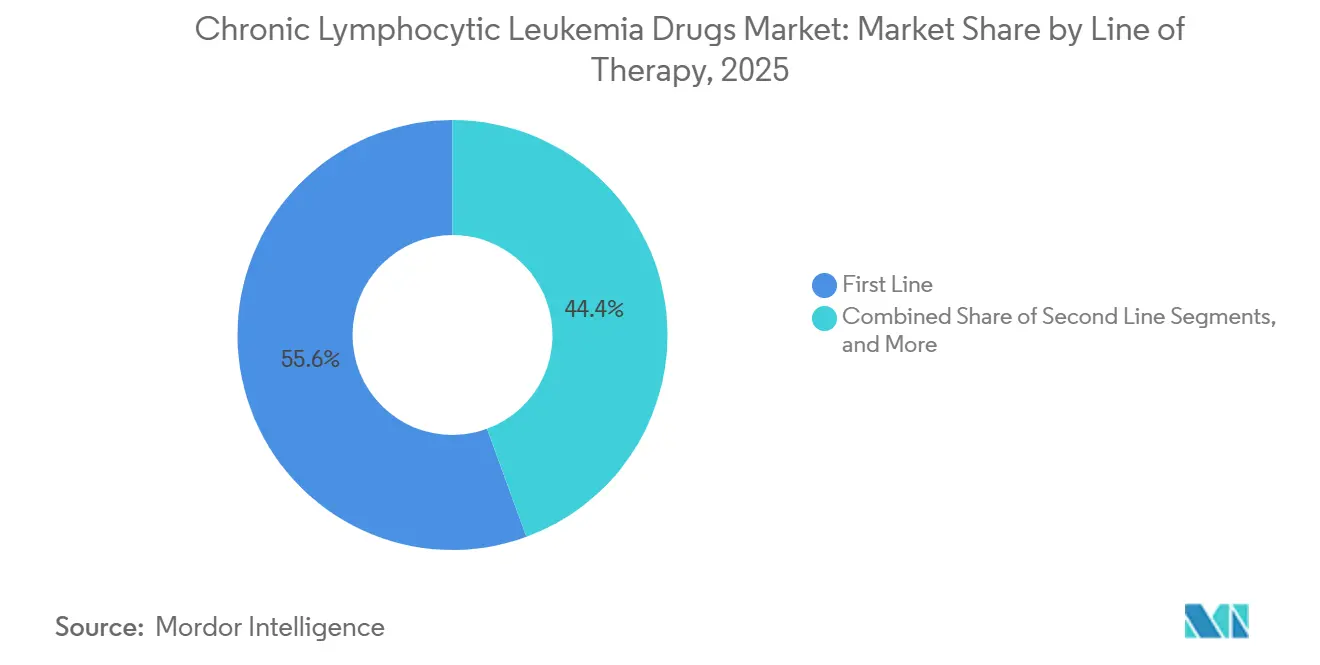
- By line of therapy, first-line treatment accounted for 55.62% of the revenue share in 2025, while the relapsed/refractory setting is expected to register the highest CAGR of 8.33% in the same horizon.
- By geography, North America accounted for 38.12% of the 2025 global revenue, and the Asia-Pacific region is projected to grow at a 9.05% CAGR.
Note: Market size and forecast figures in this report are generated using Mordor Intelligence’s proprietary estimation framework, updated with the latest available data and insights as of January 2026.
Global Chronic Lymphocytic Leukemia Drugs Market Trends and Insights
Drivers Impact Analysis*
| DRIVER | (~) % IMPACT ON CAGR FORECAST | GEOGRAPHIC RELEVANCE | IMPACT TIMELINE | |
|---|---|---|---|---|
| Rising global CLL prevalence and ageing population | 1.20% | North America and Europe highest | Long term (≥ 4 years) | |
| Expanding pipeline of next-gen BTK, BCL-2 and PI3K inhibitors | 1.80% | US and EU-5 early adoption | Medium term (2-4 years) | |
| Improved diagnostic accuracy via flow-cytometry and NGS | 0.90% | High-income markets, extending to Asia-Pacific | Medium term (2-4 years) | |
| Favourable reimbursement for oral targeted therapies | 1.10% | Primarily North America and Europe | Short term (≤ 2 years) | |
| Growing off-label use of MRD testing to shorten therapy | 0.70% | Academic centres worldwide | Medium term (2-4 years) | |
| Hospital-to-home shift enabling outpatient venetoclax ramp-up | 0.50% | Developed markets with robust infrastructure | Short term (≤ 2 years) | |
| Source: Mordor Intelligence | ||||
Rise in Global CLL Prevalence and Rapidly Ageing Population
Worldwide diagnoses continue to climb, with 23,690 new US cases expected in 2025. The median diagnosis age of 70 aligns the disease with aging societies, and survival exceeding 89% turns CLL into a chronic condition that requires decades of management. Asian nations, once showing lower incidence, now report faster growth as screening improves and demographic profiles tilt older. These epidemiologic patterns enlarge the chronic lymphocytic leukemia drugs market by widening the pool of patients eligible for targeted agents and combination regimens.[1]National Cancer Institute, “Chronic Lymphocytic Leukemia – Cancer Stat Facts,” seer.cancer.gov
Expanding Pipeline of Next-Gen BTK, BCL-2 and PI3K Inhibitors
Non-covalent BTK molecules, such as pirtobrutinib, post 81.6% responses in BTK-experienced patients, while next-generation BCL-2 assets, like sonrotoclax, post 97% responses when paired with zanubrutinib. BTK degraders, now under investigation, introduce a new removal mechanism rather than inhibition. Regulators accelerate these candidates through breakthrough and fast-track programs, compressing timelines and intensifying competition within the chronic lymphocytic leukemia drugs market.
Improved Diagnostic Accuracy Via Flow-Cytometry and NGS Panels
Multiparameter flow cytometry detects residual disease down to 0.001%, and comprehensive genomic sequencing identifies TP53 or IGHV aberrations that steer first-line choices. Artificial intelligence tools shorten analysis time while preserving accuracy, easing adoption outside academic centers. Standardized EuroFlow protocols harmonize measurements, giving regulators confidence in MRD-based end-points and allowing payers to support time-limited therapy.[2]Diseases, “High-Sensitivity Flow Cytometry for the Reliable Detection of Measurable Residual Disease,” mdpi.com
Favourable Reimbursement for Oral Targeted Therapies
In the United States, the Inflation Reduction Act sets a USD 2,000 annual out-of-pocket cap from 2025, directly improving the affordability of BTK and BCL-2 inhibitors. Across the EU-5, health technology bodies approve venetoclax-based fixed-duration regimens on the economic value of deep remissions and reduced monitoring needs. Real-world evidence shows lower total care costs for venetoclax-obinutuzumab versus continuous BTK therapy, a finding that shapes formulary priorities.
Restraints Impact Analysis*
| RESTRAINT | (~) % IMPACT ON CAGR FORECAST | GEOGRAPHIC RELEVANCE | IMPACT TIMELINE |
|---|---|---|---|
| High cost of patented novel agents and combinations | -1.40% | Global, strongest in emerging markets | Medium term (2-4 years) |
| Grade ≥ 3 adverse events driving early discontinuations | -0.80% | Global, notably older patients | Short term (≤ 2 years) |
| Emerging BTK-inhibitor resistance mutations eroding efficacy | -1.10% | Predominantly heavily pre-treated populations | Long term (≥ 4 years) |
| Supply-chain bottlenecks for specialised cytometry reagents | -0.60% | Low- and middle-income countries | Medium term (2-4 years) |
| Source: Mordor Intelligence | |||
High Cost of Patented Novel Agents and Combination Regimens
CAR-T therapy pricing near USD 1 million per patient challenges reimbursement in all but the wealthiest systems. Fixed-duration doublets can also strain budgets where generic substitutions are unavailable until late-decade patent cliffs. Negotiations over value-based contracts remain uneven, delaying access in price-sensitive regions and tempering part of the global growth curve.[3]Frontiers in Bioengineering and Biotechnology, “A Quest for Stakeholder Synchronization in the CAR T-Cell Therapy Supply Chain,” frontiersin.org
Grade ≥ 3 Adverse Events Driving Early Discontinuations
Real-world data cite median 12.4-month venetoclax use in first-line care, shorter than planned, mainly due to cytopenias or infectious complications. Cardiovascular toxicity under covalent BTK therapy leads to drug switches in older populations. Although next-generation agents show improved safety, variable experience at community sites leaves room for discontinuations that weigh on persistence and, by extension, on chronic lymphocytic leukemia drugs market performance.
*Our forecasts treat driver/restraint impacts as directional, not additive. The impact forecasts reflect baseline growth, mix effects, and variable interactions.
Segment Analysis
By Route of Administration: Oral Dominance Accelerates Market Penetration
Oral agents held 61.65% of the 2025 chronic lymphocytic leukemia drugs market share, reflecting patient preference for home dosing and payer interest in reduced facility bills. Broader Medicare Part D coverage and the 2025 copay cap reinforce utilisation in the United States, while Japan and Germany also report faster oral uptake post-approval of acalabrutinib and zanubrutinib. Oral BTK and BCL-2 inhibitors underpin this rise, and new once-daily or all-oral combinations further consolidate the trend. Parenteral regimens remain critical for CD20 antibodies, particularly during induction phases; however, their relative importance continues to decline. Looking ahead, subcutaneous CD20 products and oral PI3K candidates may further tilt usage. The chronic lymphocytic leukemia drugs market size for oral products is forecast to rise at a 9.18% CAGR through 2031, outpacing overall growth and cementing oral delivery as the primary platform for innovation.
Hospital administration keeps a foothold for inpatient venetoclax ramp-ups when tumor-lysis risk is high, but updated guidelines and telehealth tools now allow day-clinic or fully remote protocols. That flexibility attracts payers and frees capacity for complex cellular therapies, reinforcing the hospital-to-home migration trend. Oral agents thus improve adherence and widen access in rural areas, supporting the chronic lymphocytic leukemia drugs market’s geographic expansion. Manufacturers respond with patient-support programs and blister packaging that simplify dosing schedules, further enhancing uptake across diverse healthcare settings.


By Therapy Type: Targeted Approaches Reshape Treatment Paradigms
Targeted therapy dominated revenue, accounting for 48.92% in 2025, as BTK and BCL-2 inhibitors displaced conventional chemoimmunotherapy. Five-year data from the U.K. FLAIR study confirm superior progression-free survival for ibrutinib-venetoclax over FCR, accelerating global guideline revisions. Cellular therapy, despite a low base, is projected to expand at a 10.44% CAGR, buoyed by the first-in-class approval of lisocabtagene maraleucel for patients failing both BTK and BCL-2 inhibitors. This result creates a rescue pathway and positions CAR-T platforms for broader earlier-line evaluations, though manufacturing complexity and cost remain hurdles.
Immunotherapy with CD20 antibodies retains an anchoring role, especially obinutuzumab, whose synergy with venetoclax delivers fixed-duration regimens that achieve undetectable MRD rates above 90%. The relevance of chemotherapy narrows to select cytogenetic profiles or resource-limited settings. Combined with diagnostic advances, these developments continue to shift the chronic lymphocytic leukemia drugs market toward precision, outcome-driven care models, where depth of response and treatment-free interval carry greater weight than classical long-term maintenance paradigms.
By Drug Class: BTK Inhibitors Lead Despite Emerging Competition
BTK inhibitors retained 45.98% of the revenue in 2025, anchored by first-generation ibrutinib, with expanding shares for acalabrutinib and zanubrutinib. Non-covalent entrants target resistance mutations and are projected for an 8.11% CAGR, sustaining class growth as frontline positions mature. BCL-2 inhibition remains central, enabling time-limited doublets that challenge continuous BTK monotherapy in both fit and unfit cohorts. PI3K inhibitors are withdrawn due to safety concerns, though next-generation compounds with improved selectivity aim to reclaim their utility.
CD20 monoclonal antibodies remain vital partners, especially during induction, and continue to generate steady revenue. The “Others” category, including BTK degraders and bispecific antibodies, adds pipeline optionality that could rebalance class shares toward 2030. Throughout the horizon, pricing pressures and resistance biology will ultimately determine the eventual ranking, but BTK platforms currently anchor the chronic lymphocytic leukemia drugs market size for targeted drugs.
By Line of Therapy: Frontline Innovation Drives Market Growth
First-line care accounted for 55.62% of 2025 revenue, as guidelines encourage the use of potent, fixed-duration combinations early in the disease course. Deep remissions here lengthen treatment-free spans, which appeals to patients and payers and drives initial market capture for new entrants. In relapsed/refractory settings, however, the fastest 8.33% CAGR is recorded, as cellular therapy, degraders, and combination therapies extend options after double-class exposure. Second-line care remains a bridge segment, yet its share will gradually narrow if frontline regimens defer progression longer.
CAR-T adoption in the third line is likely to draw therapy-resistant patients into higher-value interventions, potentially raising per-patient spend despite smaller numbers. These sequencing realignments illustrate the chronic lymphocytic leukemia drugs market’s developing focus on depth, durability, and economic efficiency, anchored by MRD-guided decisions.
By Distribution Channel: Healthcare Infrastructure Shapes Access Patterns
Hospitals accounted for 61.54% of revenue in 2025, reflecting the complex infusion needs, adverse-event management, and multidisciplinary oversight required. Academic centres lead protocol innovation and host most CAR-T activity. Yet, online and retail pharmacy channels are projected to rise at a 9.67% CAGR as oral prescribing expands, and tele-oncology normalizes remote monitoring. Specialty clinics bridge the two models, providing infusion capacity and expert oversight in community settings.
Pharmacy benefit managers influence formulary tiering and often require step edits, which shape initial choices. Digital adherence platforms and courier partnerships facilitate mail order of chilled oral products, expanding reach into underserved regions. Together, these trends expand the chronic lymphocytic leukemia drugs market by stabilizing supply and alleviating patient burden while maintaining clinical oversight.
Geography Analysis
North America continues to control 38.12% of global revenue, underpinned by early FDA clearances, mature insurance coverage and dense networks of haematology centres. The 2025 USD 2,000 Medicare cap markedly improves affordability of oral agents, and multiple academic hubs such as MD Anderson lead pivotal trials that hasten real-world uptake. Canada follows similar practice patterns, supported by provincial reimbursement, while Mexico accelerates guideline harmonisation and procurement pathways.
Asia-Pacific is set to log the fastest 9.05% CAGR through 2031. Japan’s 2024 first-line acalabrutinib approval and China’s multi-indication green light for zanubrutinib supply large ageing populations with modern options. Chinese innovators expand BCL-2 and BTK pipelines and test competitive pricing that may reshape global benchmarks. Australia and South Korea rapidly reimburse fixed-duration venetoclax doublets, while India scales flow-cytometry capacity and explores local manufacture to temper cost.
Europe maintains steady advance through the EMA’s centralised pathway and joint clinical-assessment pilots that streamline payer reviews. Germany and the United Kingdom already implement MRD-guided stop rules, reinforcing time-limited regimens as economic winners. Biosimilars cut CD20 costs, enabling broader combination use. In the Middle East and Africa, diagnostic grants and multinational partnerships build testing labs, yet high list prices remain a hurdle. South America, led by Brazil and Argentina, improves access slowly through private insurance expansion and updated national formularies, but currency volatility tempers absolute growth.

Competitive Landscape
The market shows moderate concentration, led by AbbVie, BeiGene and Roche. AbbVie pairs ibrutinib and venetoclax to anchor both BTK and BCL-2 segments, giving it unmatched combination flexibility. BeiGene leverages improved safety data for zanubrutinib and pushes global filings, while Roche maintains influence through CD20 leadership and combination data. Bristol Myers Squibb’s CAR-T platform provides high-value differentiation despite manufacturing complexity.
Competition intensifies as Nurix advances BTK degraders and Ascentage or InnoCare develop novel BCL-2 backbones in China. Strategic alliances proliferate; AbbVie’s partnering approach secures pipeline breadth, and cross-licensing speeds global reach. Manufacturing know-how is pivotal for cell therapy; players able to scale vector production and automate cell processes gain an advantage. Overall, depth of remission, resistance management and ease of administration drive positioning within the chronic lymphocytic leukemia drugs market.
Chronic Lymphocytic Leukemia Drugs Industry Leaders
AbbVie Inc.
F. Hoffmann-La Roche Ltd
AstraZeneca Plc.
BeiGene
Gilead Sciences
- *Disclaimer: Major Players sorted in no particular order

Recent Industry Developments
- February 2026: FDA approved acalabrutinib with venetoclax as the first chemotherapy-free doublet for treatment-naïve CLL, with expectations to capture 40% of new starts by year-end.
- June 2025: Nurix Therapeutics announced plans to open global registration trials for BTK degrader NX-5948 after Phase 1a/1b data showed a 75.5% response rate in relapsed/refractory CLL; the program holds FDA Fast-Track and EMA PRIME designations.
- February 2025: InnoCare Pharma received approval to start a Phase III trial of BCL-2 inhibitor ICP-248 plus BTK inhibitor orelabrutinib as first-line therapy in China.


Global Chronic Lymphocytic Leukemia Drugs Market Report Scope
As per the scope of the report, chronic lymphocytic leukemia (CLL) drugs are targeted therapies, chemotherapy, and immunotherapies used to treat a slow-growing cancer of the blood and bone marrow. Key drugs include BTK inhibitors (ibrutinib), BCL-2 inhibitors (venetoclax), and anti-CD20 monoclonal antibodies (rituximab), which are used in combination to induce remission by specifically killing or blocking the growth of cancer cells.
The chronic lymphocytic leukemia drugs market is segmented by route of administration, therapy type, drug class, line of therapy, and distribution channel. By route of administration, the market includes oral, parenteral, and others. By therapy type, the market is segmented into targeted therapy, chemotherapy, immunotherapy (mAbs & BsAbs), CAR-T & cell therapy, and combination regimens. By drug class, the market is categorized into BTK inhibitors, BCL-2 inhibitors, PI3K inhibitors, CD20 mAbs, cytotoxic agents, and others. By line of therapy, the market is segmented into first-line, second-line, and relapsed/refractory. By distribution channel, the market is segmented into hospitals, specialty clinics, and online & retail pharmacies. By geography, the market is analyzed across North America, Europe, Asia-Pacific, the Middle East and Africa, and South America. The report also covers the estimated market sizes and trends for 17 countries across major regions globally. The report offers the market sizes and forecasts in terms of value (USD) for the above segments.
| Oral |
| Parenteral |
| Others |
| Targeted Therapy |
| Chemotherapy |
| Immunotherapy (mAbs & BsAbs) |
| CAR-T & Cell Therapy |
| Combination Regimens |
| BTK Inhibitors |
| BCL-2 Inhibitors |
| PI3K Inhibitors |
| CD20 mAbs |
| Cytotoxic Agents |
| Others |
| First-Line |
| Second-Line |
| Relapsed / Refractory |
| Hospitals |
| Speciality Clinics |
| Online & Retail Pharmacies |
| North America | United States |
| Canada | |
| Mexico | |
| Europe | Germany |
| United Kingdom | |
| France | |
| Italy | |
| Spain | |
| Rest of Europe | |
| Asia-Pacific | China |
| Japan | |
| India | |
| Australia | |
| South Korea | |
| Rest of Asia-Pacific | |
| Middle East and Africa | GCC |
| South Africa | |
| Rest of Middle East and Africa | |
| South America | Brazil |
| Argentina | |
| Rest of South America |
| By Route of Administration | Oral | |
| Parenteral | ||
| Others | ||
| By Therapy Type | Targeted Therapy | |
| Chemotherapy | ||
| Immunotherapy (mAbs & BsAbs) | ||
| CAR-T & Cell Therapy | ||
| Combination Regimens | ||
| By Drug Class | BTK Inhibitors | |
| BCL-2 Inhibitors | ||
| PI3K Inhibitors | ||
| CD20 mAbs | ||
| Cytotoxic Agents | ||
| Others | ||
| By Line of Therapy | First-Line | |
| Second-Line | ||
| Relapsed / Refractory | ||
| By Distribution Channel | Hospitals | |
| Speciality Clinics | ||
| Online & Retail Pharmacies | ||
| By Geography | North America | United States |
| Canada | ||
| Mexico | ||
| Europe | Germany | |
| United Kingdom | ||
| France | ||
| Italy | ||
| Spain | ||
| Rest of Europe | ||
| Asia-Pacific | China | |
| Japan | ||
| India | ||
| Australia | ||
| South Korea | ||
| Rest of Asia-Pacific | ||
| Middle East and Africa | GCC | |
| South Africa | ||
| Rest of Middle East and Africa | ||
| South America | Brazil | |
| Argentina | ||
| Rest of South America | ||


Key Questions Answered in the Report
What is the current size of the chronic lymphocytic leukemia market?
The chronic lymphocytic leukemia market is estimated at USD 5.77 billion in 2026 and is projected to climb to USD 7.91 billion by 2031.
Which therapy class holds the largest market share today?
BTK inhibitors hold the largest share at 45.98% of 2025 revenue, driven by first-generation agents and rapid uptake of next-generation molecules.
How fast is the Asia-Pacific market growing?
Asia-Pacific is the fastest-growing region with a projected 9.05% CAGR through 2031, supported by recent approvals in Japan and China.
What is driving adoption of fixed-duration regimens?
Combination therapies that clear minimal residual disease above 90% enable physicians to stop treatment safely, cutting toxicity and overall cost, a key factor for payers.
Why are non-covalent BTK inhibitors important?
They address resistance mutations such as C481S and L528W that limit covalent BTK agents, explaining their projected 8.11% CAGR.
Page last updated on:


