Size and Share of China To Europe Cross-Border E-commerce Logistics Market Analysis
Market Overview
| Study Period | 2020 - 2031 |
|---|---|
| Forecast Data Period | 2026 - 2031 |
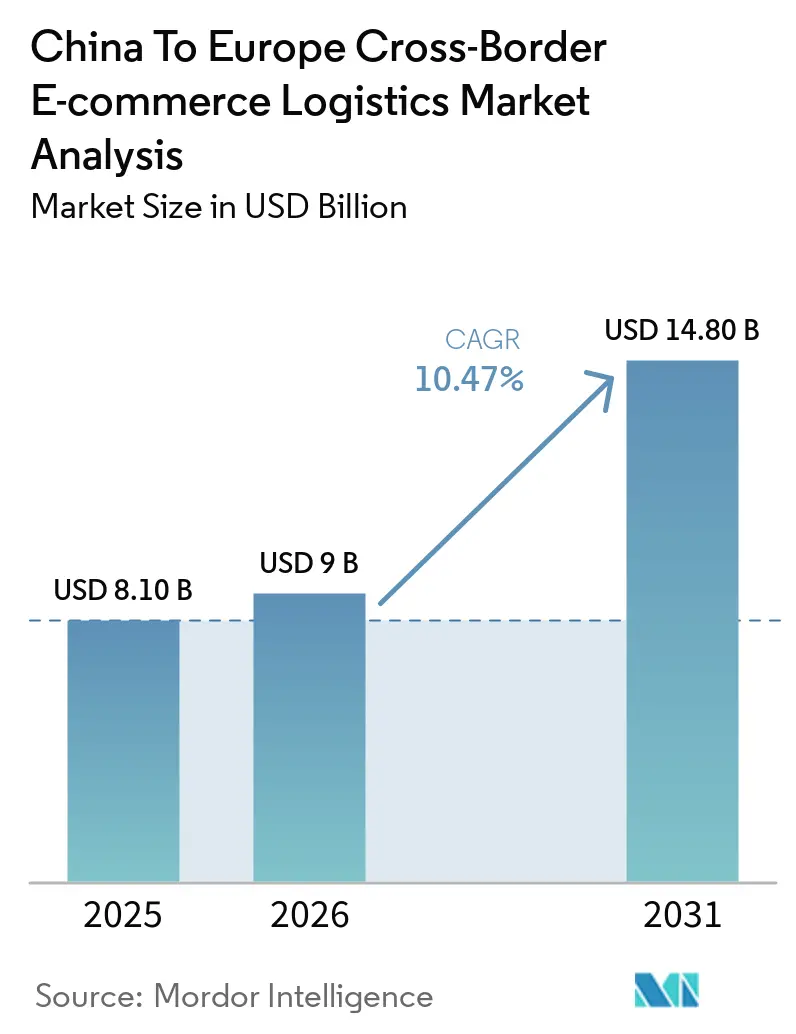
| Base Year Market Size (2025) | USD 8.10 Billion |
| Market Size (2026) | USD 9 Billion |
| Market Size (2031) | USD 14.80 Billion |
| Growth Rate (2026 - 2031) | 10.47% CAGR |
| Market Concentration | Medium |
Major Players *Disclaimer: Major Players sorted in no particular order Image © Mordor Intelligence. Reuse requires attribution under CC BY 4.0. | |
Analysis of China To Europe Cross-Border E-commerce Logistics Market Analysis by Mordor Intelligence
The China-to-Europe cross-border e-commerce logistics market size was valued at USD 8.10 billion in 2025 and is projected to be USD 9 billion in 2026 and USD 14.80 billion by 2031, growing at a CAGR of 10.47% from 2026 to 2031.
The China-to-Europe cross-border e-commerce logistics market is expanding, supported by strong online shopping habits, growing export activity from more Chinese cities, and improved transport and fulfillment networks that enable faster, more reliable deliveries. Demand is driven by consumers in Europe who are increasingly open to buying directly from Chinese sellers, especially for products that offer good value, variety, and convenience. The market is also becoming more professional, with logistics providers focusing on better warehousing, overseas inventory placement, and integrated services to manage cross-border shipments more efficiently. Competition is shifting away from low-cost delivery alone toward stronger service quality, delivery visibility, and compliance management, raising the overall market standard.
Key Report Takeaways
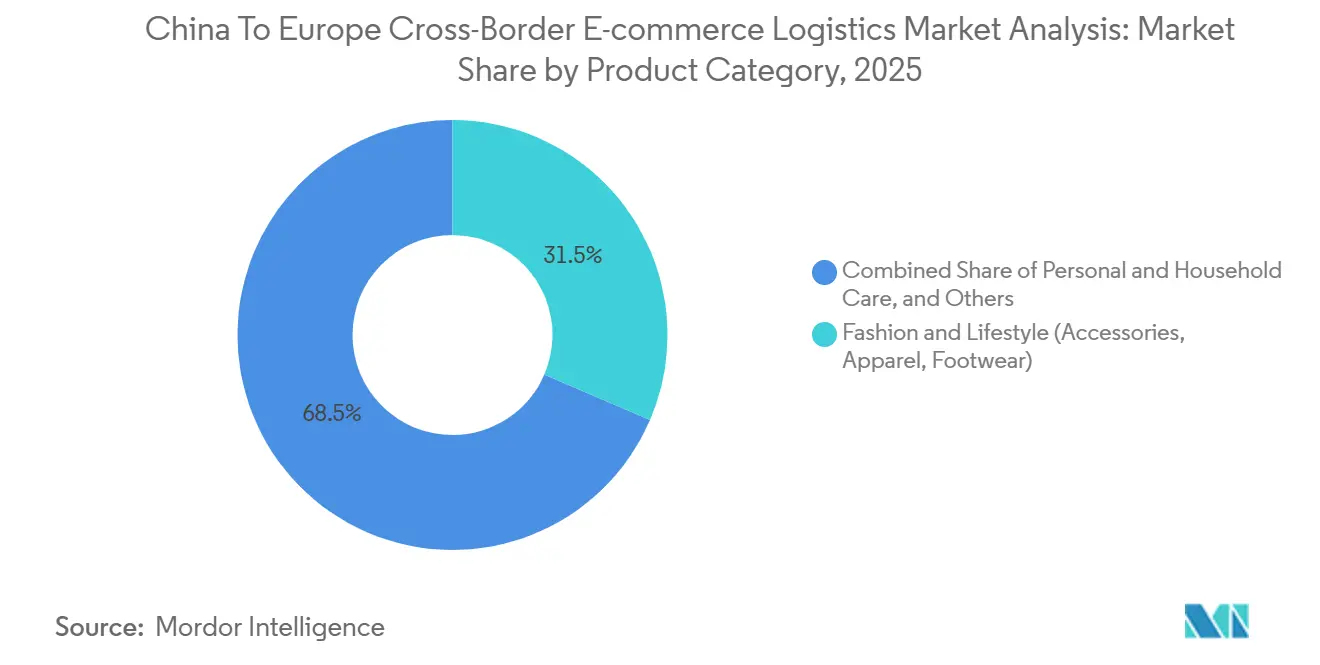
- By product category, fashion and lifestyle led with 31.47% of the China-to-Europe cross-border e-commerce logistics market size in 2025, while personal and household care is projected to grow at 11.45% CAGR through 2031.
- By logistics function, transportation held 71.20% of the China-to-Europe cross-border e-commerce logistics market share in 2025, while value-added services and others are projected to expand at 15.64% CAGR through 2031.
- By business model, B2C accounted for 65.73% of the China-to-Europe cross-border e-commerce logistics market size in 2025, while B2B is projected to grow at 12.81% CAGR through 2031.
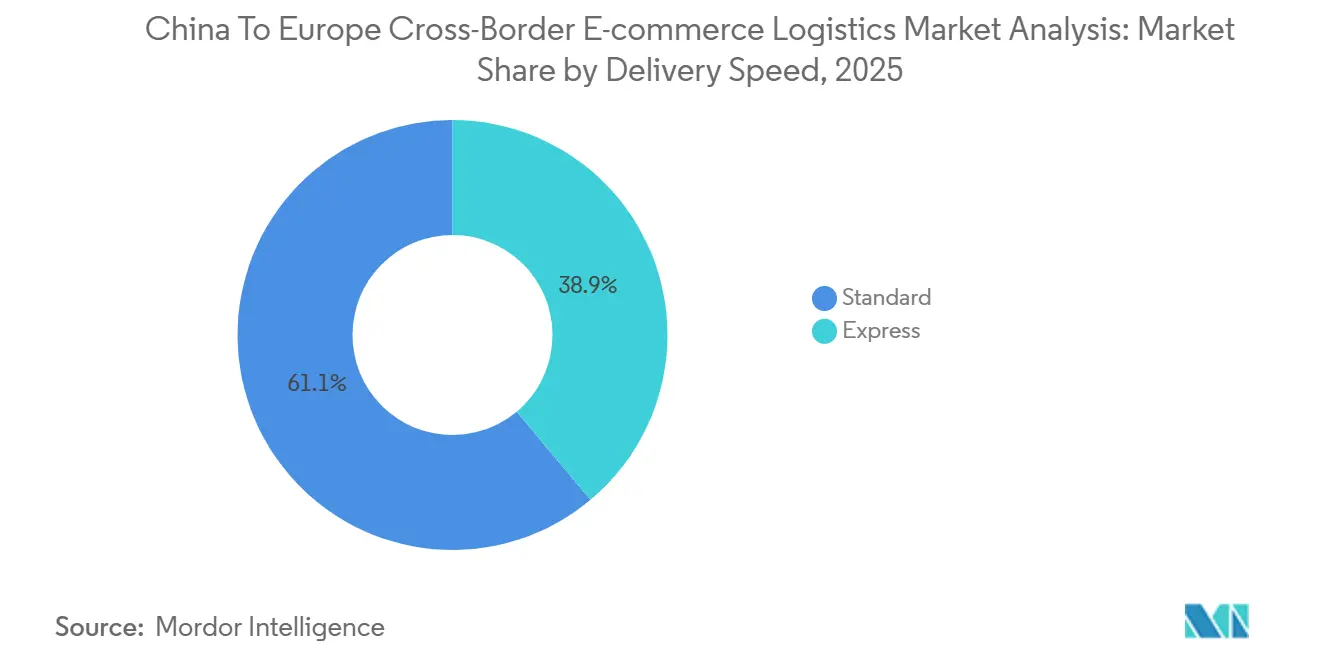
- By delivery speed, standard delivery captured 61.10% of the China-to-Europe cross-border e-commerce logistics market size in 2025, while express delivery is projected to grow at 13.49% CAGR through 2031.
- By destination country, Western Europe held 57.28% of the China-to-Europe cross-border e-commerce logistics market share in 2025, while Eastern Europe is projected to grow at 11.46% CAGR through 2031.
Note: Market size and forecast figures in this report are generated using Mordor Intelligence’s proprietary estimation framework, updated with the latest available data and insights as of January 2026.
Insights and Trends of China To Europe Cross-Border E-commerce Logistics Market Analysis
Drivers Impact Analysis*
| Driver | (~) % Impact on CAGR Forecast | Geographic Relevance | Impact Timeline |
|---|---|---|---|
| Chinese Platform Parcel Surge Into Europe | +2.8% | EU-27, strongest in Germany, France, Poland, and Spain | Short term (≤ 2 years) |
| IOSS Tax Transparency and Faster Clearance | +1.2% | EU-27, especially Germany, France, and the Netherlands | Medium term (2-4 years) |
| EU Warehouse Localization by China-Linked Sellers | +1.8% | Western Europe and Eastern Europe, with strong relevance in Poland | Medium term (2-4 years) |
| Value-Seeking European Consumers Favor China-Origin Assortments | +1.3% | DACH, Southern Europe, and the Nordics | Short term (≤ 2 years) |
| Parcel Locker and Out-of-Home Density Reduce Last-Mile Friction | +1.0% | EU-27, especially Poland, Germany, France, Italy, and Spain | Medium term (2-4 years) |
| Rail, Sea, and Air Mode Shifting for Mid-Value Replenishment SKUs | +0.8% | Europe’s central and eastern corridor, especially Germany, Poland, and the Czech Republic | Medium term (2-4 years) |
| Source: Mordor Intelligence | |||
Chinese Platform-Led Parcel Volume Surge into Europe
Chinese fast-commerce platforms have changed the volume base on the China-Europe corridor. The EU received 5.9 billion low-value parcels in 2025, and the European Commission said close to 90% of those parcels came from China. That volume is putting more pressure on customs data processing, border release systems, and final-mile carrier capacity across the China-to-Europe cross-border e-commerce logistics market. It is also pushing logistics providers to invest in automated declaration tools and stronger pre-arrival data handling to prevent clearance delays from disrupting parcel throughput. In 2026, Chinese platforms are also moving more inventory into EU warehouses, which reduces reliance on direct small-parcel shipping for high-volume stock-keeping units. This is widening the gap between providers that only move parcels and providers that can manage direct consumer parcels and bulk warehouse replenishment within the same operating model.
IOSS-Enabled Checkout Tax Transparency and Smoother Clearance
The Import One-Stop Shop has reduced customs friction for many high-volume sellers shipping into the EU. In May 2025, the Council of the European Union agreed on its position on measures designed to simplify tax collection for imports, and the European Commission stated that the new approach was intended to improve trade and compliance for e-commerce imports[1]Source: Council of the European Union, “VAT Rules: Council Agrees Position on Directive Simplifying Tax Collection for Imports,” Council of the European Union, consilium.europa.eu. In the China-to-Europe cross-border e-commerce logistics market, this matters because sellers who collect VAT at checkout can move goods with less border uncertainty. The same compliance logic now extends into ICS2, where better data quality can reduce inspection risk and improve processing speed for registered operators. Carriers with their own customs gateways are in a stronger position because they can package tax handling, customs filing, and border release into one service. As the EU moves toward a more centralized customs data model, early investment in standardized data pipelines is becoming a practical service advantage rather than only a compliance expense.
EU Warehousing Localization by China-Linked Sellers
Warehouse localization within Europe is reshaping how revenue is distributed across the value chain in the China-to-Europe cross-border e-commerce logistics market. Cainiao operated more than 50 overseas warehouses across 18 countries by early 2026, and its European facilities covered more than 400,000 m² across Poland, the U, France, Germany, and Spain. This model supports 2- to 3-day domestic-style delivery for stocked items and reduces reliance on direct parcel injection from China for every order. It also changes the customs profile, as a single bulk shipment entering Europe can replace a large number of individual B2C parcels, lowering per-unit compliance costs but increasing warehouse handling requirements. That shift favors operators that can combine bonded warehousing, inventory handling, customs deferment, and returns processing at a single site. The result is that the China-to-Europe cross-border e-commerce logistics market is steadily shifting part of its value pool from pure transport to integrated fulfillment and compliance services.
Parcel-Locker and Out-Of-Home Density Lowers Last-Mile Friction
Out-of-home delivery infrastructure is becoming a core cost and service lever across Europe. InPost added 14,200 parcel machines in 2025 and expanded its network to more than 28,000 lockers in Poland, 19,000 in continental Europe, and nearly 14,000 in the United Kingdom[2]Source: InPost Group, “InPost Accelerates the Development of Its European Out-of-Home Network,” InPost Group, inpost.pl. Geopost also reported reaching 140,000 out-of-home points across Europe in 2025, confirming how quickly consumer pickup infrastructure is scaling. In the China-to-Europe cross-border e-commerce logistics market, denser locker networks improve delivery predictability and reduce operational drag from failed home delivery attempts. They also make standard delivery more competitive by speeding up and reducing the cost of the last-mile handoff once parcels enter domestic networks. This is one reason Poland, Germany, France, Italy, and Spain have become important operating grounds for China-linked logistics players and their European carrier partners.
Restraints Impact Analysis*
| Restraint | (~) % Impact on CAGR Forecast | Geographic Relevance | Impact Timeline |
|---|---|---|---|
| End of EU Low-Value Duty Relief and Parcel Fees | -1.8% | EU-27, the strongest effect on Germany, France, and the Netherlands | Short term (≤ 2 years) |
| GPSR and ICS2 Data Compliance Burden on Non-EU Sellers | -0.8% | EU-27 | Medium term (2-4 years) |
| Reverse Logistics Economics Weaken Low-Ticket Bulky Baskets | -0.6% | Western Europe, especially France, Germany, and the United Kingdom | Medium term (2-4 years) |
| Route Risk From Red Sea and Eurasian Rail Volatility | -0.5% | Asia-Europe corridor with strongest effect during peak season planning | Short term (≤ 2 years) |
| Source: Mordor Intelligence | |||
End of EU Low-Value Duty Relief and Parcel Fees
The removal of the EU’s EUR 150 (USD 162) customs duty exemption is the most important near-term regulatory change affecting this corridor. In December 2025, the Council agreed to levy customs duty on small parcels from July 1, 2026, and this reform introduced a flat EUR 3 (USD 3.2) charge per tariff heading on sub-EUR 150 (USD 173.59) parcels. The rule makes very low-ticket baskets less attractive when sellers continue to use direct parcel shipping from China. It also pushes platforms to shift popular items into European storage programs so duty exposure is managed through bulk imports rather than repeated low-value parcel entries. That does not remove logistics demand from the China-to-Europe cross-border e-commerce logistics market. Still, it does shift part of the revenue base toward ocean, rail, warehousing, and domestic European distribution. Providers that can handle both direct parcel flows and localized replenishment flows are therefore better placed to protect revenue as the regulatory model changes.
GPSR and ICS2 Data-Compliance Burden on Non-EU Sellers
The China-to-Europe cross-border e-commerce logistics market is also facing a higher compliance floor, as the EU now requires stronger product safety accountability and more complete shipment data. The General Product Safety Regulation took effect on December 13, 2024, and it requires products sold in the EU to have a designated EU-based Responsible Economic Operator. ICS2 became fully mandatory across all transport modes on September 1, 2025, meaning carriers must submit pre-arrival data that includes accurate classification and trader information. These rules weigh more heavily on smaller Chinese sellers that do not have in-house EU legal, customs, or tax teams. They also raise the value of logistics providers that can bundle transport, customs handling, safety compliance support, and data filing under a single contract. That is concentrating more business with operators who have their own systems, their own clearance capabilities, and stronger familiarity with EU product and import rules.
*Our forecasts treat driver/restraint impacts as directional, not additive. The impact forecasts reflect baseline growth, mix effects, and variable interactions.
Segment Analysis
By Product Category: Fashion Dominates but Health and Beauty Reshapes the Mix
Fashion and lifestyle accounted for 31.47% of the China-to-Europe cross-border e-commerce logistics market share in 2025, while personal and household care is forecast to grow at a 11.45% CAGR through 2031. Fashion kept the lead because Shein and Temu built very high order volumes in apparel, footwear, and accessories across Europe. Even so, the category mix is changing as Chinese sellers add more skincare, wellness, and household care lines that encourage repeat purchases and usually face lower return rates than apparel. Consumer electronics and household appliances also remain strategically important because brands such as Anker, Xiaomi, and DJI create demand for safer transport, better packaging, and more controlled storage conditions.
Foods and beverages and furniture remain smaller parts of the China-to-Europe cross-border e-commerce logistics industry, but both categories pose difficult handling requirements. Foods and beverages require stronger temperature control and tighter food compliance documentation inside Europe. Furniture creates high-weight, low-frequency shipments, where logistics costs per order can quickly erode the customer value proposition. SF International said its cross-border e-commerce logistics revenue from China to Europe doubled year on year in H1 2025, and apparel and electronics were important parts of that mix. That revenue pattern suggests the China-to-Europe e-commerce logistics market is gaining value not only from more orders, but also from categories that support higher fulfillment revenue per shipment.


By Logistics Function: Transport Anchors Revenue, Value-Added Services Drive Growth
Transportation accounted for 71.20% of the China to Europe cross-border e-commerce logistics market size in 2025, while value-added services and others are projected to grow at 15.64% CAGR through 2031. Air, ocean, rail, and road continue to serve different urgency and cost needs on the corridor, so transport remains the largest revenue pool. At the same time, the faster-growing opportunity is moving toward returns handling, compliance labeling, IOSS administration, customs support, and kitting. Warehousing, distribution, and inventory management are also becoming increasingly important as more chinese sellers stock goods in Europe to shorten delivery windows.
The air segment still carries a structural premium for urgent or higher-value orders, and SF Airlines launched a twice-weekly B747-400F service between Ezhou Huahu and Paris-Charles de Gaulle in April 2026 to strengthen that capability. Rail is holding a valuable middle position because the China-Europe Railway Express handled 5,460 train trips and 546,000 TEUs in Q1 2026, up 29% and 22% year on year. That performance matters because route instability in maritime corridors has made rail more attractive for mid-value replenishment cargo. Over time, that shift can move some replenishment freight from ocean to rail without materially reducing the need for warehousing and domestic European distribution.
By Business Model: B2C Retains Scale, B2B Accelerates on Cost Efficiency
B2C held 65.73% share of the China to Europe cross-border e-commerce logistics market size in 2025, while B2B is forecast to grow at 12.81% CAGR through 2031. B2C remains the largest model because chinese platform e-commerce has been built around direct consumer ordering. B2B is growing faster because sellers can consolidate more stock into containerized or palletized shipments, thereby lowering logistics costs per unit. That logic becomes even stronger when direct low-value parcels face new duty pressures within the EU.
The rise of B2B changes the balance of power within the China-to-Europe cross-border e-commerce logistics industry, as freight forwarding and customs brokerage become more important as shipments grow larger and become less frequent. C2C remains smaller, but it still reflects resale and secondary platform activity that can add complexity when returns and VAT treatment vary by country. DSV said that more than 50 countries were fully integrated or were in the process of integration by the end of Q1 2026 following the DB Schenker acquisition, and the company expects annual synergies of DKK 9 billion (USD 1.4 billion). That kind of full-service network scale gives Western 3PLs a stronger position as Chinese sellers move from parcel-led B2C distribution toward warehouse replenishment and managed cross-border freight.
By Delivery Speed: Standard Volume Stays Large, Express Revenue Scales Faster
Standard delivery accounted for 61.10% of market share in 2025, while express is projected to expand at 13.49% CAGR through 2031. Standard kept the lead because many consumers still accepted 7 to 15-day delivery windows for fashion, household items, and other price-sensitive goods sent directly from China. Express is growing faster because delivery expectations are rising as EU-based stock can reach buyers in 2 to 5 days. That change is forcing sellers without localized inventory to rely more on premium air-backed delivery products to protect conversion and repeat purchase behavior.
Standard delivery still matters because it provides the China-to-Europe cross-border e-commerce logistics market with its largest volume base and serves as a reference point for express pricing. In countries with high locker density, standard delivery can still feel competitive because the final-mile handoff is quicker and more reliable. InPost’s 2025 network expansion and Geopost’s broad out-of-home footprint show why standard service can improve materially once parcels move through mature pickup networks. That is one reason Eastern Europe is growing quickly, even when a large share of demand still sits in standard rather than express service.
Geography Analysis
Western Europe accounted for 57.28% of the China-to-Europe cross-border e-commerce logistics market share in 2025, making it the main demand center on this corridor. Germany serves as the core inland distribution hub because its road and rail connectivity enables a broad reach across DACH and nearby markets from a limited number of warehouse clusters. France also remains important because stronger tax and customs readiness among large sellers can reduce border friction and support tighter delivery commitments. The United Kingdom adds a separate compliance layer after Brexit, but its scale continues to attract China-linked investment in cargo handling and last-mile partnerships. Spain and Italy are also gaining weight as Southern European demand rises and service coverage becomes more reliable.
Eastern Europe is forecast to post a 11.46% CAGR in the China-to-Europe cross-border e-commerce logistics market share through 2031, making it the fastest-growing destination group in the study. Poland sits at the center of that trend because it offers warehouse capacity, strong road links, and practical access to Germany and the wider EU. EuroCommerce said Eastern European B2C e-commerce turnover grew by 18% in 2024, supporting the case for sustained investment by sellers and carriers across the region. The China-to-Europe cross-border e-commerce logistics market is also benefiting from broader shipment growth on the corridor, and the Holland International Distribution Council said cross-border B2C e-commerce shipments on the route rose 28% year on year in 2025[3]Source: Holland International Distribution Council, “China Logistics & Supply Chain 2026,” Holland International Distribution Council, hollandinternationaldistributioncouncil.com. Romania, Hungary, and the Czech Republic are important follow-on markets because improving e-commerce adoption and growing locker infrastructure are making service models more scalable.
Northern Europe is smaller in absolute terms, but it remains a high-value part of the China-to-Europe cross-border e-commerce logistics market because spending per online buyer is high and delivery service expectations are clear. Geopost said lockers were the second-most-preferred delivery option in Europe in 2025, which aligns well with Nordic and Baltic customer behavior. Chinese carrier penetration is still lower here than in Western or Eastern Europe, so direct-service expansion has room to grow as operators look beyond their current hub structures. The Baltics also offer a smaller but digital-forward entry point for sellers that want to test demand before scaling farther across the Nordic region.
Competitive Landscape
The China-to-Europe cross-border e-commerce logistics market shows moderate concentration, with Chinese specialist carriers and European logistics groups competing on different strengths. Cainiao, JD Logistics, SF International, YunExpress, 4PX, and ECMS are closely linked to Chinese merchant flows and tend to compete on integration with selling platforms, delivery speed, and cost. DHL, DSV, Kuehne+Nagel, and CEVA Logistics bring greater customs expertise, wider multimodal networks, and more experience with EU-compliance-heavy freight. That difference matters because the corridor is shifting from a parcel-only model toward a mixed structure that includes freight, warehousing, compliance, and domestic distribution. The China-to-Europe cross-border e-commerce logistics market is, therefore, rewarding players that can bridge both Chinese sourcing scale and European regulatory compliance.
Large strategic moves in 2025 and 2026 show how quickly the competitive model is changing. SF Holding and J&T Express announced a cross-shareholding deal worth HKD 8.3 billion (USD 1.1 billion) in January 2026, reflecting a clear push toward broader first-mile-to-last-mile capabilities. JD.com and DHL signed a memorandum of understanding in February 2026 to support German brand growth in China and to connect chinese and european consumer channels through JD’s Joybuy and JoyExpress networks[4]Source: JD.com, “JD.com and DHL Sign Memorandum of Understanding to Support German Brands’ Growth in China and Europe,” JD Corporate Blog, jdcorporateblog.com. DSV also continued integrating DB Schenker through Q1 2026, which strengthened its position in Asia-Europe forwarding and large-account B2B logistics. In another move tied to service quality and scale, Cainiao announced plans in March 2026 to deploy robotic warehouses in the Netherlands, Spain, France, and Germany. These actions show that carriers are no longer defending only transport lanes they are also defending data capability, warehouse reach, customs execution, and direct consumer service performance.
Returns management and compliance-bundled fulfillment remain open areas for competition. Many operators can move parcels into Europe, but fewer can combine customs handling, product compliance support, relabeling, resale preparation, and localized returns within a single network. SF International reported 13 overseas ports with self-operated clearance capabilities and 10 AEO advanced certification licenses as of H1 2025, underscoring why compliance-linked service breadth is becoming a meaningful differentiator. As the China-to-Europe cross-border e-commerce logistics market becomes more regulated and more warehouse-based, that type of integrated capability is likely to matter as much as pure transport speed.
Leaders of China To Europe Cross-Border E-commerce Logistics Market Analysis
DHL Group
Cainiao Group
JD Logistics
SF Express / SF International
YunExpress
- *Disclaimer: Major Players sorted in no particular order

Recent Industry Developments
- April 2026: ZTO Express launched its first widebody freighter aircraft on a China-Europe route, marking ZTO's entry into long-haul air cargo as cross-border e-commerce demand and geopolitical freight-route disruptions elevated air freight economics.
- February 2026: JD.com and DHL Group signed a Memorandum of Understanding at JD.com's Beijing headquarters to support German brand expansion in China via JD's cross-border platform and to give German brands access to european consumers through JD's Joybuy EU retail platform.
- January 2026: SF Holding (SF Express parent) and J&T Global Express announced a strategic cross-shareholding agreement involving mutual issuance of new shares totaling approximately HKD 8.3 billion (USD 1.05 billion).
- December 2025: Evri (United Kingdom) and SF International signed a Memorandum of Understanding at SF Express's Shenzhen headquarters to streamline cross-border shipping between China and the United Kingdom, develop joint solutions for retailers and consumers, and explore market expansion into the US and Australia.


Scope of Report on China To Europe Cross-Border E-commerce Logistics Market Analysis
| Foods and Beverages |
| Personal and Household Care |
| Fashion and Lifestyle (Accessories, Apparel, Footwear) |
| Furniture |
| Consumer Electronics and Household Appliances |
| Other Products |
| Transportation | Road |
| Air | |
| Sea and Inland Waterways | |
| Rail | |
| Warehousing, Distribution and Inventory Management | |
| Value-added Services and Others |
| B2C |
| B2B |
| C2C |
| Express |
| Standard |
| Western Europe | Germany |
| France | |
| United Kingdom | |
| BENELUX | |
| Spain | |
| Italy | |
| Rest of Western Europe | |
| Eastern Europe | Poland |
| Czech Republic | |
| Hungary | |
| Romania | |
| Rest of Eastern Europe | |
| Northern Europe (Nordics & Baltic Countries) |
| By Product Category | Foods and Beverages | |
| Personal and Household Care | ||
| Fashion and Lifestyle (Accessories, Apparel, Footwear) | ||
| Furniture | ||
| Consumer Electronics and Household Appliances | ||
| Other Products | ||
| By Logistics Function | Transportation | Road |
| Air | ||
| Sea and Inland Waterways | ||
| Rail | ||
| Warehousing, Distribution and Inventory Management | ||
| Value-added Services and Others | ||
| By Business Model | B2C | |
| B2B | ||
| C2C | ||
| By Delivery Speed | Express | |
| Standard | ||
| By Destination Country | Western Europe | Germany |
| France | ||
| United Kingdom | ||
| BENELUX | ||
| Spain | ||
| Italy | ||
| Rest of Western Europe | ||
| Eastern Europe | Poland | |
| Czech Republic | ||
| Hungary | ||
| Romania | ||
| Rest of Eastern Europe | ||
| Northern Europe (Nordics & Baltic Countries) | ||


Key Questions Answered in the Report
What is the current size of e-commerce logistics between China and Europe?
The sector stood at USD 9 billion in 2026 and is projected to reach USD 14.80 billion by 2031 at a 10.47% CAGR.
Which destination group accounts for the majority of parcel flows from China into Europe?
Western Europe led with 57.28% share in 2025, supported by Germany, France, the United Kingdom, Spain, and other mature delivery markets.
Which service area is growing the fastest on this corridor?
Value-added services and others is expanding the fastest, at a 15.64% CAGR through 2031, as sellers need customs support, returns handling, and compliance services.
Why is Eastern Europe becoming increasingly important to Chinese sellers?
Eastern Europe is projected to grow at a 11.46% CAGR, driven by rising e-commerce adoption and improvements in locker-based delivery networks that enhance service efficiency.
How is the EU duty change affecting fulfillment models?
The July 2026 small-parcel duty is pushing sellers to use more EU warehousing and bulk replenishment rather than relying solely on direct low-value parcel shipping.
What business model is creating the strongest forwarder opportunity?
B2B is growing the fastest, with a 12.81% CAGR, as larger consolidated shipments increase the importance of freight forwarding, customs brokerage, and warehouse replenishment.
Page last updated on:


