China Global Capability Centers Market Size and Share
Market Overview
| Study Period | 2020 - 2031 |
|---|---|
| Forecast Data Period | 2026 - 2031 |
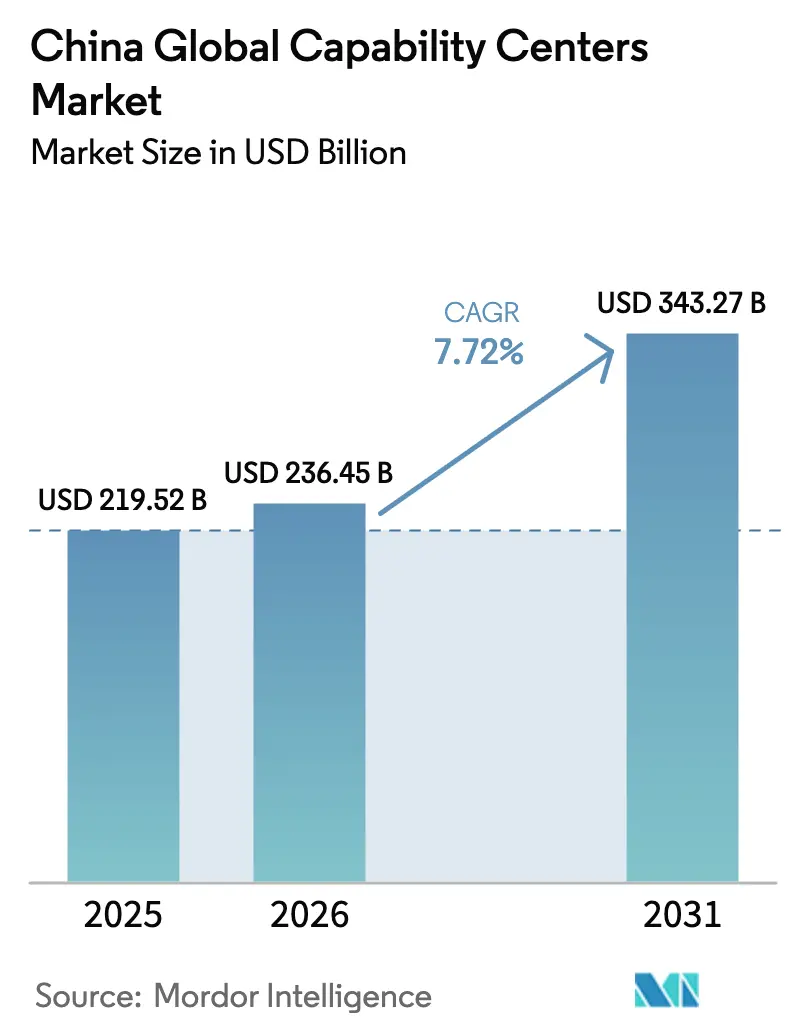
| Base Year Market Size (2025) | USD 219.52 Billion |
| Market Size (2026) | USD 236.45 Billion |
| Market Size (2031) | USD 343.27 Billion |
| Growth Rate (2026 - 2031) | 7.72% CAGR |
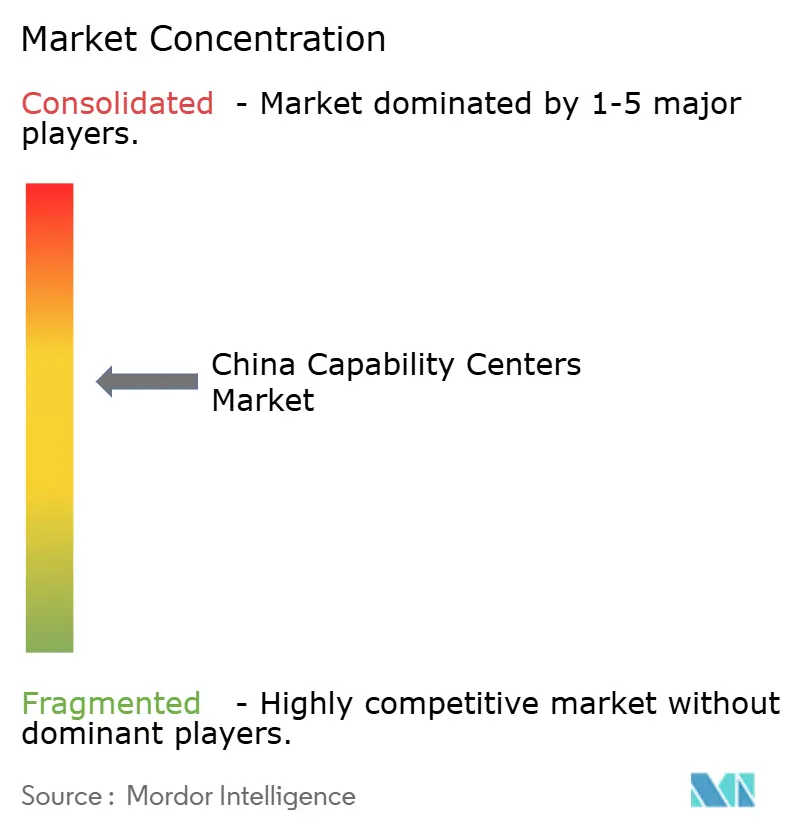
| Market Concentration | Medium |
Major Players *Disclaimer: Major Players sorted in no particular order Image © Mordor Intelligence. Reuse requires attribution under CC BY 4.0. | |
China Global Capability Centers Market Analysis by Mordor Intelligence
The China Global Capability Centers market size in 2026 is estimated at USD 236.45 billion, growing from 2025 value of USD 219.52 billion with 2031 projections showing USD 343.27 billion, growing at 7.72% CAGR over 2026-2031. Robust progress reflects the combined pull of an unmatched STEM talent base, wide-ranging government incentives, and deep integration with China’s manufacturing and digital ecosystems. Heightened digital transformation spending, a sustained pivot to intelligent manufacturing, and the maturing of lower-tier city ecosystems are broadening demand beyond traditional Tier-1 hubs, while mounting regulatory complexity keeps operational control firmly in focus. The accelerating flow of foreign direct investment into advanced R&D and software engineering centers signals that China Global Capability Centers are moving up the value curve, earning reputations as innovation engines rather than purely cost-saving units. A counter-current of wage inflation and data-transfer restrictions has created new risk variables, yet the structural advantages that built the China Global Capability Centers market continue to outweigh these headwinds and sustain its long-run expansion trajectory.
Key Report Takeaways
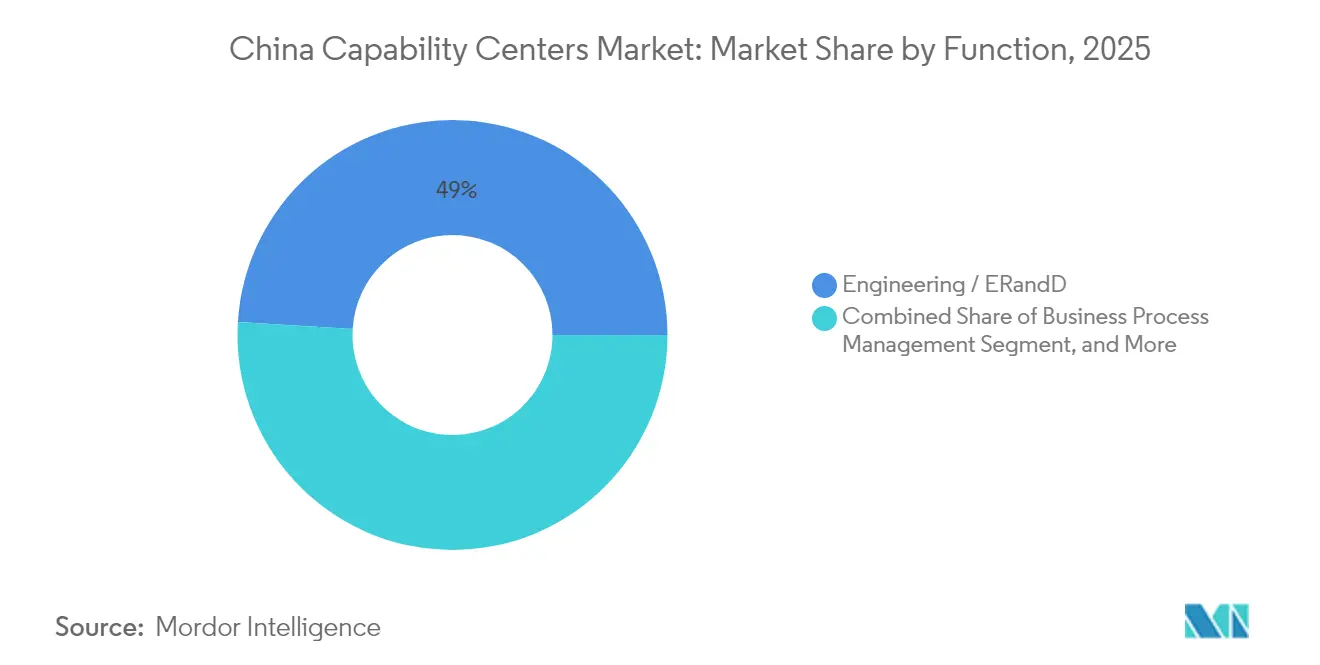
- By function, engineering services held 49.03% of the China Global Capability Centers market share in 2025. Information Technology and digital services are projected to post the fastest growth, with an 8.12% CAGR through 2031.
- By engagement model, captive centers commanded 60.62% of the China Global Capability Centers market size in 2025; hybrid build-operate-transfer arrangements are forecast to grow at a 8.79% CAGR to 2031.
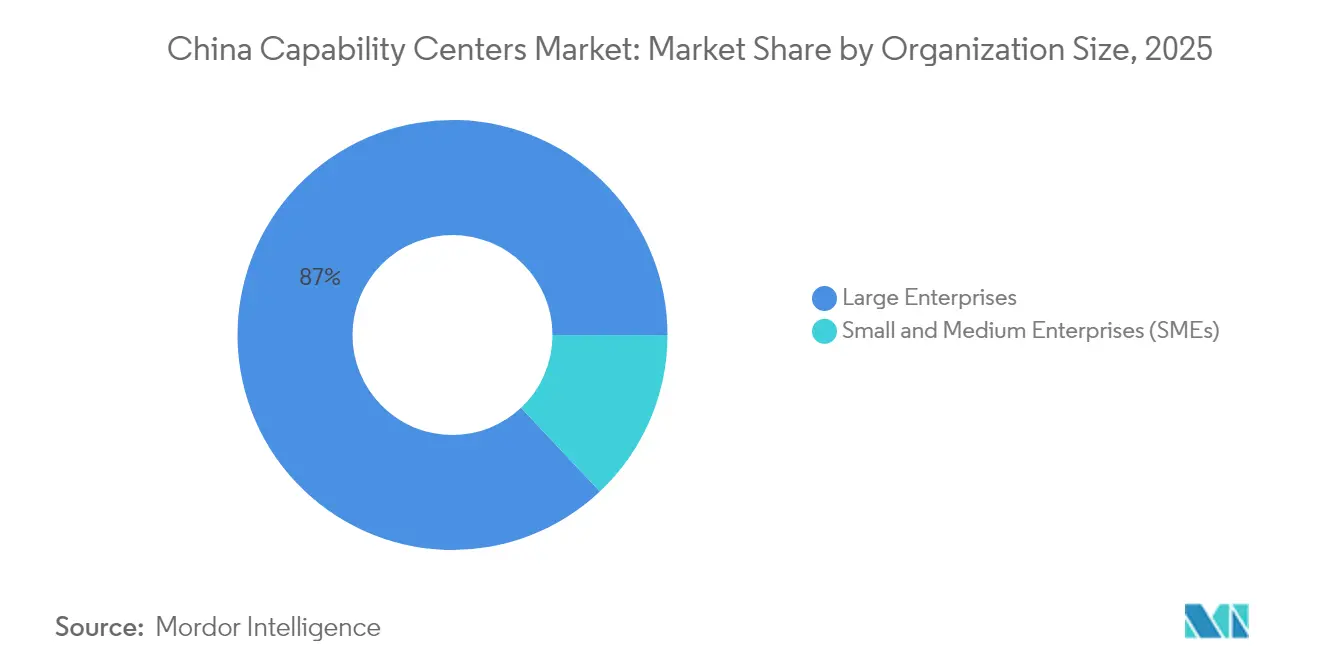
- By organization size, large enterprises accounted for 87.02% of the China Global Capability Centers market share in 2025; small and medium enterprises are expected to advance at a 9.33% CAGR through 2031.
- By industry vertical, manufacturing, automotive, and industrial applications led with a 45.09% revenue share in 2025; healthcare and life sciences are projected to record the highest CAGR of 8.35% up to 2031.
Note: Market size and forecast figures in this report are generated using Mordor Intelligence’s proprietary estimation framework, updated with the latest available data and insights as of 2026.
China Global Capability Centers Market Trends and Insights
Drivers Impact Analysis*
| Driver | (~) % Impact on CAGR Forecast | Geographic Relevance | Impact Timeline |
|---|---|---|---|
| Rising domestic digital transformation initiatives | +2.1% | Global, with a concentration in Tier-1 cities | Medium term (2-4 years) |
| Access to a large STEM graduate pool | +1.8% | National, strongest in university hub cities | Long term (≥ 4 years) |
| Central and local government subsidies for high-tech services | +1.5% | National, enhanced in designated development zones | Short term (≤ 2 years) |
| Increasing adoption of intelligent manufacturing (Industry 4.0) | +1.4% | Manufacturing regions, Pearl River Delta, Yangtze River Delta | Medium term (2-4 years) |
| Growing demand for Mandarin language BPM support in the Belt and Road markets | +0.9% | National, concentrated in international business hubs | Long term (≥ 4 years) |
| Under-penetrated lower-tier city cost arbitrage | +0.4% | Tier-2 and Tier-3 cities nationwide | Medium term (2-4 years) |
| Source: Mordor Intelligence | |||
Rising Domestic Digital Transformation Initiatives
Surging enterprise spending on advanced analytics, artificial intelligence, and automation has redefined the mandate of many China Global Capability Centers. The government’s AI Plus program triggered more than USD 7 billion in inbound technology investment in 2024, with 59% of surveyed firms increasing their digital budgets. Captive centers now host cloud-native teams that roll out micro-services architectures for Chinese and international markets, transforming these hubs into platforms that shape group-wide digital blueprints. Localization requirements embedded in 2025 policy updates further anchor these activities onshore by compelling multinationals to build, test, and secure software within mainland facilities.
Access to Large STEM Graduate Pool
Chinese universities collectively graduate over 4.7 million STEM majors annually, the world’s largest reservoir of engineering and computer science talent.[1]China Daily, “China's STEM Education Initiatives and Graduate Production Statistics,” chinadaily.com.cn Direct campus recruiting agreements enable multinationals to fill niche skill sets in AI modeling, embedded systems, and semiconductor design at salaries that still undercut Western levels by double-digit percentages. Partnerships that embed company staff in university laboratories accelerate joint IP creation while grooming future hires, reinforcing the talent-centric magnetism underpinning the China Global Capability Centers market.
Central and Local Government Subsidies for High-Tech Services
At the national level, the 2025 Action Plan for Stabilizing Foreign Investment proposes lower corporate tax rates, accelerated depreciation, and customs facilitation tailored to research and development (R&D) operations.[2]China Daily, “2025 Action Plan for Stabilizing Foreign Investment Details,” chinadaily.com.cn Provinces enhance these benefits through rent rebates and cash grants, which reduce ownership costs for China Global Capability Centers by up to 25%. The cumulative subsidy framework shortens payback windows, tipping internal investment committees toward China even amid geopolitical uncertainty.
Increasing Adoption of Intelligent Manufacturing (Industry 4.0)
Massive outlays on smart factories are driving demand for embedded software, robotics integration, and industrial IoT platforms that align seamlessly with China’s Made in China 2025 goals.[3]Reuters, “Geopolitical Tensions Impact on China Operations,” reuters.com Bosch, Siemens, and Schneider Electric enlarged their China engineering footprints in 2024 to co-develop cyber-physical systems for local and global plants, converting Global Capability Centers into crucibles for next-generation industrial solutions. These mandates fuel a virtuous cycle: deeper technology complexity requires more highly skilled engineers, which in turn locks incremental value into the China Global Capability Centers market.
Restraints Impact Analysis*
| Restraint | (~) % Impact on CAGR Forecast | Geographic Relevance | Impact Timeline |
|---|---|---|---|
| Intensifying wage inflation in Tier-1 cities | -1.2% | Beijing, Shanghai, Shenzhen, Guangzhou | Short term (≤ 2 years) |
| Tougher cross-border data-transfer regulations | -0.9% | National, affecting data-intensive operations | Medium term (2-4 years) |
| Heightened geopolitical supply-chain diversification away from China | -0.7% | Global impact, concentrated in strategic sectors | Long term (≥ 4 years) |
| Competition from emerging Asia Pacific near-shore locations | -0.5% | Regional, affecting cost-sensitive operations | Medium term (2-4 years) |
| Source: Mordor Intelligence | |||
Intensifying Wage Inflation in Tier-1 Cities
Annual salary increases of 15-20% in top metropolitan areas narrowed the once-wide labor cost gap versus developed markets in 2024.[4]Financial Times, “Wage Inflation Trends in Chinese Technology Sector,” ft.com Scarcity premiums for seasoned AI engineers and cybersecurity architects escalate retention budgets, prompting firms to reassess location strategies. A growing share of new headcount is therefore deployed into Chengdu, Xi’an, and Wuhan, while captive centers in Tier-1 hubs pivot toward higher-value architectural and product management roles that justify premium pay bands.
Tougher Cross-Border Data-Transfer Regulations
Mandatory security assessments introduced in late 2024 slow multinational efforts to shuttle operational data out of China, adding 8-12% to compliance overheads for analytics-heavy functions. Several technology majors have already segmented global data lakes, resulting in partial duplication of platforms, processes, and personnel. Global Capability Center leaders must now balance data sovereignty with global integration, a tension that shapes both solution architecture and the overall cost calculus in the China Global Capability Centers market.
*Our forecasts treat driver/restraint impacts as directional, not additive. The impact forecasts reflect baseline growth, mix effects, and variable interactions.
Segment Analysis
By Function / Capability: Engineering Services Drive Market Leadership
Engineering and R&D activities captured 49.03% of the China Global Capability Centers market share in 2025, underscoring the importance of proximity to the world’s largest manufacturing base in keeping high-value product development anchored in China. Multinationals use these centers to co-design hardware, refine firmware, and run rapid prototyping loops that shorten global product launch cycles. The ability to combine shop-floor data with advanced simulation tools gives engineering hubs a clear edge in delivering reliability improvements and cost reductions that ripple across global supply chains. These advantages secure a durable core role for engineering services inside the China Global Capability Centers market.
The China Global Capability Centers market size tied to information technology and digital services is forecast to climb at an 8.12% CAGR through 2031 as cloud migration, low-code development, and AI-enabled analytics scale across Chinese operations. Captive teams now roll out DevSecOps pipelines and micro-services architectures for both domestic and overseas business units, converting Chinese sites from back-office satellites into full-stack digital product studios. Cross-pollination between software squads and hardware engineers further elevates innovation output, embedding digital twins and predictive algorithms directly into new product designs.


By Engagement Model: Captive Centers Maintain Control Advantages
Captive entities accounted for 60.62% of the China Global Capability Centers' market share in 2025, reflecting the preference of premium multinationals for direct oversight of intellectual property and regulatory compliance. Full ownership allows headquarters to impose uniform cybersecurity policies, align talent retention plans with global benchmarks, and respond promptly to data localization audits. These factors outweigh higher fixed costs for many firms, especially those managing sensitive source code or regulated customer information.
Hybrid build-operate-transfer structures are projected to expand at a 8.79% CAGR, the fastest pace among engagement models, because they split early-stage execution risk between an experienced local partner and the client enterprise. Firms adopt a phased timeline that begins with outsourced setup and transitions into full captive status once staff, processes, and compliance tooling are stabilized. The China Global Capability Centers market size associated with these hybrid frameworks, therefore, rises in tandem with policy shifts, providing companies with a buffer while they calibrate their long-term real estate, talent, and audit strategies.
By Organization Size: Large Enterprises Lead While SMEs Accelerate
Large enterprises commanded 87.02% of 2025 revenue, leveraging their global capital resources to establish expansive China Global Capability Centers that integrate software labs, prototype workshops, and multilingual business services. These corporations negotiate preferential leasing, tap provincial subsidies first, and deploy rotational leadership programs that sustain governance rigor across multiple sites. Their entrenched scale cements bargaining power with telecom carriers, cloud providers, and university partners, reinforcing a virtuous cycle of capability accumulation.
Small and medium enterprises are forecasted to grow at a 9.33% CAGR, benefiting from SaaS-based security stacks, virtual workstation provisioning, and provincial one-stop registration desks that reduce launch times from years to months. Cloud-native designs enable SMEs to lease capacity rather than build data centers, while standardized DevOps toolchains provide enterprise-grade quality controls without the need for heavy upfront licensing fees. Expanding SME footprints diversifies the client mix within the China Global Capability Centers market and intensifies competition for mid-career engineers outside Tier 1 metros.
By Industry Vertical: Manufacturing Anchor with Healthcare Surge
Manufacturing, automotive, and industrial players held 45.09% of 2025 revenue, leveraging co-location with production plants to refine battery chemistry, drivetrain software, and predictive maintenance models in tight sprint cycles. Access to on-site test rigs and local supply chains keeps engineering change orders short and cost exposures low, reinforcing the manufacturing sector’s anchoring role in the China Global Capability Centers market share.
Healthcare and life sciences capabilities are expected to post the highest 8.35% CAGR to 2031, as global pharmaceutical companies expand clinical data management, regulatory dossier preparation, and AI-driven compound screening within their Chinese hubs. Recent reforms that accelerate trial approvals, combined with a large patient base, justify deeper investment. Newly formed bioinformatics teams collaborate with hospital networks to train algorithms using localized genomic data. This two-way flow of clinical insight and computational power propels the China Global Capability Centers market size devoted to healthcare applications.
Geography Analysis
Tier-1 metros, Beijing, Shanghai, Shenzhen, and Guangzhou, accounted for the majority of 2025 spend in the China Global Capability Centers market, a dominance rooted in dense talent pipelines, top-grade fiber backbones, and easy international flight access. These cities also house regulators and mature venture ecosystems, both of which accelerate solution certification and partner discovery. Companies, therefore, continue to place mission-critical architecture and program management roles in Tier 1 districts, despite higher wages and office rents.
Tier-2 locales such as Chengdu, Xi’an, Wuhan, and Nanjing captured a rising share in 2025, offering 30-50% cost savings on space and salaries while still drawing graduates from top provincial universities. Provincial governments reinforce the value proposition with rent rebates, hiring stipends, and fast-track work-permit services that lower the break-even point for new entrants. The China Global Capability Centers market size in these cities scales rapidly as captive centers relocate support functions and Agile pods to balance city-center inflation pressures.
Cross-regional corridors, including the Greater Bay Area and the Yangtze River Delta, now link multiple urban clusters through high-speed rail, shared data center footprints, and harmonized tax incentives. This mesh infrastructure enables follow-the-sun Agile squads to hand off code between Guangzhou and Suzhou without switching time zones, maintaining high productivity while respecting data sovereignty rules. Regulatory compliance, therefore, shapes geographical choices alongside economics, with firms distributing workloads so that personally identifiable data remains within certified provinces while still integrating into global product roadmaps.
Competitive Landscape
The China Global Capability Centers market comprises a moderately concentrated mix of global IT giants, specialized domestic vendors, and large corporate captives, which together control slightly more than 60% of the spend. Tata Consultancy Services, Infosys, and Wipro recalibrate portfolios toward data-sovereign SaaS customization and embedded analytics to stay relevant under stricter cross-border rules. IBM, SAP, and Hewlett Packard Enterprise leverage their product stacks to bundle cloud migration, AIOps, and security services into unified transformation programs that anchor long tenures.
Financial groups such as JPMorgan Chase and HSBC scale their technology and operations headcount to meet onshore reporting and risk analytics mandates, thereby carving out a share in the China Global Capability Centers market size dedicated to regulated sectors. Automotive and industrial leaders, including Bosch and Siemens, are expanding their embedded software labs to code next-generation electric-vehicle control units and digital twin platforms, thereby deepening vertical specialization that smaller rivals struggle to match.
Competitive differentiation now rests on three pillars: possession of accredited cybersecurity frameworks, such as ISO 27001, depth of local academic and start-up linkages that accelerate proof-of-concept cycles, and fluency in hybrid build-operate-transfer models that minimize early capital outlays. Providers that excel on all three metrics lock in multiyear master-service agreements, while laggards risk being relegated to staff-augmentation roles with thinner margins.
China Global Capability Centers Industry Leaders
Accenture plc
Tata Consultancy Services Limited
Cognizant Technology Solutions Corporation
Capgemini SE
IBM Corporation
- *Disclaimer: Major Players sorted in no particular order

Recent Industry Developments
- October 2025: Henkel completed its USD 70 million Shanghai innovation center, housing 500 scientists focused on advanced materials research.
- September 2025: Tesla injected an additional USD 200 million into its Shanghai R&D hub, adding 800 engineers working on autonomous driving algorithms and battery technologies.
- August 2025: BASF inaugurated a USD 150 million expansion of its Shanghai chemical R&D complex to develop sustainable chemistry processes.
- July 2025: Schneider Electric opened a USD 100 million software and automation R&D facility in Shanghai to serve Asian and global customers.


China Global Capability Centers Market Report Scope
The scope of the global capability center study for the market segmentation by the Function/Capability for (i) Information Technology (IT) and Digital Services segment is limited to Software Development, Cloud and Infrastructure Management, Cybersecurity, Data Analytics and AI/ML; (ii) Engineering / ER&D segment is limited to Product Design and Testing, Embedded Systems, Digital Twin / Simulation; (iii) Business Process Management (BPM) segment is limited to Finance and Accounting, HR, Payroll and Talent Management, Procurement, Customer Service; and (iv)Knowledge Process Outsourcing (KPO) segment is limited to Market Research and Insights, Risk and Compliance, Legal and Regulatory Support, Strategy and Consulting Support. Similarly, for segmentation by the Engagement Model, scope for (i) Hybrid Build-Operate-Transfer (BOT) is limited to Joint Venture / Strategic Partnership and Virtual Captive Model. The rest of the segment scope is as specified for the listed segment.
| Information Technology (IT) and Digital Services |
| Engineering / ER&D |
| Business Process Management (BPM) |
| Knowledge Process Outsourcing (KPO) |
| Captive (Self-Build) / In-house |
| Build-Operate-Transfer (BOT) |
| Hybrid Build-Operate-Transfer (BOT) |
| Large Enterprises |
| Small and Medium Enterprises (SMEs) |
| Banking, Financial Services, and Insurance (BFSI) |
| Telecom and IT |
| Healthcare and Life Sciences |
| Manufacturing, Automotive and Industrial |
| Retail and Consumer Goods |
| Other Industry Verticals |
| By Function / Capability | Information Technology (IT) and Digital Services |
| Engineering / ER&D | |
| Business Process Management (BPM) | |
| Knowledge Process Outsourcing (KPO) | |
| By Engagement Model | Captive (Self-Build) / In-house |
| Build-Operate-Transfer (BOT) | |
| Hybrid Build-Operate-Transfer (BOT) | |
| By Organization Size | Large Enterprises |
| Small and Medium Enterprises (SMEs) | |
| By Industry Vertical | Banking, Financial Services, and Insurance (BFSI) |
| Telecom and IT | |
| Healthcare and Life Sciences | |
| Manufacturing, Automotive and Industrial | |
| Retail and Consumer Goods | |
| Other Industry Verticals |


Key Questions Answered in the Report
What is the projected value of the China Global Capability Centers market by 2031?
The market is expected to reach USD 343.27 billion by 2031, growing at a 7.72% CAGR.
Which functional area currently leads spending inside Chinese capability centers?
Engineering and research services hold the top position, accounting for a 49.03% revenue share in 2025.
Why are hybrid build-operate-transfer models gaining traction?
Hybrid BOT models blend quick entry with eventual ownership transfer, offering operational flexibility amid shifting compliance rules and have reached a 8.79% forecast CAGR.
Which vertical is expanding fastest within Chinese Global Capability Centers?
Healthcare and life sciences functions are projected to grow at an 8.35% CAGR as pharma firms scale clinical and regulatory operations.
How are wage pressures affecting location strategy?
Rising salaries in Tier-1 cities are pushing new capacity toward Tier-2 hubs like Chengdu and Xi’an, where costs are 30-50% lower, yet talent quality remains high.
What role do government incentives play in Global Capability Center site selection?
National and provincial subsidy schemes can shave 15-25% off the total cost of ownership, making China a financially compelling host for new captive centers.
Page last updated on:


