
Cash Management Services Market Size and Share
Market Overview
| Study Period | 2020 - 2031 |
|---|---|
| Market Size (2026) | USD 28.05 Billion |
| Market Size (2031) | USD 35.65 Billion |
| Growth Rate (2026 - 2031) | 4.91 % |
| Fastest Growing Market | Asia-Pacific |
| Largest Market | North America |
| Market Concentration | Medium |
Major Players *Disclaimer: Major Players sorted in no particular order Image © Mordor Intelligence. Reuse requires attribution under CC BY 4.0. | |
Cash Management Services Market Analysis by Mordor Intelligence
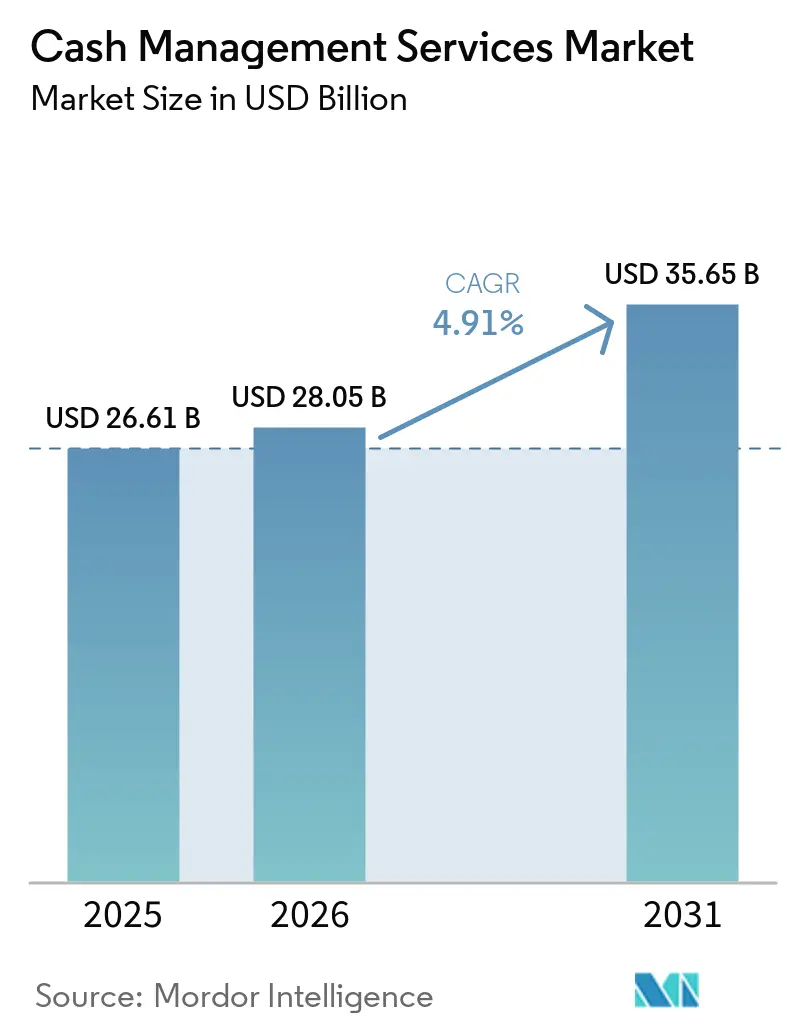
The Cash Management Services Market size is expected to grow from USD 26.61 billion in 2025 to USD 28.05 billion in 2026, and is forecast to reach USD 35.65 billion by 2031, at a 4.91% CAGR over 2026-2031. Demand is shifting from internally managed cash operations toward contracted services that combine collection, processing, reconciliation, and liquidity visibility. Banks, organized retailers, and public agencies are placing greater value on dependable cash availability, controlled custody, and clear responsibility for operational risk. Digital payments are expanding alongside physical currency use in several emerging economies, which sustains the need for cash logistics rather than replacing it outright. Providers are responding with longer managed-service agreements, subscription-based smart-safe programs, and software tools that improve route planning and cash forecasting. The cash management services market, therefore, favors operators that can connect physical operations with reporting, technology, and accountable service delivery.
Key Report Takeaways
- By service type, cash collection and processing held 40.37% of the cash management services market share in 2025, while Smart Safe-as-a-Service is projected to expand at a 5.91% CAGR through 2031.
- By end-user industry, banking and financial institutions accounted for 46.29% of the cash management services market share in 2025, while government and public sector services are projected to expand at a 5.89% CAGR through 2031.
- By provider type, cash-in-transit companies held 72.43% share in 2025, while independent service vendors and technology providers are projected to expand at a 5.52% CAGR through 2031.
- Among cash-handling technologies, cash recycler ATMs accounted for a 33.43% share in 2025, while smart safes and cash deposit machines are projected to expand at a 5.68% CAGR through 2031.
- By cash volume band, sites processing above SAR 5 million per month held 47.71% share in 2025, while sites processing between SAR 1 million and SAR 5 million per month are projected to expand at a 5.47% CAGR through 2031.
- By geography, North America held 26.14% share in 2025, while Asia-Pacific is projected to expand at a 5.93% CAGR through 2031.
Note: Market size and forecast figures in this report are generated using Mordor Intelligence’s proprietary estimation framework, updated with the latest available data and insights as of January 2026.
Global Cash Management Services Market Trends and Insights
Drivers Impact Analysis*
| Driver | (~) % Impact on CAGR Forecast | Geographic Relevance | Impact Timeline |
|---|---|---|---|
| Bank and Retail Cash-Handling Outsourcing | +1.5% | Global, concentrated in North America, Europe, and South Asia | Short term (≤ 2 years) |
| Cash Circulation Resilience in Emerging Markets | +1.0% | Asia-Pacific, Middle East and Africa, South America | Medium term (2-4 years) |
| Smart Safe and Cash-Recycling Adoption | +0.7% | North America, Europe, Asia-Pacific core, with expansion into Middle East and Africa | Medium term (2-4 years) |
| ATM Network Optimization and Managed Services | +0.5% | Global, with early gains in North America and South Asia | Short term (≤ 2 years) |
| AI-Enabled Cash Forecasting and Route Optimization | +0.4% | Global, with early deployment in North America, Germany, and India | Long term (≥ 4 years) |
| Same-Day Value and Real-Time Cash Visibility | +0.3% | North America and the European Union | Medium term (2-4 years) |
| Source: Mordor Intelligence | |||
Bank and Retail Cash-Handling Outsourcing
Outsourcing has become a longer-term operating choice for banks and organized retailers that want specialist support for cash operations. The change is widening contracts beyond transportation to include ATM management, cash processing, reporting, and service-level commitments. CMS Info Systems began a 10-year integrated cash solutions contract for approximately 5,000 State Bank of India ATMs in January 2026. The contract value was INR 1,000 crore (USD 119 million), marking the company's first direct, large-scale public-sector bank outsourcing award. CMS Info Systems also shifted more of its FY26 business toward fixed-fee contracts, reducing reliance on transaction volumes while offering banks planned uptime and cash availability.[1]CMS Info Systems Limited, “Q4 and FY26 Investor Deck,” CMS, cms.com.
Brink's announced an agreement to acquire NCR Atleos for USD 6.6 billion in February 2026. The proposed combination would bring cash logistics together with a global ATM installed base and an ATM-as-a-Service platform. This approach shows why the cash management services market is moving toward bundled contracts with operational and technology components. In the cash management services market, these arrangements can provide customers with a single provider for service continuity, accountability, and cash visibility. They can also give providers more stable revenue than individual pickup assignments. The opportunity is strongest for operators that can manage liability while supporting large, distributed client networks.
Cash Circulation Resilience in Emerging Markets
In the cash management services market, digital payments and cash use continued to expand simultaneously across several emerging economies. In India, currency in circulation maintained a year-over-year growth trajectory, even as UPI transaction values continued to reach new monthly highs. This trend highlights the continued importance of cash in the economy despite the rapid adoption of digital payment methods. As a result, cash collection, distribution, verification, sorting, and replenishment services remain essential for banks, financial institutions, retailers, and other merchants. The coexistence of cash and digital payments also makes cash demand patterns more complex and difficult to predict across rural, semi-urban, and urban locations.
The Reserve Bank of India produces 28-30 billion banknotes each year across 6 denominations. India had 176 billion notes in circulation, which creates a large recurring requirement for secure movement and processing. Prosegur Cash recorded 21.7% organic revenue expansion in Asia-Pacific during 2025, its strongest regional outcome. Its Transformation Products revenue in the region increased 53.9%, supported by provisional credit and cash automation services. The cash management services market has room for well-capitalized providers that can make lower-density routes viable through effective route planning and scalable operating models.
Smart Safe and Cash-Recycling Adoption
Smart Safe-as-a-Service changes cash handling by moving hardware ownership and maintenance from customers to service providers. In the cash management services market, the model combines secure deposit equipment, provisional credit, reporting, and collection under an ongoing service agreement. Sesami connected smart safes at 2,550 Casey's General Stores locations into a common visibility network. The program saved the retailer more than USD 12 million annually by reducing unnecessary cash-in-transit collections and idle balances. This type of offering supports retailer cash availability while reducing the number of physical interventions required at each site.
Public agencies are also using procurement to formalize requirements for smart safe deployment and real-time reporting. The New Hampshire Liquor Commission issued a January 2026 request for proposals covering smart safe systems and armored car services for 65 stores under a 5-year contract. The cash management services market can benefit as agencies require clear custody records and reliable deposit reconciliation. Some deployments still depend on favorable commercial conditions rather than policy support. Radiant Cash Management Services reported margin pressure after India’s PIDF subsidies for point-of-sale deployment ended in December 2025. The result indicates that subscription programs need durable customer value after incentives expire.
ATM Network Optimization and Managed Services
The cash management services market is seeing ATM managed services move beyond scheduled replenishment toward demand-led cash planning and service monitoring. CMS Info Systems applied machine learning route optimization across its fleet between September 2025 and March 2026. The company reported a 10% reduction in servicing costs within 6 months. The result supports the use of routing tools when fixed schedules lead to unnecessary visits. It also supports contracts that measure service quality and cash availability rather than vehicle activity alone.
Diebold Nixdorf reported 12% year-over-year revenue expansion in the fourth quarter of 2025. The company raised its full-year 2026 revenue guidance to USD 3.86 billion to USD 3.94 billion after customer wins, including the replacement of a competitor’s teller cash recycler fleet at a large US financial institution. FOREX began using Diebold Nixdorf’s SMART Managed Services in April 2026 for ATM uptime optimization and security compliance. These programs show how technology providers can participate directly in ongoing operating contracts. They also make data quality and uptime performance more important parts of the service offer.
Restraints Impact Analysis*
| Restraint | (~) % Impact on CAGR Forecast | Geographic Relevance | Impact Timeline |
|---|---|---|---|
| Structural Decline in Cash Usage in Mature Economies | -1.5% | North America, Western Europe, including the United Kingdom, Germany, and France | Short term (≤ 2 years) |
| High Insurance, Security, and Fleet Operating Costs | -0.9% | Global, with the sharpest pressure in North America and Europe | Short term (≤ 2 years) |
| Regulatory and Liability Burden for Physical Cash Movement | -0.6% | Global, with complexity concentrated in the European Union and North America | Medium term (2-4 years) |
| Fragmented Data Standards Across Banks, Retailers, and Service Providers | -0.4% | Global, with early progress in North America and the European Union | Long term (≥ 4 years) |
| Source: Mordor Intelligence | |||
Structural Decline in Cash Usage in Mature Economies
Lower cash transaction frequency in mature economies reduces demand for traditional cash-in-transit routes. Bank branch consolidation also reduces the number of locations requiring regular collection, replenishment, or vault services. This pressure is most visible where digital payment adoption is high, and cash volumes per stop are declining. Providers in these areas face a more difficult route-density equation. They also face more customer pressure on pricing when clients have fewer physical locations to support.
In the cash management services market, the restraint does not eliminate the need for cash services; it shifts where value is created. Cash management services market providers can reduce their exposure to individual-trip billing by offering cash-under-management and subscription arrangements. They can also combine cash services with ATM management, automation, and reporting. This helps preserve revenue as pickup frequency declines. The cash management services market remains exposed when traditional route economics do not support the fleet and security resources required. Operators with diversified service portfolios are better placed to maintain customer relevance in lower-volume environments.
High Insurance, Security, and Fleet Operating Costs
Cash movement requires specialized vehicles, trained personnel, insurance coverage, security systems, and maintenance. These costs can remain fixed even when collections decline or route density weakens. The resulting pressure is strongest for smaller operators without the ability to spread fleet costs across a broad client base. Higher procurement and insurance costs also make vehicle replacement decisions more difficult. Service providers must therefore balance reliability, capital needs, and customer pricing with care.
The AGS Transact Technologies disruption in India demonstrated the risk that can emerge when financial pressure affects a large managed ATM operation. CRISIL and India Ratings downgraded the company’s long-term bank facilities to D in December 2024 after debt-service delays and operating disruptions. The company managed 32,151 ATMs, and the episode prompted banks to review their relationships with alternative service providers. The cash management services market requires financially sound providers because customers rely on uninterrupted access to physical cash. Strong balance sheets and disciplined contracts can be as important as technology when fleet expenses are elevated.
*Our forecasts treat driver/restraint impacts as directional, not additive. The impact forecasts reflect baseline growth, mix effects, and variable interactions.
Segment Analysis
By Service Type: Smart Safe Contracts Outpace Traditional Collection Revenue
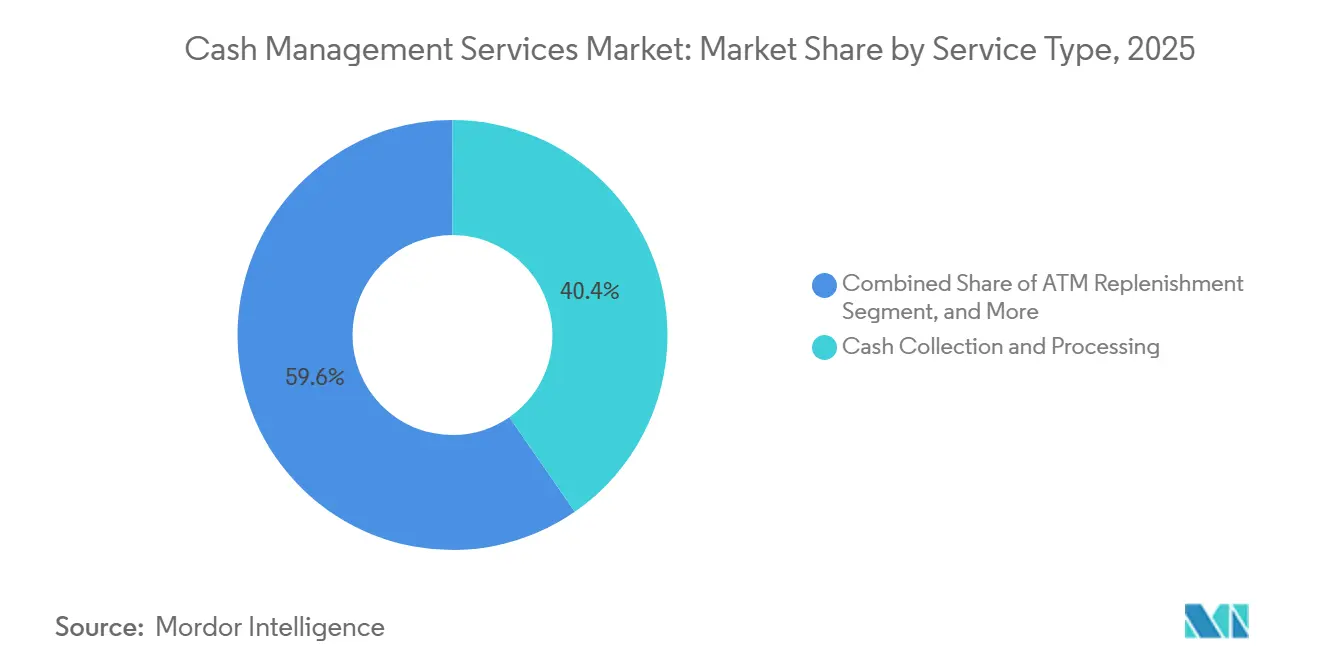
Cash collection and processing held 40.37% of global demand in 2025. Its position reflected recurring reconciliation needs at bank branches, supermarkets, and fuel retail sites. These customers require secure collection, verification, transport, and deposit handling. The segment’s scale depends on recurring operating volume rather than on price alone. Cash management services market providers compete on route density, processing accuracy, custody controls, and the speed of bank credit. ATM replenishment and cash supply to bank branches remain important where banks operate extensive ATM and branch networks.
Smart Safe-as-a-Service is projected to expand at a 5.91% CAGR from 2026 to 2031. The cash management services market size for this service is supported by a subscription model that replaces customer-owned equipment with ongoing managed support. The model can provide real-time cash visibility and provisional credit before physical collection occurs. Sesami’s Casey's deployment showed how a connected smart safe network can reduce idle balances and unnecessary collections. Maintenance and managed services also benefit, as banks prefer defined uptime commitments to maintaining all ATM engineering capabilities internally. The service mix increasingly rewards providers that combine reliable field operations with useful data and clear performance reporting.



By End-User Industry: Financial Institutions Anchor Demand As Governments Scale Up
Banking and financial institutions accounted for 46.29% of demand in 2025. Their position reflected ATM networks, vault requirements, and complex cash supply chains. Large banking contracts often involve specialized operational controls and multi-year service commitments. These characteristics can make supplier changes more difficult once a program is fully deployed. CMS Info Systems’ 10-year contract for approximately 5,000 State Bank of India ATMs illustrates the extended commitments that can arise from outsourced cash operations.
Government and public sector services are projected to expand at a 5.89% CAGR through 2031. Public agencies handle cash through tax collection, transit operations, state-owned retail, and local service locations. The New Hampshire Liquor Commission’s 2026 procurement required smart safe systems, armored transport, and real-time cash-status reporting for 65 stores. Organized retail remains an important customer group because it seeks lower cash shrinkage and fewer collection visits. Hospitality demand is more seasonal and is concentrated around tourist locations across Europe, the Middle East, and Southeast Asia. Fuel retailers and industrial parks also handle substantial daily cash volumes in locations with less developed payment infrastructure.
By Provider Type: Technology Providers Extend The Traditional Cash Service Model
Cash-in-transit companies held 72.43% of global demand in 2025. Their leadership was built on armored fleets, liability ownership, security processes, and approvals across operating jurisdictions. Central bank requirements and anti-money-laundering controls create barriers for new providers that want to move physical currency. These providers also have established field networks and customer relationships that support national coverage. Commercial banks are increasingly purchasing outsourced services rather than maintaining all cash operations themselves. This supports continuing demand for operators that can take responsibility across the cash chain.
Independent service vendors and technology providers are projected to expand at a 5.52% CAGR through 2031. They generally add software, analytics, and automation to existing physical cash processes rather than eliminating the need for cash-in-transit operations. CMS Info Systems increased technology and payment solutions from 7% to 16% of FY26 revenue. The company also improved its managed-services position from rank 5 to rank 3. This model shows how physical logistics and technology can function as interconnected parts of a single service offering. Providers that can cover both operations and data needs can address customer demand for accountability, visibility, and dependable service performance.
By Cash Handling Technology: Recycler ATMs Lead While Smart Safes Gain Ground
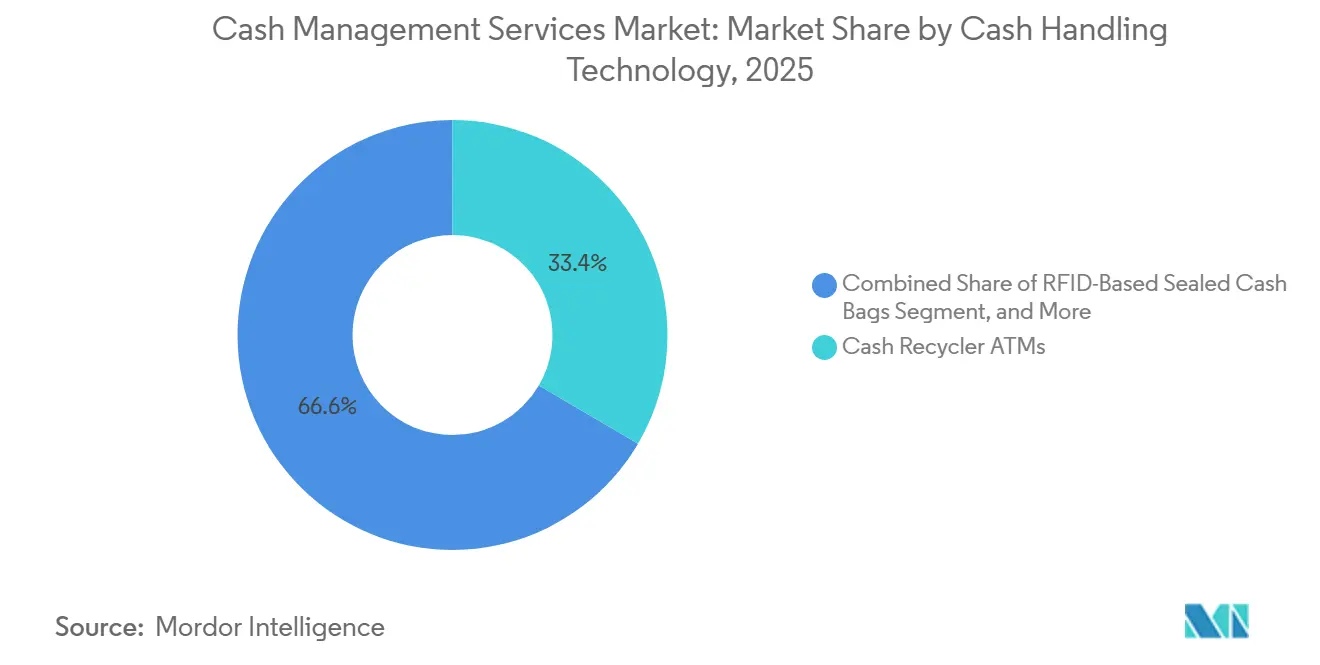
Cash recycler ATMs accounted for 33.43% of global demand in 2025. Their installed base is extensive across bank branches and retail ATM networks. The machines accept, validate, store, and dispense notes, thereby reducing replenishment needs for active locations. Their value is strongest for institutions that need both deposit and dispensing capacity. JN Bank deployed Diebold Nixdorf DN Series 200V cash recyclers in Jamaica as part of a 2025-2026 rollout. The project made 60% of its 144-unit ATM network smart within 5 months.
Smart safes and cash deposit machines are projected to expand at a 5.68% CAGR through 2031. This technology group benefits from closed-loop custody from a store deposit through to bank credit. Banknote sorters and validators remain important in central banks and large processing centers for assessing note fitness and tracking serial numbers. RFID-based sealed cash bags can support tamper-evident transfers between retailers and cash-in-transit providers. Giesecke+Devrient reported EUR 3.6 billion (USD 3.89 billion) in order intake during 2025. The result was 8% higher than the prior year and reflected continuing demand for currency technology and cash-cycle software.
By Cash Volume Band: Large Sites Lead While Mid-Volume Locations Expand
Sites processing above SAR 5 million per month held 47.71% of demand in 2025. These locations include major bank branches, large retail chains, and petrochemical facilities with concentrated cash flows. Their volumes can support dedicated armored schedules and detailed service-level agreements. Disruption at these sites can have immediate operational and customer consequences. This helps explain why large sites often require consistent collection and processing capacity. Their operating importance also supports multi-year contracts for established cash management providers.
Sites processing between SAR 1 million and SAR 5 million per month are projected to expand at a 5.47% CAGR through 2031. Smart safe subscriptions and scheduled pickup programs make professional cash management more accessible for mid-sized retailers, hospitality sites, and public offices. Lower-volume sites processing below SAR 1 million per month remain more fragmented and often need shared routes or compact smart safe equipment. The cash management services market benefits when operators develop enough corridor density to serve sites of different volumes on the same route. This can improve vehicle use while supporting a wider customer base. The SAR thresholds reflect an operating framework used particularly in Gulf Cooperation Council markets.
Geography Analysis
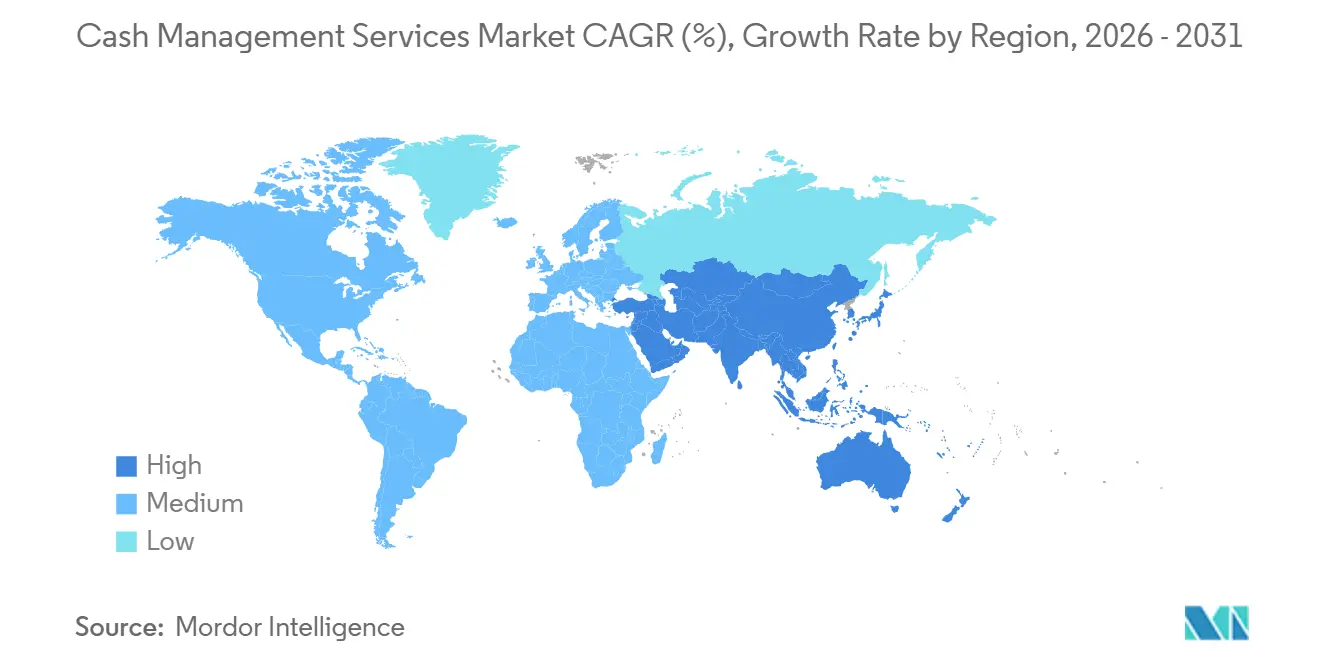
North America held 26.14% of global demand in 2025. The region’s position rests on extensive ATM networks, organized retail density, and mature outsourced vault and cash-in-transit services. Digital payment use and branch consolidation are placing pressure on conventional cash routes. At the same time, customers still require secure ATM replenishment, cash processing, and accountable service continuity. Brink's announced its planned acquisition of NCR Atleos for USD 6.6 billion in February 2026. The proposal would combine cash-handling operations with ATM servicing, owned ATMs, and ATM-as-a-Service capabilities.
South America is a key location for provider expansion where cash remains important in retail payments. Loomis announced a tender offer for Hermes Transportes Blindados in Peru in May 2026. The transaction had an enterprise value of SEK 4 billion (USD 381 million), and involved a company with a 50% market share in Peru and 3,200 employees. Loomis also agreed to acquire Transportadora del Interior in Argentina for SEK 180 million (USD 17 million).[2]Loomis AB, “Loomis Interim Report January-March 2026,” Loomis AB, loomis.com. Europe has a mixed outlook, with highly digital Nordic markets alongside cash-intensive Southern and Eastern European economies. Prosegur Cash recorded 1.5% organic revenue growth in Europe in 2025, while Transformation Products accounted for 33% of European sales.
Asia-Pacific is projected to expand at a 5.93% CAGR from 2026 to 2031. Regional demand is supported by large currency volumes and changing patterns across India and Southeast Asia. India’s physical currency volumes remain high even as digital payments continue to rise. CMS Info Systems reduced servicing costs by 10% within 6 months through machine-learning-based route optimization. Japan supports mature cash-recycling and cash-in-transit contracts because of its ATM density. South Korea and ASEAN countries, including Thailand, Vietnam, and Indonesia, are increasing the adoption of smart safes as organized retail develops. The Middle East and Africa are supported by strong cash flows from retail, hospitality, and petrochemicals in Gulf Cooperation Council countries, while fragmented infrastructure in South Africa and Nigeria supports longer-term service and automation opportunities.

Competitive Landscape
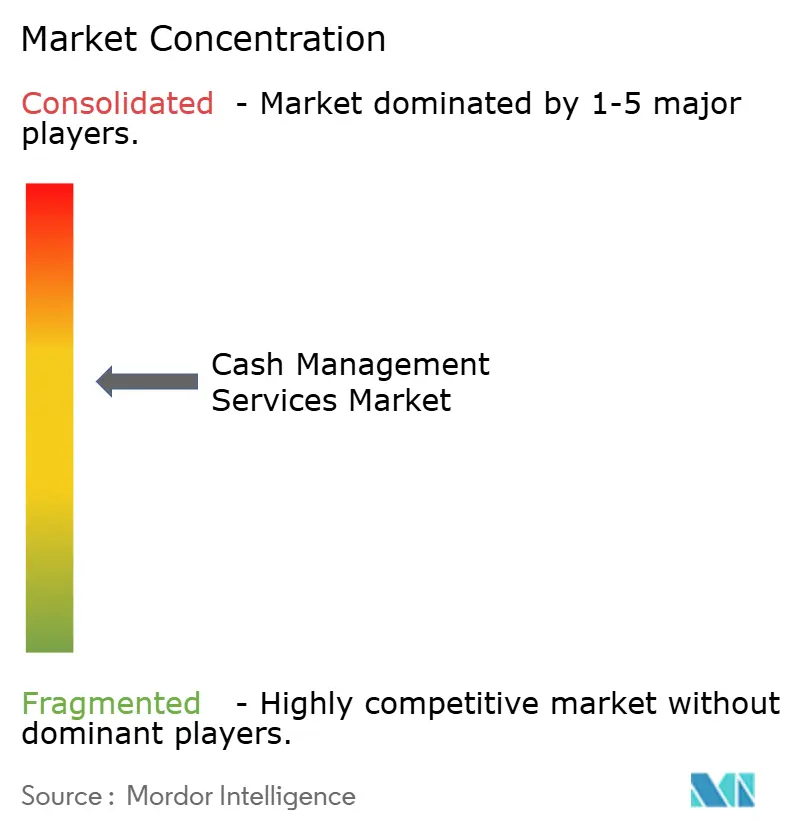
The cash management services market is moderately concentrated, with Brink's, Loomis, GardaWorld, and Prosegur Cash among the leading cash-in-transit operators. Cash-in-transit companies accounted for 72.43% of provider demand in 2025, underscoring the importance of established fleet and security capabilities. Brink's agreed in February 2026 to acquire NCR Atleos for USD 6.6 billion. The proposed transaction targets USD 200 million in annual run-rate cost synergies within 3 years after the expected first-quarter 2027 closing.[3]The Brink’s Company, “Brink’s to Acquire NCR Atleos for USD 6.6 Billion,” The Brink’s Company, investors.brinks.com. The strategy connects physical logistics with a large installed ATM base and managed ATM services. It reflects the continuing move toward broader managed-service contracts.
Loomis is expanding its footprint in South America through the planned acquisition of Hermes in Peru and the acquisition of Transportadora del Interior in Argentina. GardaWorld developed the Sesami platform to connect smart safes, armored pickups, analytics, and cash forecasting into a single service offering. Prosegur Cash reported EUR 700 million (USD 756 million) in Transformation Products sales in 2025. This accounted for more than 35% of total sales, while its Asia-Pacific operation recorded 21.7% organic revenue growth. These companies are increasing their exposure to services that provide cash visibility, automation, and ongoing customer support.
Technology providers are also becoming more relevant in the cash management services market. Diebold Nixdorf expanded its Branch Automation Solutions offering and began an end-to-end ATM management deployment with FOREX in April 2026. CMS Info Systems acquired Financial Software and Systems’ ATM managed-services business for INR 115 crore (USD 14 million) in March 2026. The transaction increased its managed ATM portfolio from 31,000 to 39,000 units. Regulatory approvals, anti-money-laundering controls, and central bank licensing remain meaningful barriers for cross-border physical cash movement. Mid-volume retailers, regional governments, and hospitality chains remain important customers for technology-led subscription models.
Cash Management Services Industry Leaders
The Brink’s Company
Loomis AB
GardaWorld Cash Services
Prosegur Cash
CMS Info Systems Ltd.
- *Disclaimer: Major Players sorted in no particular order

Recent Industry Developments
- August 2026: Brink's reported strong Q2 2026 results with year-over-year revenue expansion across every segment and trailing-12-month free cash flow of USD 468 million, reflecting 46% conversion. The company retained its full-year 2026 framework for mid-single-digit organic revenue expansion and 30-50 basis points of EBITDA margin expansion. Its integration management team continued planning toward the expected Q1 2027 closing of the NCR Atleos acquisition.
- June 2026: Shareholders of both Brink's and NCR Atleos approved the USD 6.6 billion acquisition at special meetings on June 30, 2026. The transaction included USD 2.2 billion in cash, 13.3 million Brink's shares, and the assumption of USD 2.6 billion in NCR Atleos debt. The combination represents a major consolidation within global cash management services.
- May 2026: Loomis entered Peru by announcing a public tender offer for Hermes Transportes Blindados, the cash management leader with 50% Peruvian market share. The transaction had an enterprise value of SEK 4 billion, equivalent to USD 381 million, and a 6.6x adjusted EBITDA multiple. It was Loomis’ largest acquisition and was expected to close in Q3 2026.
- April 2026: Diebold Nixdorf announced that FOREX, a Nordic travel money and foreign exchange company, began using its Branch Automation Solutions platform. The deployment covered end-to-end ATM network management and AI-driven uptime optimization through the Vynamic software suite.


Global Cash Management Services Market Report Scope
The Cash Management Services Market comprises the global market for outsourced and technology-enabled services that facilitate the secure handling, collection, processing, replenishment, transportation, reconciliation, and management of physical cash across businesses and financial institutions. These services are designed to improve cash availability, reduce cash-handling costs and risks, enhance operational efficiency, and provide greater visibility and control over cash flows across distributed locations.
The Cash Management Services Market Report is Segmented by Service Type (ATM Replenishment, Cash Collection and Processing, Cash Supply to Bank Branches, Maintenance and Managed Services, and Smart Safe-as-a-Service), End-User Industry (Retail - Organised, BFSI, Government and Public Sector, and Petrochemicals and Industrial Parks), Provider Type (Commercial Banks, Cash-in-Transit Companies, and Independent Service Vendors / Technology Providers), Cash Handling Technology (Cash Recycler ATMs, Smart Safes and Cash Deposit Machines, Banknote Sorters and Validators, and RFID-Based Sealed Cash Bags), Cash Volume Band (High-Volume Sites, Mid-Volume Sites, and Low-Volume Sites), and Geography (North America, South America, Europe, Asia-Pacific, and Middle East and Africa). The Market Forecasts are Provided in Terms of Value (USD).
| ATM Replenishment |
| Cash Collection and Processing |
| Cash Supply to Bank Branches |
| Maintenance and Managed Services |
| Smart Safe-as-a-Service |
| Retail - Organised |
| BFSI |
| Hospitality |
| Government and Public Sector |
| Petrochemicals and Industrial Parks |
| Commercial Banks |
| Cash-in-Transit Companies |
| Independent Service Vendors / Technology Providers |
| Cash Recycler ATMs |
| Smart Safes and Cash Deposit Machines |
| Banknote Sorters and Validators |
| RFID-Based Sealed Cash Bags |
| High-Volume Sites |
| Mid-Volume Sites |
| Low-Volume Sites |
| North America | United States | |
| Canada | ||
| Mexico | ||
| South America | Brazil | |
| Argentina | ||
| Rest of South America | ||
| Europe | Germany | |
| United Kingdom | ||
| France | ||
| Italy | ||
| Spain | ||
| Rest of Europe | ||
| Asia-Pacific | China | |
| Japan | ||
| India | ||
| South Korea | ||
| ASEAN | ||
| Rest of Asia-Pacific | ||
| Middle East and Africa | Middle East | Saudi Arabia |
| United Arab Emirates | ||
| Rest of the Middle East | ||
| Africa | South Africa | |
| Nigeria | ||
| Rest of Africa | ||
| By Service Type | ATM Replenishment | ||
| Cash Collection and Processing | |||
| Cash Supply to Bank Branches | |||
| Maintenance and Managed Services | |||
| Smart Safe-as-a-Service | |||
| By End-User Industry | Retail - Organised | ||
| BFSI | |||
| Hospitality | |||
| Government and Public Sector | |||
| Petrochemicals and Industrial Parks | |||
| By Provider Type | Commercial Banks | ||
| Cash-in-Transit Companies | |||
| Independent Service Vendors / Technology Providers | |||
| By Cash Handling Technology | Cash Recycler ATMs | ||
| Smart Safes and Cash Deposit Machines | |||
| Banknote Sorters and Validators | |||
| RFID-Based Sealed Cash Bags | |||
| By Cash Volume Band | High-Volume Sites | ||
| Mid-Volume Sites | |||
| Low-Volume Sites | |||
| By Geography | North America | United States | |
| Canada | |||
| Mexico | |||
| South America | Brazil | ||
| Argentina | |||
| Rest of South America | |||
| Europe | Germany | ||
| United Kingdom | |||
| France | |||
| Italy | |||
| Spain | |||
| Rest of Europe | |||
| Asia-Pacific | China | ||
| Japan | |||
| India | |||
| South Korea | |||
| ASEAN | |||
| Rest of Asia-Pacific | |||
| Middle East and Africa | Middle East | Saudi Arabia | |
| United Arab Emirates | |||
| Rest of the Middle East | |||
| Africa | South Africa | ||
| Nigeria | |||
| Rest of Africa | |||


Key Questions Answered in the Report
What is the cash management services market size?
The cash management services market size is projected to be USD 28.05 billion in 2026 and is forecast to reach USD 35.65 billion by 2031 at a 4.91% CAGR.
Which service leads cash management services demand?
Cash collection and processing led service demand with a 40.37% share in 2025, supported by recurring cash reconciliation and custody needs.
Which end-user group has the largest demand for cash management services?
Banking and financial institutions held 46.29% of demand in 2025 because of their ATM networks, vault operations, and cash supply requirements.
What is driving Smart Safe-as-a-Service adoption?
Smart safe programs combine secure deposit, cash visibility, provisional credit, and managed collection, reducing idle balances and unnecessary visits.
Which region is expected to expand fastest through 2031?
Asia-Pacific is projected to expand at a 5.93% CAGR through 2031, supported by high cash circulation volumes and rising automation adoption.
Why are technology providers becoming more important in cash services?
They add analytics, route optimization, cash recyclers, smart safes, and managed ATM tools that improve uptime, cash visibility, and operating efficiency.
Page last updated on:


 Your data is secure and never sold or shared.


