Carbon Monoxide Market Size and Share
Market Overview
| Study Period | 2021 - 2031 |
|---|---|
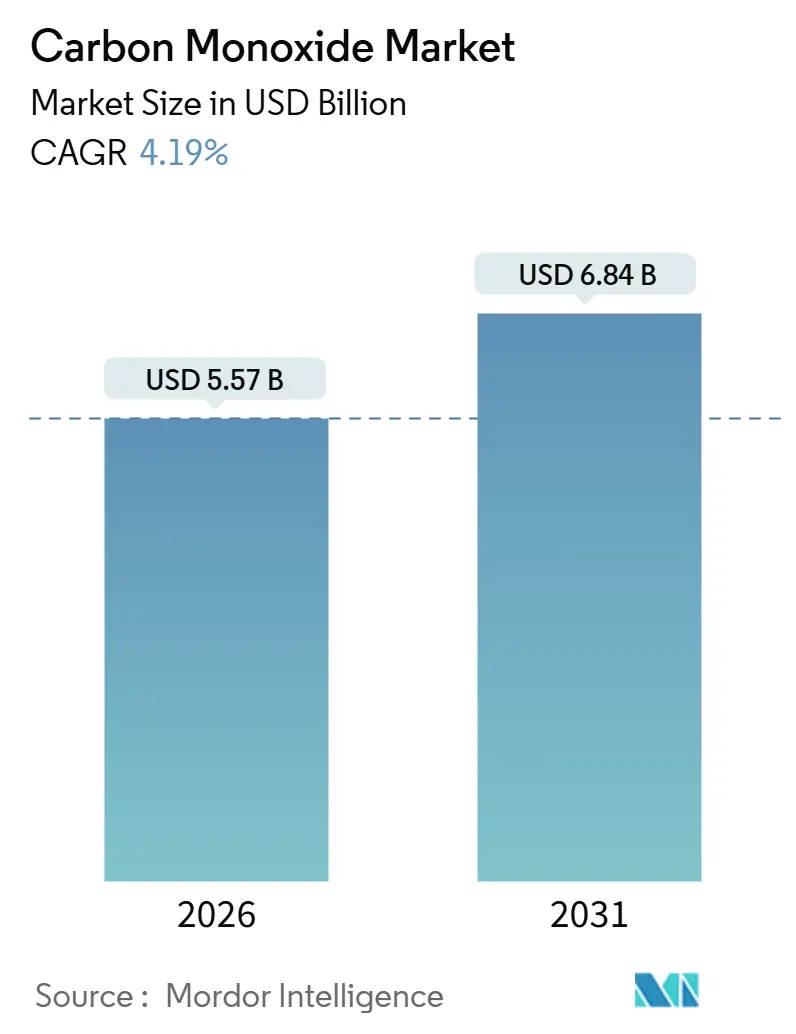
| Market Size (2026) | USD 5.57 Billion |
| Market Size (2031) | USD 6.84 Billion |
| Growth Rate (2026 - 2031) | 4.19% CAGR |
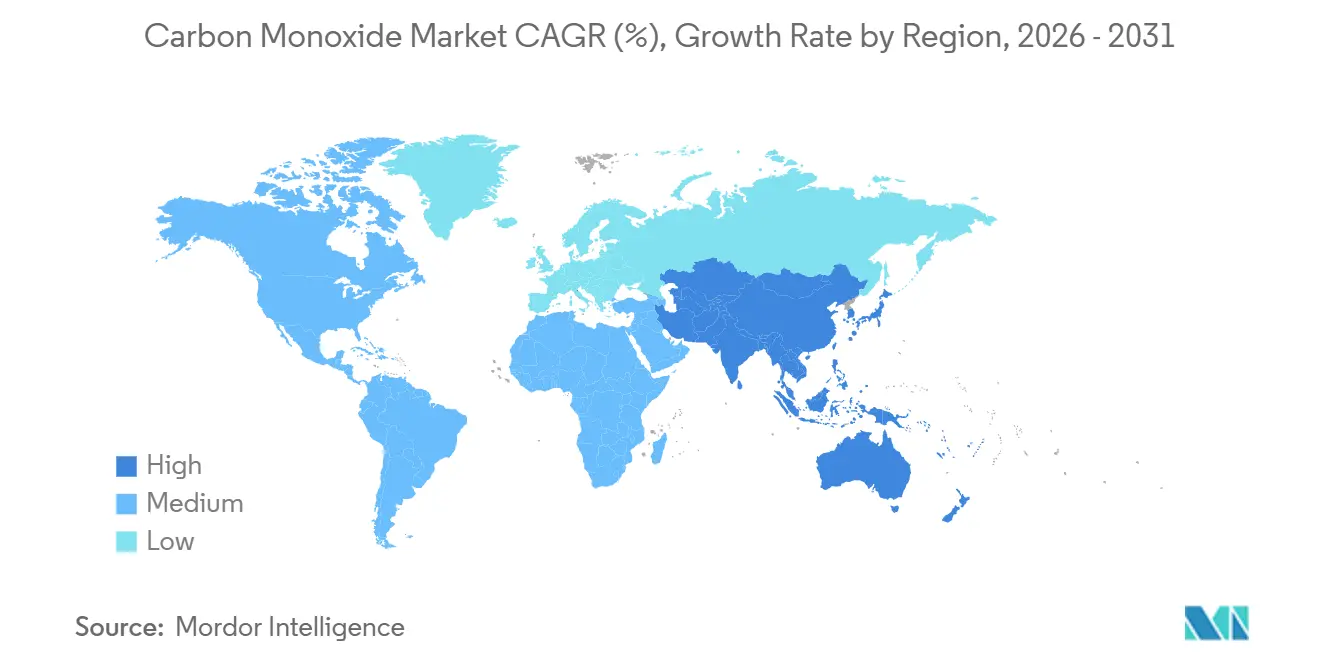
| Fastest Growing Market | Asia Pacific |
| Largest Market | Asia Pacific |
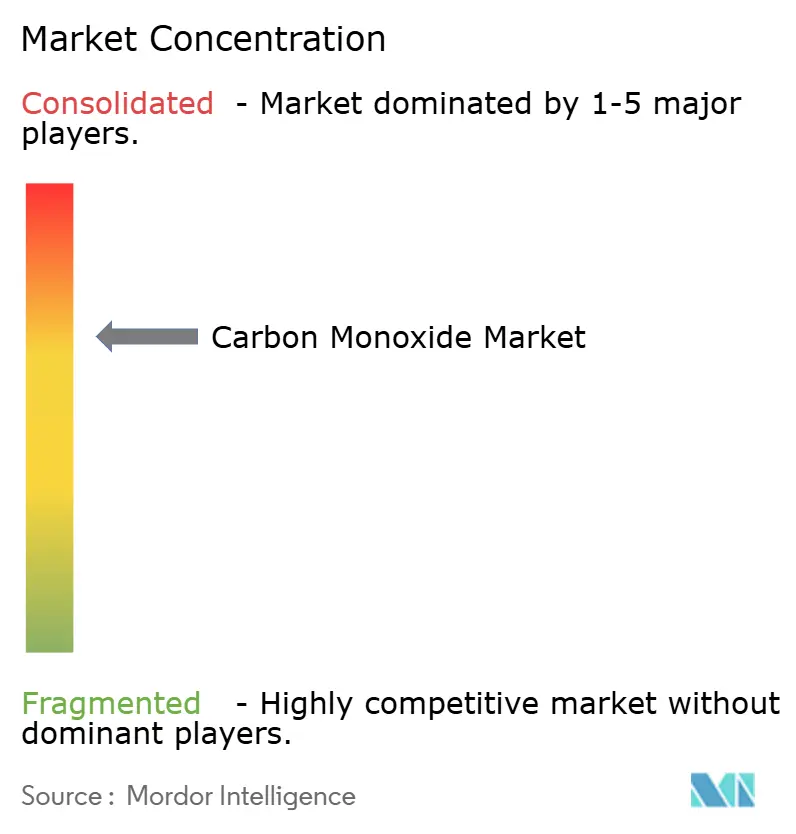
| Market Concentration | Medium |
Major Players *Disclaimer: Major Players sorted in no particular order Image © Mordor Intelligence. Reuse requires attribution under CC BY 4.0. | |
Carbon Monoxide Market Analysis by Mordor Intelligence
The Carbon Monoxide Market size is estimated at USD 5.57 billion in 2026, and is expected to reach USD 6.84 billion by 2031, at a CAGR of 4.19% during the forecast period (2026-2031). Demand stability reflects the gas’s dual role as an indispensable chemical feedstock and a high-temperature metallurgical reductant, while ongoing decarbonization policies reshape sourcing strategies and contract structures. Cost-advantaged shale gas keeps North American steam-methane-reforming (SMR) economics competitive, yet the European Union’s carbon-border-adjustment mechanism is pushing producers toward on-site electrolytic CO and carbon-capture retrofits. In Asia-Pacific, the convergence of Chinese methanol carbonylation capacity, India’s coal-based direct-reduced-iron expansion, and semiconductor fab projects across Japan, South Korea, and Taiwan secures the region’s role as the volume and growth leader. Moderate competitive intensity persists because regional feedstock spreads and the growth of captive syngas units prevent any single supplier from dictating prices. For buyers, the decisive question is no longer the molecule’s spot price, but rather long-term supply security, purity assurance, and embedded carbon footprint.
Key Report Takeaways
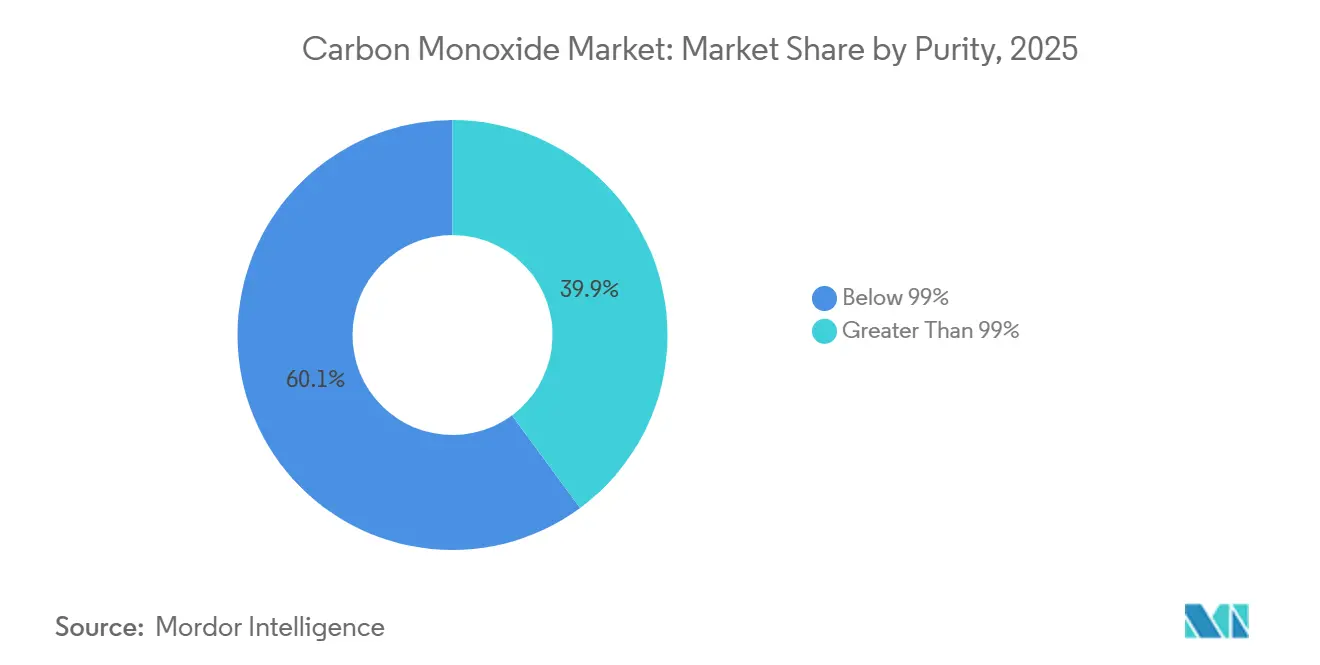
- By purity, the below-99% category captured 60.12% revenue share in 2025 and is forecast to expand at a 4.54% CAGR through 2031.
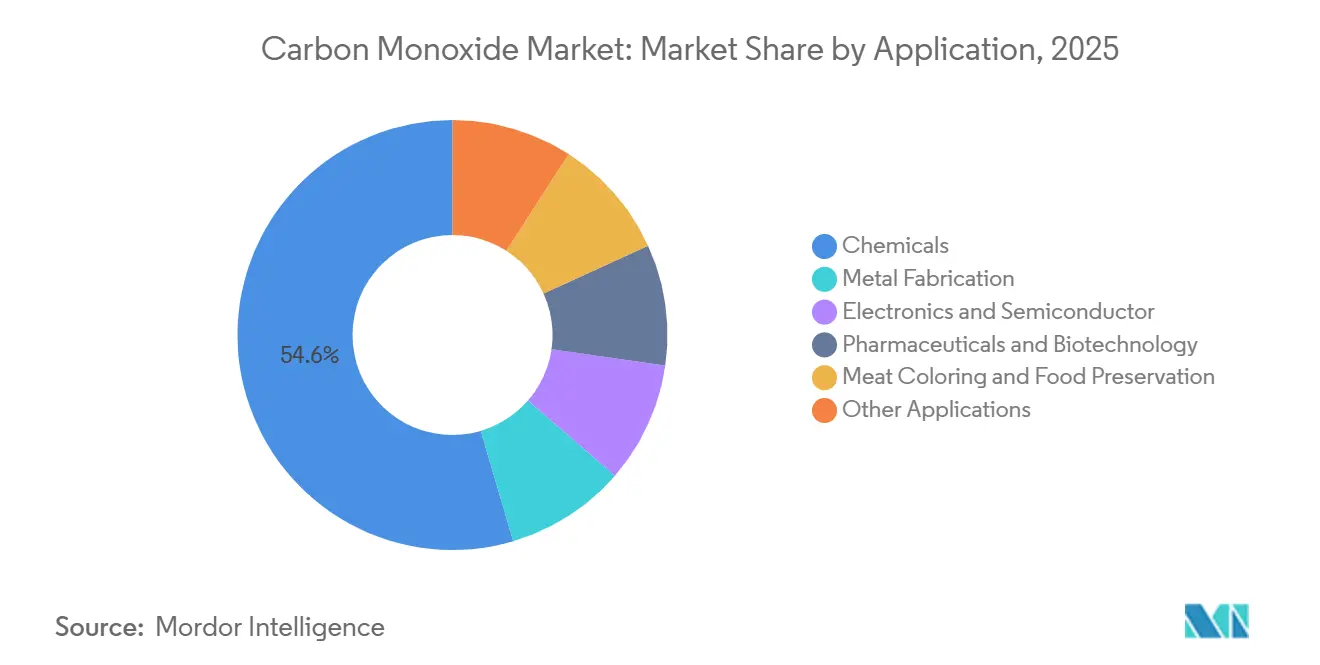
- By application, chemicals contributed 54.56% of 2025 revenue; electronics and semiconductor is poised for the fastest 4.90% CAGR to 2031.
- By geography, Asia-Pacific held 48.24% share of 2025 demand and is expected to compound at a 4.47% regional CAGR.
Note: Market size and forecast figures in this report are generated using Mordor Intelligence’s proprietary estimation framework, updated with the latest available data and insights as of January 2026.
Global Carbon Monoxide Market Trends and Insights
Drivers Impact Analysis*
| Drivers | (~) % Impact on CAGR Forecast | Geographic Relevance | Impact Timeline |
|---|---|---|---|
| Increasing demand for acetic acid and methanol feedstock | +1.2% | Global, concentrated in China and North America | Medium term (2–4 years) |
| Growth in metallurgical reduction for EV-battery metals | +0.8% | Asia-Pacific (Indonesia, Philippines, India) | Long term (≥ 4 years) |
| Expansion of high-purity CO usage in semiconductor fabs | +1.0% | East Asia (Taiwan, South Korea, Japan) | Short term (≤ 2 years) |
| Adoption of MAP meat packaging in emerging economies | +0.3% | Latin America, Middle East, Southeast Asia | Medium term (2–4 years) |
| On-site CO production technologies lowering logistics cost | +0.7% | Global, early adoption in North America and EU | Short term (≤ 2 years) |
| Source: Mordor Intelligence | |||
Increasing Demand for Acetic Acid and Methanol Feedstock
Most of the world's acetic acid production hinges on methanol carbonylation, a rhodium-catalyzed method achieving high selectivity. In Nanjing, China's latest complexes strategically co-locate methanol, CO, and downstream units. This setup not only allows producers to profit from the hydrogen co-product but also gives them an edge over merchant CO suppliers. Given that consistent operations demand uniform CO quality and pressure, acetic acid investors are now leaning towards integrated or on-site gas supply agreements, often locking in 10–20-year terms. Past missteps, like the Singapore Syngas shortfall two decades back, have underscored the importance of supply security over minor price advantages. Suppliers who can offer bundled services—encompassing on-site generation, purification, and maintenance—are reaping the rewards with extended contracts and higher profit margins.
Growth in Metallurgical Reduction for EV-Battery Metals
In India, carbon monoxide plays a pivotal role as the primary reductant in the coal-based direct-reduced-iron route, which is projected to expand significantly by 2030. Concurrently, nickel laterite ores, vital for lithium-ion batteries, are being treated with CO at temperatures between 900–1,000 °C[1]Chemical Engineering Journal, “Methanol Carbonylation to Acetic Acid,” sciencedirect.com. This process extracts nickel from high-pressure-acid-leach residues, presenting a thermally self-sustaining alternative to hydrogen reduction. Both Indonesia and the Philippines have unveiled refinery projects centered on CO-rich syngas, hinting at a potential incremental demand by the decade's close. Meanwhile, industrial-gas giants are forging tolling agreements encompassing gas supply, oxygen, and monitoring services, thereby positioning themselves strategically within the battery-metal value chain.
Expansion of High-Purity CO Usage in Semiconductor Fabs
To prevent particulate and metallic contamination, manufacturing steps for sub-3 nm logic and greater than 200-layer 3D NAND require Grade 5.0 CO (greater than 99.999% purity). Foundries in Taiwan, South Korea, and Japan are now opting for captive or on-site CO plants. This shift aims to eliminate cylinder change-outs and reduce Scope 1 emissions. This trend is underscored by Air Liquide’s significant investments in Dresden and Singapore in 2025. Topsoe’s eCOs solid-oxide electrolysis cell offers a solution by converting captured CO₂ into 99.995% pure CO. This innovation allows fabs to align with Corporate Sustainability Reporting Directive targets, all without the need for tanker deliveries. As the industry transitions from 5 nm to 3 nm nodes, CO consumption per 300 mm wafer increases, highlighting the demand's sensitivity to technology migration rates.
Adoption of MAP Meat Packaging in Emerging Economies
Modified-atmosphere packaging, which combines CO with CO₂ and N₂, stabilizes carboxymyoglobin. This process keeps beef and poultry looking bright red for an extra 7–10 days at 4 °C[2]European Commission, “Opinion on the Use of Carbon Monoxide in MAP,” ec.europa.eu. Latin American exporters adopted CO-MAP to maintain the visual appeal of meat during trans-Pacific shipments. Furthermore, with recent approvals in India, Indonesia, and Thailand, domestic markets have opened up. While the European Union has prohibited this method due to concerns over consumer deception, scientific evaluations indicate no toxicological risks below 0.5% CO, provided the cold-chain integrity is upheld. If a significant importer were to echo the EU's position, demand could swiftly diminish, highlighting the regulatory vulnerability of this application.
Restraints Impact Analysis*
| Restraints | (~) % Impact on CAGR Forecast | Geographic Relevance | Impact Timeline |
|---|---|---|---|
| Tightening workplace CO exposure regulations | -0.5% | Global, most acute in EU and North America | Short term (≤ 2 years) |
| Volatile synthesis-gas feedstock prices | -0.4% | Global, highest impact in Asia-Pacific | Medium term (2–4 years) |
| Limited pipeline infrastructure and high transport hazards | -0.3% | Emerging markets (Latin America, MEA, South Asia) | Long term (≥ 4 years) |
| Source: Mordor Intelligence | |||
Tightening Workplace CO Exposure Regulations
OSHA's permissible exposure limit of 50 ppm now aligns with ACGIH's more stringent 25 ppm threshold. This shift has prompted numerous plants in the U.S. and EU to integrate real-time electrochemical sensors and bolster their ventilation systems. In India, DRI operators, who once operated with alarm thresholds between 30-50 ppm, are now retrofitting their furnaces to achieve levels below 5 ppm, following a safety review in 2024. Compliance costs are particularly straining for facilities relying on older equipment. In a bid to reduce their liability, gas suppliers are introducing packages that encompass closed-loop delivery, on-site generation, and continuous monitoring. However, these enhanced services come at a premium, with suppliers charging higher fees to offset their increased responsibilities.
Volatile Synthesis-Gas Feedstock Prices
In 2024-2025, Henry Hub spot gas prices swung due to LNG exports and weather variations. Given that feedstock constitutes a significant portion of the production cost for SMR CO, price shifts translate to increased costs, thereby squeezing gross margins on fixed-price contracts. In 2024, Chinese coal-gasification plants grappled with a surge in feedstock prices, a consequence of mine-safety shutdowns. This prompted some acetic-acid producers to halt operations and resort to importing merchant CO, even with the added burden of elevated freight charges. While major industrial-gas corporations mitigate such price fluctuations through monthly energy-surcharge clauses, regional independent firms frequently find themselves without this advantage, causing them to postpone expansion initiatives until market prices show signs of stabilization.
*Our forecasts treat driver/restraint impacts as directional, not additive. The impact forecasts reflect baseline growth, mix effects, and variable interactions.
Segment Analysis
By Purity: Bulk Syngas Dominates Below-99% Consumption
In 2025, steel mills, chemical complexes, and gasification units captured a 60.12% share of sales and 4.54% CAGR till 2031, from CO streams with less than 99% purity, as they can accept limited CO₂ and N₂ impurities without compromising reaction yields. In India, coal-based DRI furnaces consume CO annually, utilizing syngas blends consisting of CO, H₂, and the remainder being CO₂ and N₂. On the other hand, while grades exceeding 99% are produced in smaller tonnages, they fetch higher margins. This is because applications like semiconductor etching, pharmaceutical carbonylation, and phosgene synthesis are sensitive to even trace contaminants. For sub-3 nm logic, Grade 5.0 (99.999% or higher) material is essential, and suppliers achieve this purity through methods like multi-stage PSA, catalytic hydrocarbon oxidation, and cryogenic polishing.
Economic considerations further highlight this divide: while pipelines or on-site reformers can service low-purity customers with minimal handling costs, high-purity users often incur surcharges for logistics involving tube-trailers or cylinders. Air Liquide and Linde have introduced modular purification skids, capable of upgrading existing syngas to over 99.5% purity. They trade these for capital-light service revenue, ensuring long-term customer loyalty. With the rise of integrated petrochemical hubs in China and the Gulf, the choice of production technology and delivery method is set to influence contract strategies, potentially overshadowing the importance of purity specifications.


By Application: Chemical Synthesis Anchors Demand, Electronics Surges
Chemical synthesis, driven by methanol carbonylation to acetic acid and the production of oxo-alcohols for plasticizers and surfactants, accounted for a 54.56% share of 2025's revenue. China dominates the global landscape, hosting nearly half of the world's methanol-to-acetic-acid capacity. The country strategically co-locates pipelines, efficiently transporting CO directly from reformers to rhodium-catalyzed reactors, thereby slashing inventory costs. Following closely, metal fabrication, spearheaded by India's DRI furnaces and Indonesia's nickel-laterite reduction, emerges as the second-largest demand pool. This sector's robust growth is intricately linked to the trajectories of emerging-market infrastructure and battery metals.
While the electronics and semiconductor sector currently represents a modest share by tonnage, it is poised for rapid expansion, forecasting a 4.90% CAGR through 2031. This surge aligns with global fab investments, projected to approach substantial levels by 2030. Highlighting another premium niche, Topsoe's eCOs units, installed at specialty-chemical and pharmaceutical sites, underscore the industry's evolution. Researchers are now harnessing isotopically labeled CO for metabolic tracing, a method endorsed by a 2024 Nature Chemistry report. This technique not only dispenses with the need for radioactive gas cylinders but also streamlines pre-clinical workflows. Despite the controversies surrounding meat coloring and preservation, the adoption of CO-MAP in Latin America and select Asian regions witnessed robust annual growth during 2024–2025. This surge is largely attributed to stringent visual-quality mandates from export markets. Additionally, other applications—ranging from laser cutting and specialty glass to carbon-nanotube growth—account for a notable portion of the total volume, closely mirroring capital expenditure trends in manufacturing.

Geography Analysis
Asia-Pacific led the carbon monoxide market with 48.24% of 2025 consumption and is expected to post a 4.47% CAGR to 2031. In 2025, China's acetic-acid capacity was primarily centered in the Nanjing and Ningbo clusters. These clusters, integrating methanol, CO, and downstream derivatives, not only achieve cost leadership but also enhance the value of hydrogen co-products. India's ambitious plan aims to elevate coal-based DRI production by 2030, translating to an annual CO demand embedded in syngas. Japan and South Korea are shifting their focus towards high-purity CO, essential for logic and memory fabs. Furthermore, Taiyo Nippon Sanso's investment in a German biogenic CO₂ plant in 2025 underscores the region's strategy to mitigate reliance on imported feedstock. Southeast Asia's nickel-laterite hubs are also witnessing growth, with CO-based reduction methods providing a stable power solution in regions grappling with inconsistent grid quality.
North America boasts the world's most competitive SMR cost base. Thanks to shale-gas inputs, costs are significantly lower compared to Europe and East Asia. Air Liquide is set to bolster regional capacity with its planned oxygen supply project in Baytown, Texas. This facility will support an ExxonMobil autothermal reformer, generating CO-rich syngas and a significant amount of low-carbon hydrogen, all while slashing oxygen-scope carbon intensity. While Canada and Mexico carve out smaller niches—tethered to Alberta’s petrochemical core and the Gulf Coast corridors, respectively—their pipeline reach limits off-cluster demand.
Europe grapples with challenges from soaring energy prices and stringent regulations. Yet, it stands at the forefront of low-carbon innovations. In alignment with the EU's Industrial Emissions Directive and Corporate Sustainability Reporting Directive, Topsoe is piloting SOEC projects in Germany and the Netherlands. These initiatives harness wind-generated electricity to convert captured CO₂ back into CO. In South America, Brazil and Argentina's beef-export sectors anchor the demand for CO-MAP, a technology that enhances shelf life. However, the absence of extensive gas pipelines and elevated trailer costs inflate delivered prices outside major urban centers. In the Middle East and Africa, demand is sporadic, primarily driven by Saudi petrochemicals and South African coal-to-liquids facilities. Yet, growth potential hinges on gas monetization initiatives and collaborative CO₂ transport networks, which could pave the way for electrolytic CO production.

Competitive Landscape
The carbon monoxide market is moderately concentrated, with the top five suppliers controlling a significant portion of the capacity. However, these suppliers don't dominate price-setting due to diluted bargaining power from regional feedstock spreads and captive syngas units. Early adopters, including pharmaceutical intermediates and phosgene manufacturers, have shifted from traditional cylinder deliveries, highlighting the allure of a decarbonized supply and a diminished hazardous-gas inventory. Meanwhile, regional players in China are leveraging integrated clusters to offer CO at significant discounts, heightening regional price competition. Strategic white space falls along three vectors. First, there's potential for premium margins in decarbonized on-site generation for semiconductor and pharmaceutical users, where purity and sustainability are paramount. Second, forming tolling partnerships with nickel-laterite processors in Indonesia and the Philippines can secure volumes, bolstered by the EV supply chain. Lastly, offering modular purification skids to enhance customer-owned syngas to high purity not only creates a light revenue stream but also integrates suppliers into clients' processes. Companies that bundle molecules, monitor compliance, and chart decarbonization paths are poised to seize a larger slice of future growth.
Carbon Monoxide Industry Leaders
Linde plc
Air Liquide
Air Products and Chemicals, Inc.
Messer SE & Co. KGaA
Yingde Gases
- *Disclaimer: Major Players sorted in no particular order

Recent Industry Developments
- February 2025: Air Products announced plans to exit three United States projects, including a Texas carbon-monoxide plant, and will record a pre-tax charge of up to USD 3.1 billion.
- April 2024: Celanese extended its Phase II CO supply contract with Nanjing Chengzhi Clean Energy, securing long-term feedstock for its 1.2 million tpa acetic-acid facility in Nanjing.


Global Carbon Monoxide Market Report Scope
Produced through the incomplete combustion of carbon-rich materials and industrial processes such as syngas generation, carbon monoxide (CO) is a colorless, odorless, and tasteless gas. Despite its lack of sensory attributes, CO is highly toxic. Beyond its industrial hazards, CO serves as a vital chemical intermediate, playing a key role in the production of both organic and inorganic compounds, as well as in the creation of aldehydes and reducing agents essential for metal refining.
The carbon monoxide market is segmented by purity, application, and geography. By purity, the market is segmented into below 99% and greater than 99%. By application, the market is segmented into chemicals, metal fabrication, electronics and semiconductor, pharmaceuticals and biotechnology, meat coloring and food preservation, and other applications. The report also covers the market size and forecasts in 15 countries. For each segment, the market sizing and forecasts have been done based on revenue (USD).
| Below 99% |
| Greater Than 99% |
| Chemicals |
| Metal Fabrication |
| Electronics and Semiconductor |
| Pharmaceuticals and Biotechnology |
| Meat Coloring and Food Preservation |
| Other Applications |
| Asia-Pacific | China |
| India | |
| Japan | |
| South Korea | |
| Rest of Asia-Pacific | |
| North America | United States |
| Canada | |
| Mexico | |
| Europe | Germany |
| United Kingdom | |
| France | |
| Italy | |
| Rest of Europe | |
| South America | Brazil |
| Argentina | |
| Rest of South America | |
| Middle-East and Africa | Saudi Arabia |
| South Africa | |
| Rest of Middle-East and Africa |
| By Purity | Below 99% | |
| Greater Than 99% | ||
| By Application | Chemicals | |
| Metal Fabrication | ||
| Electronics and Semiconductor | ||
| Pharmaceuticals and Biotechnology | ||
| Meat Coloring and Food Preservation | ||
| Other Applications | ||
| By Geography | Asia-Pacific | China |
| India | ||
| Japan | ||
| South Korea | ||
| Rest of Asia-Pacific | ||
| North America | United States | |
| Canada | ||
| Mexico | ||
| Europe | Germany | |
| United Kingdom | ||
| France | ||
| Italy | ||
| Rest of Europe | ||
| South America | Brazil | |
| Argentina | ||
| Rest of South America | ||
| Middle-East and Africa | Saudi Arabia | |
| South Africa | ||
| Rest of Middle-East and Africa | ||


Key Questions Answered in the Report
How large is the carbon monoxide market in 2026?
The carbon monoxide market size is valued at USD 5.57 billion in 2026 and is projected to grow to USD 6.84 billion by 2031, registering a CAGR of 4.19%.
Which region records the fastest demand growth for carbon monoxide?
Asia-Pacific leads with a forecast 4.47% CAGR, propelled by Chinese chemical capacity, Indian DRI expansion, and East Asian semiconductor investments.
Why is high-purity carbon monoxide in greater demand at chip fabs?
Sub-3 nm logic and advanced 3D NAND processes need Grade 5.0 CO to avoid metallic contamination during etch and deposition, increasing consumption per wafer.
What factors restrain wider CO adoption in emerging economies?
Tightening workplace exposure limits, volatile feedstock prices, and limited pipeline infrastructure raise compliance and logistics costs in these regions.
Which application segment shows the fastest growth?
Electronics and semiconductor applications are projected to post a 4.90% CAGR through 2031 due to global fab expansions.
How are suppliers mitigating feedstock price volatility?
Large industrial-gas firms embed energy-cost pass-through clauses in tolling agreements and increasingly deploy on-site generation to hedge against market swings.
Page last updated on:


