
Market Overview
| Study Period | 2020 - 2031 |
|---|---|
| Forecast Data Period | 2026 - 2031 |
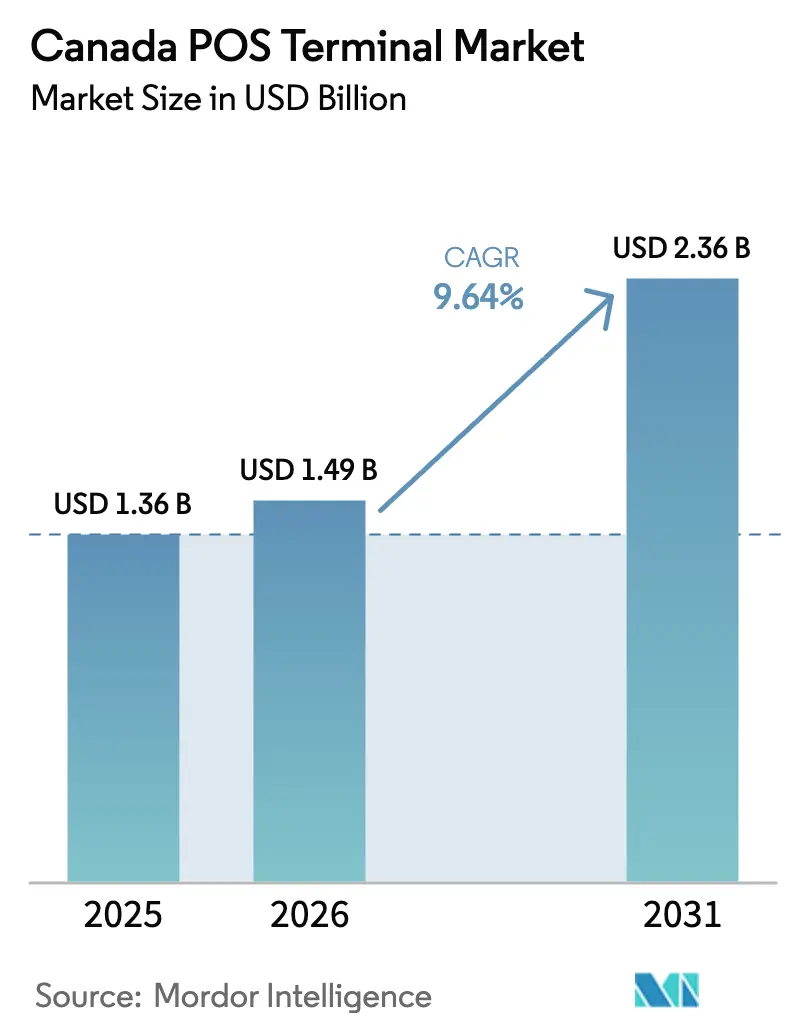
| Base Year Market Size (2025) | USD 1.36 Billion |
| Market Size (2026) | USD 1.49 Billion |
| Market Size (2031) | USD 2.36 Billion |
| Growth Rate (2026 - 2031) | 9.64 % |
| Market Concentration | Medium |
Major Players *Disclaimer: Major Players sorted in no particular order Image © Mordor Intelligence. Reuse requires attribution under CC BY 4.0. | |
Canada POS Terminal Market Analysis by Mordor Intelligence
Canada POS Terminal Market size in 2026 is estimated at USD 1.49 billion, growing from 2025 value of USD 1.36 billion with 2031 projections showing USD 2.36 billion, growing at 9.64% CAGR over 2026-2031. Contactless transactions already account for 63% of all in-store payments, up 17 percentage points from 2024, underscoring a structural pivot toward tap-to-pay behavior. The Retail Payment Activities Act (RPAA) drives a compliance-led refresh cycle as all payment service providers must register by November 2024 and meet operational standards by September 2025.[1]Source: Morrow, Ron, “Laying bare the evolution of payments in Canada,” Bank of Canada, bankofcanada.ca Competitive differentiation is shifting from hardware alone to software-rich ecosystems that embed AI fraud analytics, real-time reporting, and omnichannel orchestration capabilities. Meanwhile, persistent semiconductor shortages and elevated cybersecurity concerns temper momentum but are offset by interchange-fee reductions of up to 27% for small businesses and the anticipated launch of open banking legislation in 2025, which together lower the cost and complexity of electronic acceptance
Key Report Takeaways
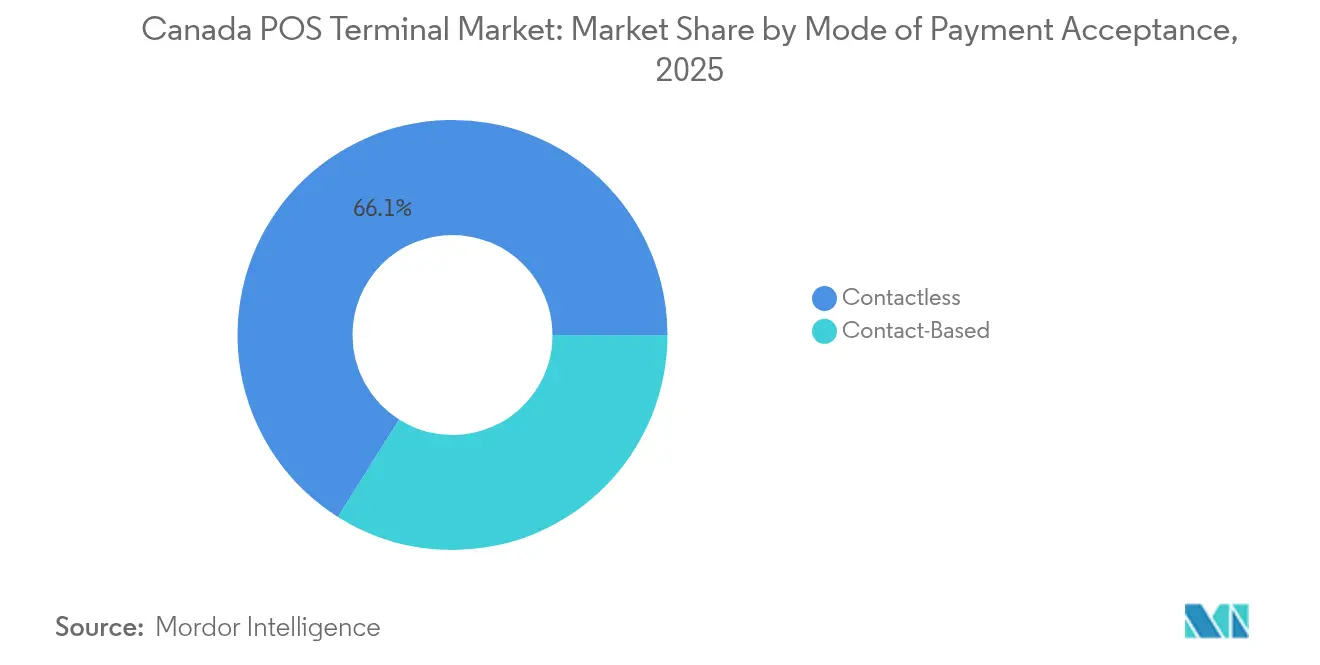
- By mode of payment acceptance, contactless solutions led with a 66.05% of the Canada POS terminal market revenue share in 2025 and are forecast to expand at an 11.12% CAGR through 2031.
- By POS type, mobile and portable systems held 54.25% of the Canada POS terminal market share in 2025, while the segment is projected to grow at a 10.45% CAGR to 2031.
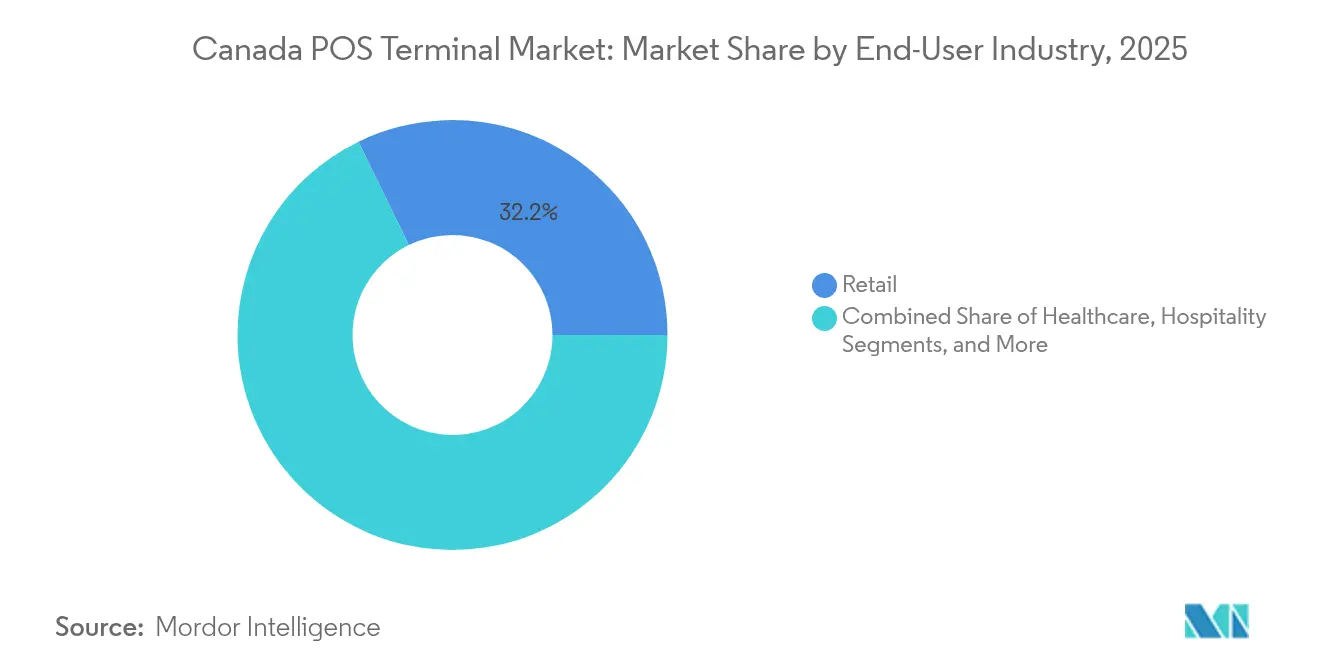
- By end-user industry, retail accounted for a 32.20% share of the Canada POS terminal market size in 2025 and healthcare is advancing at a 10.05% CAGR through 2031.
Note: Market size and forecast figures in this report are generated using Mordor Intelligence’s proprietary estimation framework, updated with the latest available data and insights as of 2026.
Canada POS Terminal Market Trends and Insights
Drivers Impact Analysis*
| Driver | (~) % Impact on CAGR Forecast | Geographic Relevance | Impact Timeline |
|---|---|---|---|
| Low Total Cost of Ownership vs Other Payment Channels | +1.8% | National, with early gains in Toronto, Montreal, Vancouver | Medium term (2-4 years) |
| Surging Demand for Contactless and mPOS Solutions | +2.4% | National, accelerated adoption in urban centers | Short term (≤ 2 years) |
| Regulatory Push toward Cashless Economy | +1.5% | National, with RPAA compliance requirements | Medium term (2-4 years) |
| Expansion of SaaS-Based POS Platforms for SMBs | +2.1% | National, concentrated in SMB-dense regions | Medium term (2-4 years) |
| 5G and Edge-Enabled Real-Time Analytics at Checkout | +1.2% | Major urban centers, expanding to secondary markets | Long term (≥ 4 years) |
| Rise of POS-as-a-Service Subscription Models | +1.6% | National, particularly attractive to cash-constrained SMBs | Medium term (2-4 years) |
| Source: Mordor Intelligence | |||
Surging Demand for Contactless and mPOS Solutions
Contactless usage is reshaping checkout strategies as in-store mobile contactless payments surged 42% year-over-year in 2024 to represent 23% of all tap-to-pay volume. Wearables generated 44 million transactions worth CAD 1.1 billion, reflecting deepening consumer trust in tokenized NFC credentials.[2]Interac Corp., “Get ahead of the curve with data-driven trends,” interac.ca Gen Z adoption fuels the change, with 70% using mobile wallets and 63% comfortable leaving physical wallets behind. Merchants respond by deploying NFC-ready devices that enable staff-assisted or self-checkout flows anywhere on the sales floor. Public transit rollouts, such as tap-to-pay across the Toronto Transit Commission, showcase large-scale viability and build consumer familiarity with touchless fare collection.
Expansion of SaaS-Based POS Platforms for SMBs
Cloud POS subscriptions lower entry barriers, illustrated by Moneris Go Retail POS at CAD 10 per month for software plus CAD 34.95 for terminal rental. This operating-expense model resonates with Canada’s 1.2 million SMBs, 53% of whom feel overwhelmed by manual finance workflows.[3]Plooto Money Team, “The state of SMB finances,” plooto.com SaaS offers continuous feature delivery and automatic compliance updates, vital under rapidly evolving RPAA rules. Integrated inventory, CRM, and loyalty functions add value beyond payment processing, encouraging merchants to consolidate their tech stack with a single vendor. Third-party solution providers also gain from easier API integrations and revenue-sharing opportunities.
Low Total Cost of Ownership vs Other Payment Channels
Contactless debit dominates POS activity, representing 62% of tap transactions and generating materially lower interchange versus credit rails. Lower per-transaction fees, coupled with durable solid-state hardware, reduce lifetime costs compared with cash handling or legacy chip-and-PIN terminals. Cloud management cuts on-premises server spend, while over-the-air updates mitigate technician dispatch costs. These factors raise ROI for merchants and widen the addressable base for the Canada POS terminal market. Vendor finance programs further spread out capital expenditure and support faster refresh cycles among cost-sensitive verticals.
Regulatory Push toward Cashless Economy
The RPAA imposes mandatory registration and risk frameworks on payment providers, effectively institutionalizing digital rails as the standard for Canadian commerce. Concurrently, interchange reductions up to 27% on sub-CAD 300,000 annual Visa volumes enhance card economics for small firms. Looming open banking legislation promises real-time account-to-account settlement within POS flows, potentially bypassing card networks for certain use cases. Pandemic-era declines in cash use have become structural, reinforcing the policy-driven shift. Vendors offering compliance-ready software enjoy a first-mover edge as merchants seek turnkey solutions that satisfy audits without major hardware swaps.
Restraints Impact Analysis*
| Restraint | (~) % Impact on CAGR Forecast | Geographic Relevance | Impact Timeline |
|---|---|---|---|
| Persistent Payment-Data Security Concerns | -1.4% | National, heightened in sectors handling sensitive data | Short term (≤ 2 years) |
| High Up-Front Hardware Cost for Micro-Merchants | -0.9% | National, concentrated in rural and low-margin businesses | Medium term (2-4 years) |
| Supply-Chain Chipset Volatility Post-COVID-19 | -1.1% | National, with manufacturing delays affecting all regions | Short term (≤ 2 years) |
| Legacy Integration Complexities in Tier-1 Retail | -0.8% | Major urban centers, concentrated in established retail chains | Medium term (2-4 years) |
| Source: Mordor Intelligence | |||
Persistent Payment-Data Security Concerns
High-profile breaches heighten anxiety among healthcare and financial-services merchants that handle sensitive data. Many believe personal information is more exposed today than ever, yet feel current safeguards remain inadequate. Compliance with PCI DSS, provincial privacy statutes, and forthcoming AI governance rules adds complexity and cost. Security fears delay refresh cycles, especially for niche verticals that store medical or biometric data. Vendors that obtain PCI P2PE certification and embed tokenization, as Moneris has done across its Go devices, convert risk management into a selling point.
High Up-Front Hardware Cost for Micro-Merchants
Micro-merchants operating on thin margins struggle to justify advanced terminals once processing fees, software licenses, and integration labor are factored in. Inflation pressures and limited cash flow amplify the challenge. Rural operators often lack wired broadband, necessitating cellular or satellite connectivity that drives costs higher. To counteract sticker shock, providers now push SoftPOS, turning Android smartphones into tap-to-pay endpoints, and subscription models that bundle hardware, support, and settlement services. Payroc’s partnership with Moneris exemplifies such semi-integrated packages that lower entry thresholds for independent software vendors serving small merchants.
*Our forecasts treat driver/restraint impacts as directional, not additive. The impact forecasts reflect baseline growth, mix effects, and variable interactions.
Segment Analysis
By Mode of Payment Acceptance: Contactless Dominance Accelerates
Contactless transactions held a 66.05% slice of the Canada POS terminal market in 2025 and are projected to post an 11.12% CAGR through 2031, far outpacing chip-and-PIN volumes. This trajectory positions tap-to-pay as the de facto consumer expectation at checkout, especially as debit-card limits rise and mobile wallet penetration deepens. Debit’s 62% share of contactless volume underscores the importance of immediate fund access and budget control for Canadian shoppers. Merchants therefore prioritize NFC-enabled devices with real-time debit rails and one-tap wallet compatibility, reshaping procurement criteria.
Contact-based acceptance remains relevant for high-ticket or regulated scenarios that still demand signature or PIN verification, yet its share continues to erode. Regulatory frameworks now grant lower PCI scope to tokenized contactless environments, further tipping the scales toward tap adoption. The total contactless Canada POS terminal market size for debit alone is forecast to exceed USD 1.06 billion by 2031, reinforcing hardware and software roadmaps centered on NFC, tokenization, and biometric validation features.



By POS Type: Mobile Solutions Drive Market Evolution
Mobile and portable devices captured 54.25% of the Canada POS terminal market in 2025 and are advancing at a 10.45% CAGR to 2031 as retailers pivot from queue-based checkout to in-aisle engagement. Tablets and purpose-built handhelds enable line-busting, proactive sales assistance, and tableside ordering, thereby monetizing store real estate more efficiently. Restaurants top the priority list: 89% plan technology investments with mobile POS at the forefront for integrating order, pay, and loyalty workflows.
Fixed units still dominate high-volume lanes where cash drawers, receipt printers, and conveyor belts remain critical. Yet their growth lags as portable form factors inherit cashier functions at a lower footprint cost. The Canada POS terminal market size tied to mobile formats is expected to reach USD 1.33 billion by 2031, spurred by 5G connectivity, cloud API ecosystems, and declining battery prices. Vendors now emphasize modular docks and unified OS stacks so merchants can fluidly combine countertop and roaming experiences without duplicating software spend.
By End-User Industry: Healthcare Emerges as Growth Leader
Retail preserved its historical leadership with a 32.20% share of the Canada POS terminal market in 2025 due to sheer store count and high transaction frequency. However, healthcare is registering the fastest expansion at a 10.05% CAGR through 2031 as clinics move away from invoices and checks toward instant card or wallet settlement. Rising patient cost-sharing, telehealth adoption, and the need for HIPAA-compliant payment flows drive hospital investments in secure, tokenized devices.
Hospitality follows closely, pairing reservation, menu, and payment data into unified dashboards that streamline staff workflows and elevate guest experiences. Transportation and logistics firms increasingly deploy ruggedized mobile units for proof-of-delivery and on-the-spot payments. Collectively, non-retail verticals account for roughly 48% of Canada POS terminal market share, a balance that diffuses vendor risk across multiple industry cycles and regulatory regimes.
Geography Analysis
Ontario and Quebec command the largest provincial shares, leveraging dense merchant populations, well-developed fiber and 5G networks, and early-adopter cultures that embrace digital commerce. The Greater Toronto Area alone processes more than 25% of national card volumes, making it a bellwether for hardware upgrades and software feature rollouts. Montreal’s vibrant SMB scene accelerates SaaS POS uptake, particularly among bilingual retailers seeking localized support.
British Columbia, anchored by Vancouver, posts strong demand in hospitality, driven by tourism and an expanding tech workforce. Alberta and Saskatchewan exhibit growing adoption tied to resource-sector diversification and agri-business modernization, with mobile devices enabling remote, seasonal, and pop-up operations. Atlantic provinces progress at a steadier pace, though Halifax retailers increasingly integrate tap-to-pay with loyalty platforms to compete for visitor spend.
Nationwide payment rails, Real-Time Rail and ISO 20022 messaging, assure consistent settlement speeds and data depth regardless of geography, unlocking advanced analytics for even rural merchants. Government small-business grants targeting digital transformation further stimulate hardware refresh outside major metros. The result is a broadening Canada POS terminal market footprint that balances urban scale with regional niche opportunities, sustaining double-digit growth despite economic unevenness.
Regulatory Landscape
Regulatory oversight for retail payments is tightening under the Retail Payment Activities Act (RPAA) and the Retail Payment Activities Regulations (SOR/2023-229), administered by the Bank of Canada. The framework requires payment service providers to register and maintain risk management and incident response practices, including safeguards for end-user funds and operational standards effective September 8, 2025. These requirements reinforce compliance-led refresh cycles across acquiring, gateway, and POS software stacks.
At the rail and operating-rule layer, Payments Canada governs the exchange, clearing, and settlement of electronic point-of-service payment items through Rule E1, which was updated effective February 9, 2026. Compliance also adds recurring operational workstreams, including annual reporting (by March 31 following the year of retail payment activities), which increases demand for POS platforms that can support audit-ready logs, reconciliation data, and incident workflows without extensive custom integration.
Value Chain Analysis
The Canada POS terminal value chain runs from device OEMs and component suppliers to POS application software and payment gateway services, then to acquirers and their financial-institution partners. Upstream, tokenization and the issuer ecosystem (token service providers and payor financial institutions) shape how authorization, clearing, settlement, chargeback handling, and exception management are implemented. Payments Canada operating rules, including Rule E1 for POS payment items, influence how terminals and POS software align to rule conformance and reporting expectations, making those capabilities a practical design input.
On the supply side, POS hardware and enterprise checkout vendors active in Canada include Toshiba, Fujitsu, NCR Voyix, HP, and Oracle, while the software layer includes providers such as NCR Voyix, Oracle, ParTech, Xenial, and Sweda. Downstream, distribution and deployment are typically handled through acquirer-led channels, ISV marketplaces, and vertical solution partners, with growing emphasis on tokenized contactless acceptance and cloud fleet management to reduce on-site servicing and speed updates across multi-location estates.
Competitive Landscape
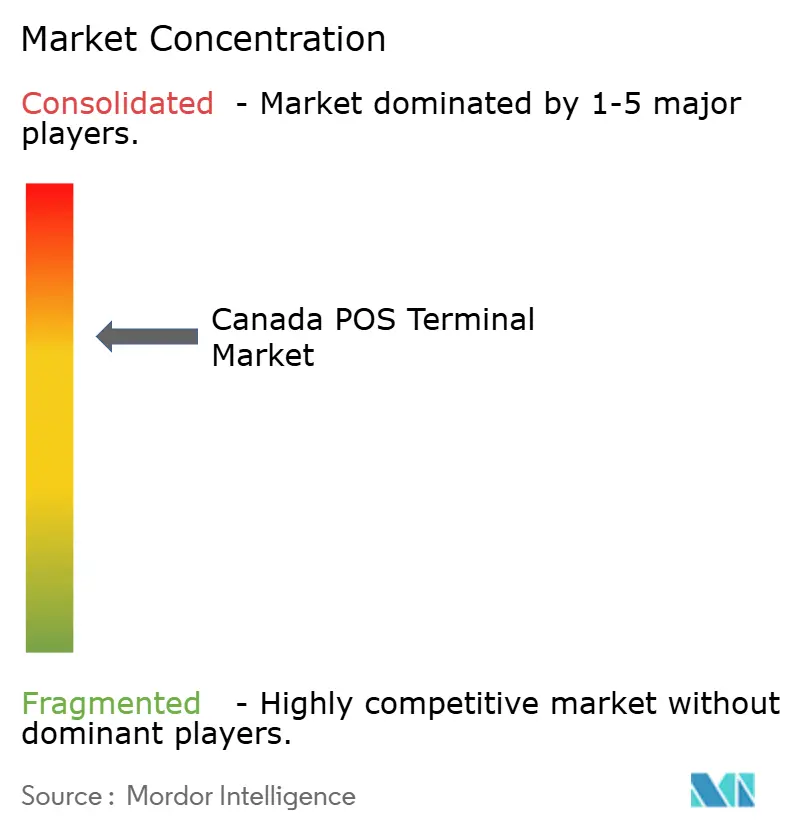
The market is moderately fragmented: global hardware giants Ingenico, Verifone, and PAX vie with domestic software-first players such as Moneris, Lightspeed, and Square Canada. Hardware commoditization pushes vendors toward platform strategies bundling payment processing, business software, and data services. Moneris leverages deep Canadian regulatory insight to tailor RPAA-compliant tools, while Square scales on seamless e-commerce-brick-and-mortar convergence.
M&A signals maturation. Shift4’s CAD 200 million purchase of Givex extended its reach into gift-card and loyalty data, adding 100,000-plus Canadian endpoints. Paystone’s CAD 21 million acquisition of Ackroo boosted its cloud loyalty stack, illustrating appetite for value-added software to offset interchange compression. SoftPOS entrants threaten the low-end hardware tier, prompting incumbents to release smartphone-based solutions or flexible rental models.
Strategic partnerships amplify distribution. Square’s 2025 alliances with TouchBistro and Vend embed its payment rails within specialized vertical software, broadening exposure to restaurants and independent retailers. Integrated ecosystems increasingly decide vendor selection as merchants seek fewer vendors and unified support agreements. The combined share of the top five providers hovers near 55%, indicating healthy competition yet meaningful scale advantages for rule-of-three leaders.
Canada POS Terminal Industry Leaders
HP Development Company LP
Panasonic Corporation
NEC Corporation
Samsung Electronics Co., Ltd.
Ingenico Group SA
- *Disclaimer: Major Players sorted in no particular order

Market Opportunities and Future Outlook
RPAA and Payments Canada rule updates are increasing the value of compliance-ready, software-centric terminals and POS platforms that streamline risk controls, incident response, and audit evidence generation. The February 9, 2026 update to Payments Canada Rule E1 extends the need for ongoing rule maintenance, supporting opportunities for vendors that package rule changes into managed updates, dashboards, and reporting layers rather than relying on one-off professional services.
Large-scale enterprise rollouts also remain a core opportunity set, given Canada’s concentrated urban retail footprint and the presence of national chains operating complex, multi-banner store networks. Deployment and refresh programs across major merchants such as Loblaw, Empire Company, Alimentation Couche-Tard, Metro Inc., Canadian Tire, Lululemon Athletica, and Restaurant Brands International support demand for fleet-manageable, omnichannel-capable POS estates, especially as contactless and mobile/portable checkout formats become standardized across locations.
Recent Industry Developments
- July 2026: TD Bank Group launched the Clover all-in-one commerce platform through TD Merchant Solutions, providing hardware, integrated processing, and business management software. The launch broadens Clover adoption among Canadian SMBs and accelerates the shift to bundled payments solutions. The initiative deepens TD's embedded payments ecosystem and enhances customer retention through combined hardware, software, and payment services.
- January 2025: Square Canada partnered with TouchBistro and Vend to extend integrated payment capabilities across restaurant and retail platforms. The partnership directly affects the Canadian POS ecosystem by expanding Square's vertical reach in hospitality and retail channels. It reinforces Square’s embedded payments strategy across retail and HORECA segments in Canada.
- December 2024: Paystone acquired Ackroo for CAD 21 million to strengthen its cloud loyalty and POS offerings. The acquisition improves loyalty software and cloud POS capabilities for merchants in Canada and shifts competitive dynamics. It consolidates loyalty data and cloud POS capabilities, strengthening Paystone’s market position.


Research Methodology Framework and Report Scope
Market Definition and Coverage
For this study, the market covers POS terminals used by merchants in Canada to accept in-person payments, and the sizing is captured as the value of terminal-related revenues tracked across merchant-facing deployments.
Scope exclusions: We exclude pure online payment acceptance that does not require an in-store or on-premise POS terminal.
Segmentation Overview
- By Mode of Payment Acceptance
- Contact-Based
- Contactless
- By POS Type
- Fixed Point-of-Sale Systems
- Mobile / Portable POS Systems
- By End-User Industry
- Retail
- Hospitality
- Healthcare
- Transportation and Logistics
- Other End-user Industries
Data Sources, Market Sizing, and Validation
Desk Research
Desk research started with anchoring the demand pool for in-store electronic payments in Canada, and then mapping it to terminal deployment and refresh behavior. We referenced public statistics and guidance from sources such as Statistics Canada, the Bank of Canada payments research, Payments Canada materials on rails modernization, and government or regulator publications tied to payments oversight and compliance timelines.
Next, we used issuer and network level indicators that are typically published in annual summaries, plus trade association and reputable press reporting, to understand contactless penetration, small merchant adoption, and upgrade triggers like EMV and security requirements. Company filings, investor presentations, and product documentation helped us separate fixed countertop deployments from portable and mobile setups, and to sanity-check the typical pricing and replacement cycles seen in retail and hospitality. We also used a paid subscription for company financials and news, and a patent database to spot where product shifts were happening, but the public sources remained the main anchors. The sources listed here are illustrative, and many other public documents and datasets were reviewed for collection, validation, and clarification.
Primary Interviews and Surveys
Primary work was used to pressure-test the desk assumptions that most often drive market value, such as average selling prices, service bundling at the merchant level, and replacement timing by end user. We spoke with a mix of stakeholders across the value chain, including acquirer and processor side roles, terminal distribution and service partners, and merchant-facing operations teams, to confirm what is being purchased and what is being deferred. Because this is a Canada-specific market, inputs were validated with respondents covering major provinces and a mix of large and small merchant formats.
Distribution of primary research fieldwork respondents
| Company type | Respondent position |
|---|---|
| Top tier: 30% | CXOs: 15% |
| Mid tier: 53% | Functional/Unit leaders: 37% |
| Smaller Players: 17% | Managers: 48% |
Market-Sizing & Forecasting
Sizing was built using a top-down and bottom-up approach, where Canada in-store payment activity and merchant base indicators were used to reconstruct the addressable terminal demand pool, and then converted into value using deployment intensity and pricing logic. In practical terms, we tied demand to signals such as contactless usage share, merchant counts by major end-user group, typical terminals per location, replacement cycles driven by security and compliance, and the split between fixed and portable/mobile installations.
To keep the model grounded, results were corroborated with selective bottom-up checks like sampled ASP times estimated unit volumes, channel feedback on quarterly sell-in patterns, and roll-ups from a limited set of supplier and partner revenue disclosures where they were available. Where a clean unit number could not be built for a niche end-user group, we handled gaps by using proxy adoption rates from adjacent merchant categories and then re-validating the implied terminal density through interviews.
For forecasting, we leaned on scenario analysis supported by a simple multivariate view of the main drivers, including retail and hospitality outlet growth, the pace of tap-to-pay substitution, rollout of software-led POS bundles that can shift hardware pricing, and the cadence of technology refresh. Assumptions were then adjusted after primary respondents confirmed which drivers were most sensitive in near-term purchasing decisions.
Data Validation & Update Cycle
Validation was done in multiple passes so the final numbers matched real-world signals and did not move only because one input changed. We compared model outputs against independent checkpoints like changes in contactless payment behavior, reported merchant acceptance expansion, and the timing of security or regulatory requirements that tend to cause replacement spikes, and then anomalies were reviewed by another analyst before sign-off.
If a large variance showed up by POS type or end-user group, we re-checked the underlying adoption and pricing assumptions and, when needed, re-contacted sources to confirm whether it was a data issue or a genuine market shift. The report is refreshed annually, and interim updates are made when material events occur that can change pricing, supply availability, or upgrade timing. Before delivery, a fresh review pass is completed so clients receive the latest consistent view.
Mordor Intelligence's Canada Pos Terminal Market Size Versus Other Published Estimates
Published market sizes for Canada POS terminals can look far apart because each publisher draws the boundary differently and uses different anchor signals to convert activity into dollars. Differences usually come from whether values include bundled software and services, how refurbished or secondary units are treated, and how aggressively replacement cycles are assumed.
Contactless share trends, merchant outlet counts, and replacement-cycle checks tied to security and compliance are the evidence points that keep Mordor Intelligence's estimate aligned to the active installed base and near-term refresh demand, rather than a broader payments technology spend bucket. Other figures can diverge when they lean more on shipment-only views, use a single blended ASP across terminal types, or apply longer refresh assumptions that soften growth in a mature acceptance market.
Benchmark comparison
| Source | Market Size | Gaps in Research Methodology |
|---|---|---|
| Mordor Intelligence | USD 1.49 B (2026) | |
| Industry Analyst House A | USD 0.83 B (2025) | This estimate appears closer to a retail-terminal view with a slower growth profile, and it can come out lower when the model leans on conservative refresh rates and narrower coverage of non-retail merchant deployments. |
| Independent Insight Note B | USD 1.56 B (2026) | This figure can run higher when bundled POS packages are counted more broadly, and when pricing progression is applied uniformly without separating fixed versus mobile/portable terminal mixes across end users. |
Taken together, the spread is mainly explained by scope boundaries and the practical pricing and refresh assumptions used to turn deployment needs into value. By tying the total to observable adoption signals and then cross-checking with partner and merchant feedback, the model stays repeatable and easier to audit when new information arrives.


Key Questions Answered in the Report
What is the current value of the Canada POS terminal market?
The Canada POS terminal market is valued at 1.49 billion USD in 2026 and is set to reach 2.36 billion USD by 2031.
How fast is the contactless segment growing?
Contactless payment acceptance is expanding at an 11.12% CAGR, outpacing all other modes through 2031.
Which POS type leads adoption in Canada?
Mobile and portable terminals lead with 54.25% market share as merchants favor flexible, in-aisle checkout.
Which industry vertical is the fastest-growing user of POS terminals?
Healthcare is advancing at a 10.05% CAGR as clinics digitize patient billing and copay collection.
How does regulation affect POS investment?
The Retail Payment Activities Act compels merchants to adopt compliant terminals by September 2025, fueling upgrade cycles.
Page last updated on:


 Your data is secure and never sold or shared.


