Broadcasting And Cable TV Market Size and Share
Market Overview
| Study Period | 2020 - 2031 |
|---|---|
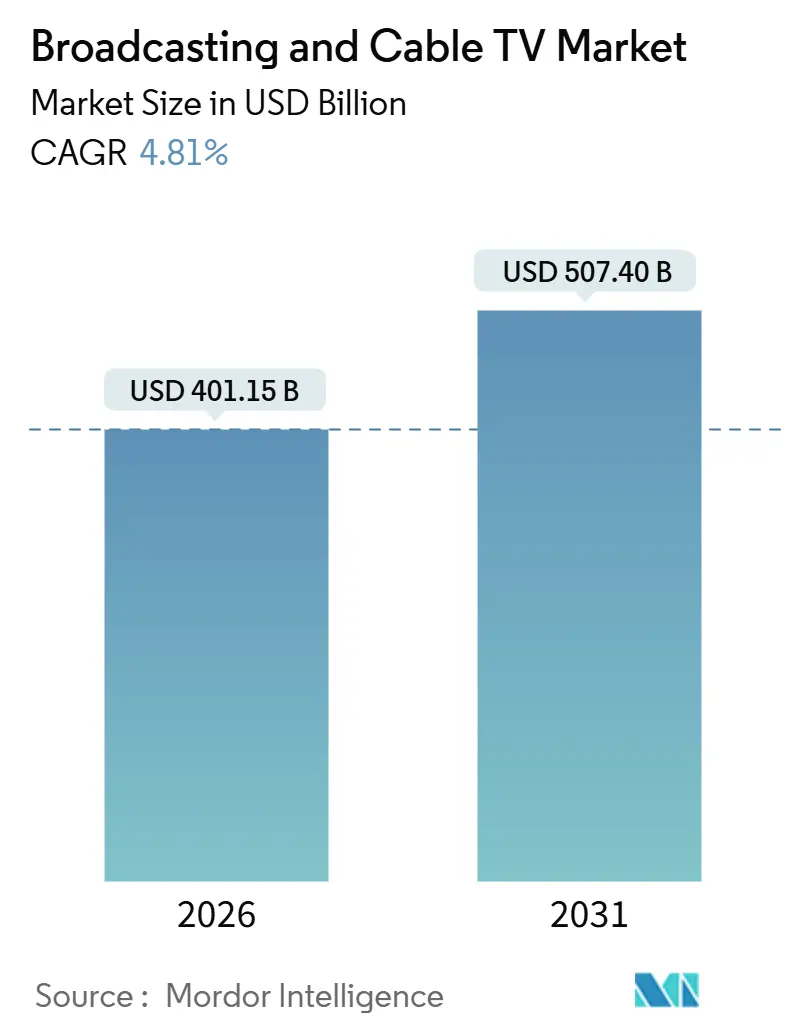
| Market Size (2026) | USD 401.15 Billion |
| Market Size (2031) | USD 507.40 Billion |
| Growth Rate (2026 - 2031) | 4.81% CAGR |
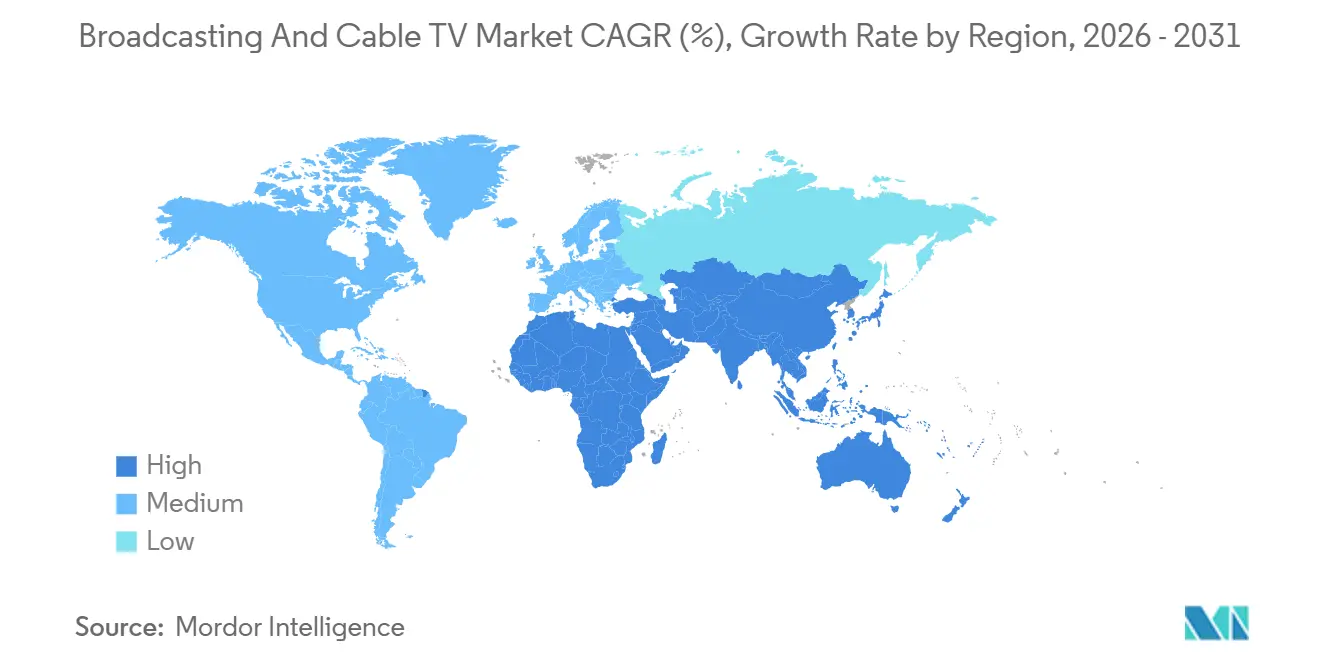
| Fastest Growing Market | Asia Pacific |
| Largest Market | North America |
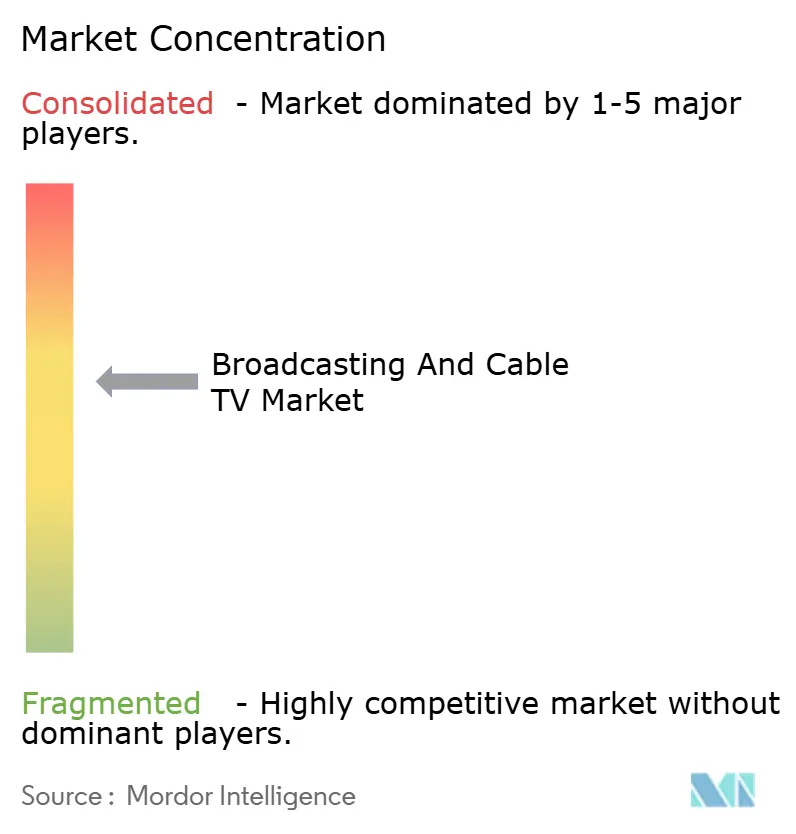
| Market Concentration | Medium |
Major Players *Disclaimer: Major Players sorted in no particular order Image © Mordor Intelligence. Reuse requires attribution under CC BY 4.0. | |
Broadcasting And Cable TV Market Analysis by Mordor Intelligence
The Broadcasting And Cable TV Market size is estimated at USD 401.15 billion in 2026, and is expected to reach USD 507.40 billion by 2031, at a CAGR of 4.81% during the forecast period during the forecast period. Sustained consumer migration from purely-linear viewing toward hybrid bundles combines the depth of over-the-top libraries with the familiarity of channel-based navigation, enabling incumbent operators to preserve subscriber relationships while modernizing their value propositions. Addressable connected-TV (CTV) advertising is scaling rapidly, giving brands granular household-level targeting and boosting average CPMs relative to traditional spot buys. Artificial-intelligence (AI) tools now automate dubbing, subtitling, and cultural adaptation, which cuts localization costs and accelerates time-to-market, particularly across linguistically diverse Asia Pacific territories. Meanwhile, NextGen TV (ATSC 3.0) roll-outs equip broadcasters with 4K delivery, interactive apps, and targeted advertising inside a free-to-air signal, narrowing the experiential gap with broadband services.
Key Report Takeaways
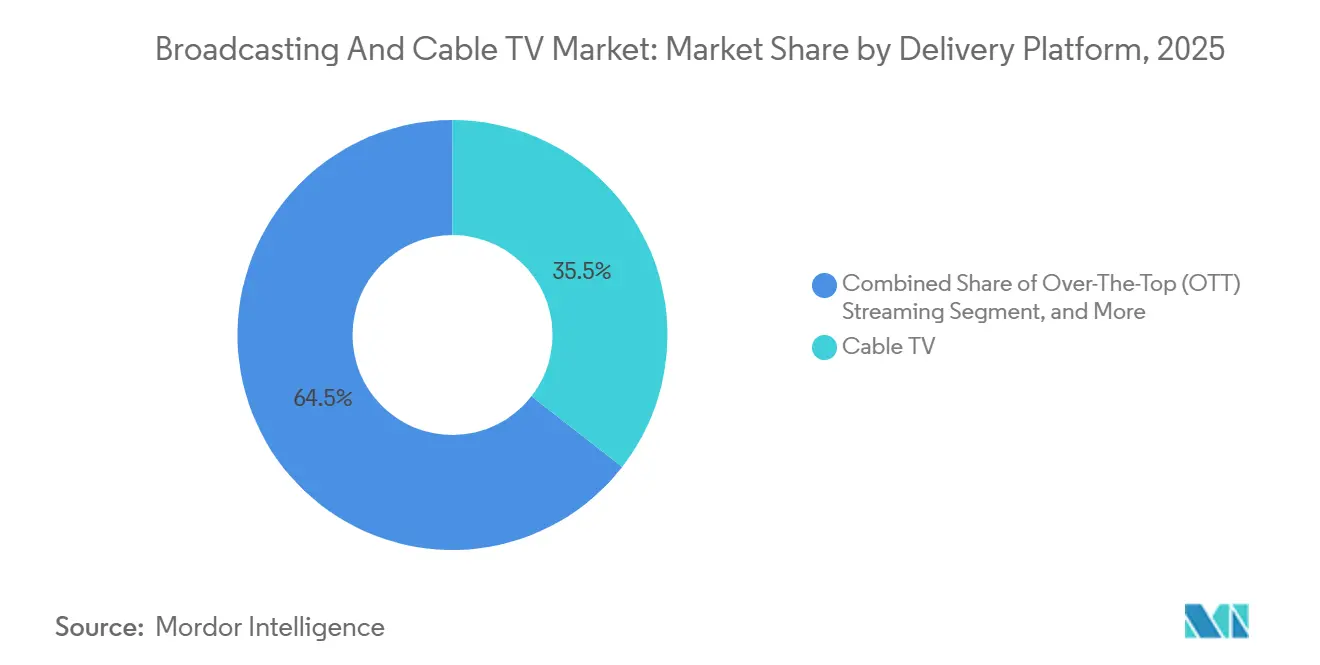
- By delivery platform, cable television led with 35.51% of the Broadcasting and Cable TV market share in 2025, while over-the-top streaming is projected to expand at a 7.86% CAGR through 2031.
- By revenue model, subscriptions accounted for 58.62% of the Broadcasting and Cable TV market size in 2025, whereas advertising-supported video on demand is poised to grow at a 6.51% CAGR over the 2031.
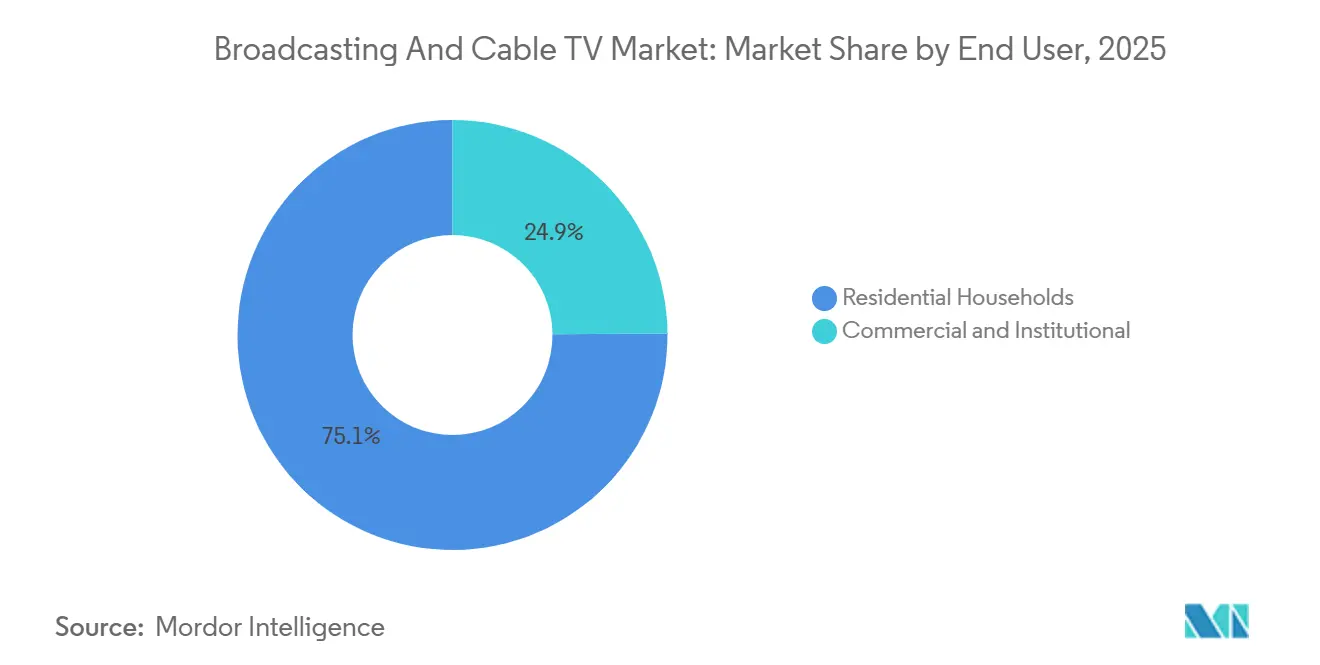
- By end user, residential viewing represented 75.12% of Broadcasting and Cable TV market size in 2025 revenue; the commercial segment is advancing at a 6.22% CAGR in 2031 owing to enterprise streaming applications.
- By content genre, entertainment programming held 39.89% of the Broadcasting and Cable TV market share in 2025, yet sports content is forecast to post the fastest 7.78% CAGR in 2031 due to premium rights valuations.
- By geography, North America captured 41.11% of Broadcasting and Cable TV market size in 2025 revenue, whereas Asia Pacific is set to record the highest 7.97% CAGR through 2031.
Note: Market size and forecast figures in this report are generated using Mordor Intelligence’s proprietary estimation framework, updated with the latest available data and insights as of January 2026.
Global Broadcasting And Cable TV Market Trends and Insights
Drivers Impact Analysis*
| Driver | (~) % Impact on CAGR Forecast | Geographic Relevance | Impact Timeline |
|---|---|---|---|
| Accelerating cord-cutting toward hybrid bundles | +1.2% | North America and Europe | Medium term (2-4 years) |
| Surging demand for addressable CTV advertising | +1.4% | North America and Europe, expanding to Asia Pacific | Short term (≤ 2 years) |
| AI-enabled content localization at scale | +0.8% | Asia Pacific, Latin America, Middle East and Africa | Long term (≥ 4 years) |
| NextGen TV (ATSC 3.0) roll-out enhancing interactivity | +0.9% | United States, select European markets | Medium term (2-4 years) |
| Spectrum re-farming for 5G broadcast trials | +0.5% | Global | Long term (≥ 4 years) |
| Bundled wholesale deals between telcos and streamers | +0.7% | Global developed markets | Medium term (2-4 years) |
| Source: Mordor Intelligence | |||
Accelerating Cord-Cutting Toward Hybrid Bundles
Linear subscriptions contracted 6.2% in 2024, yet operators that paired broadband with curated streaming services captured 78% of new customer acquisitions, proving that hybrid packaging can offset churn and stabilize average revenue per user. Telecom-streamer alliances, such as Verizon’s Disney+ and Netflix bundle, simplify billing and unify discovery, raising perceived value and lowering friction for households that juggle multiple apps in the broadcasting and cable TV market.
Surging Demand for Addressable CTV Advertising
Advertisers directed USD 29.3 billion to CTV inventory in 2024, up 21.2% year over year, as pixel-level measurement and programmatic workflows delivered brand lift comparable to social video while offering the big-screen impact of television. Samsung Ads processed more than 2.1 billion daily impressions in fourth-quarter 2024, highlighting scale that rivals major digital networks.[1]Stephen Strong, “Samsung Ads Platform Handles Record Impression Volume,” Samsung Business Insights, samsung.com Broadcasters are onboarding dynamic-ad-insertion stacks, allowing them to sell targeted spots inside live linear feeds rather than relying solely on pre-sold national breaks.
AI-Enabled Content Localization at Scale
Machine-learning speech synthesis now reduces dubbing expenses by 60-80% and cuts turnaround from two months to roughly two weeks, letting streamers release multilingual versions simultaneously and pursue audiences once considered niche. Disney used AI to localize Marvel series into 12 languages during 2024, supporting global day-and-date premieres and helping the service hit 150.2 million subscribers. The technology directly boosts title utilization rates in India, Southeast Asia, and Latin America, where linguistic fragmentation previously hindered uptake.
NextGen TV (ATSC 3.0) Roll-Out Enhancing Interactivity
ATSC 3.0 signals reached 75% of U.S. markets by the end of 2024, unlocking 4K resolution, object-based audio, and two-way data paths inside a traditional broadcast channel. Device makers responded: 34% of LG’s 2024 models and the majority of Samsung’s premium sets shipped with ATSC 3.0 tuners. Sinclair Broadcast Group demonstrated interactive weather overlays and targeted advertising pilots, foreshadowing revenue diversification beyond carriage fees.
Restraints Impact Analysis*
| Restraint | (~) % Impact on CAGR Forecast | Geographic Relevance | Impact Timeline |
|---|---|---|---|
| Escalating sports-rights inflation | -1.8% | United States and Europe | Short term (≤ 2 years) |
| Linear advertising revenue erosion | -1.5% | North America and Europe | Medium term (2-4 years) |
| Fragmented audience measurement standards | -0.7% | Global | Medium term (2-4 years) |
| Rising data-privacy compliance costs | -0.6% | European Union, California, worldwide extensions | Long term (≥ 4 years) |
| Source: Mordor Intelligence | |||
Escalating Sports-Rights Inflation
Average league-rights costs climbed 23% in 2024, as streaming entrants bid aggressively Amazon pays USD 1.2 billion annually for exclusive Thursday Night Football while Apple committed USD 2.5 billion across 10 years to global Major League Soccer. Such escalation crimps margins for networks reliant on volatile advertising revenue, prompting Warner Bros. Discovery to forgo its NBA renewal and leaving regional sports networks to grapple with shrinking pay-TV footprints.
Linear Advertising Revenue Erosion
Traditional television ad receipts fell 8.3% in 2024 to USD 61.8 billion as buyers preferred digital formats with better attribution. Paramount recorded a 12% domestic decline despite top-rated franchises, underscoring limited pricing power amid audience fragmentation. Broadcasters, in the broadcasting and cable TV market, now juggle investments into programmatic stacks while coping with lower revenue per thousand impressions than historical linear averages.
*Our forecasts treat driver/restraint impacts as directional, not additive. The impact forecasts reflect baseline growth, mix effects, and variable interactions.
Segment Analysis
By Delivery Platform: Cable Holds the Lead as Streaming Surges
Cable television generated USD 135.7 billion in 2025, translating into 35.51% of the broadcasting and cable TV market share. Subscriber erosion is undeniable, yet high-capacity DOCSIS 4.0 upgrades safeguard broadband-video bundles and preserve cash flow for infrastructure refreshes. Over-the-top services, by contrast, logged the fastest 7.86% CAGR and added 15.3 million net global subscribers across Netflix alone, proving the elasticity of demand when price and catalog breadth align.[2]Spencer Neumann, “Netflix Fourth Quarter 2024 Results,” Netflix Investor Relations, netflix.com Satellite and DTH continue to serve rural districts lacking fiber penetration, while IPTV thrives in Southeast Asian fiber corridors where telcos leverage zero-rating and aggressive pricing.
Streaming entrants’ relentless content spend forces cable operators to lean on regional news, live sports, and local advertising attributes that global subscription platforms cannot replicate easily. However, as NextGen TV broadens free, high-definition terrestrial options and smart-TV operating systems foreground apps over channels, the lifetime value of a traditional video account continues to slide. Consequently, operators are rebundling popular streaming tiers into account-based billing to slow attrition in the broadcasting and cable TV market.


By Revenue Model: Subscriptions Dominate but AVOD Accelerates
Subscriptions contributed 58.62% of broadcasting and cable TV market size in 2025, equating to roughly USD 224.1 billion, sustained by price increases across premium tiers and the bundling of non-video perks such as retail shipping or cloud storage. The November 2024 introduction of Netflix’s ad-supported plan rapidly amassed 40 million monthly actives, validating a hybrid model that captures price-sensitive cohorts while opening incremental ad inventory. AVOD’s 6.51% CAGR reflects the appeal of free, lean-back experiences such as Pluto TV and Tubi, both of which expanded internationally using lightweight licencing agreements and programmatic infrastructure.
Transactional pay-per-view retains relevance for marquee boxing and MMA bouts, with average UFC buys holding around 1.3 million per card in 2024, illustrating consumers’ willingness to pay à-la-carte for scarce events. Meanwhile, hybrid constructs combining base subscription access with optional AVOD channels are becoming commonplace in Asia Pacific mobile bundles, where carriers subsidize data in exchange for guaranteed ad reach.
By End User: Commercial Adoption Outpaces Household Growth
Residential audiences still generated 75.12% of total 2025 spending, but enterprises, campuses, and hospitality venues posted the sharpest 6.22% CAGR as streaming became integral to communications strategies. Fortune-500 firms delivered internal town-halls to 10,000-plus concurrent viewers through Microsoft Teams’ broadcast mode while maintaining encryption and identity management. Hospitals deployed on-demand libraries for patient education, and universities blended live lectures with asynchronous viewing, funded by federal digital-infrastructure grants.
Hospitality chains discovered that in-room casting options lifted guest satisfaction scores by 34% according to an American Hotel and Lodging Association survey. Advertisers, in the broadcasting and cable TV market, see opportunity in deploying context-aware signage within corporate atriums and lobbies, using the same OTT ad-tech stack to dynamically swap creative based on time of day or audience profile, thereby extending the traditional living-room model into commercial real estate.
By Content Genre: Entertainment Dominates while Sports Drives Premium Upside
Entertainment claimed 39.89% of 2025 spend, supported by serialized dramas, reality formats, and documentaries that travel well internationally when localized. Korean and Spanish-language originals now premiere as global events, demonstrating the pay-off from multi-local commissioning strategies. Sports, though smaller in revenue, grew the fastest at 7.78% CAGR fueled by the scarcity of live rights and uninterrupted audience attention spans. NFL 30-second spots fetched USD 7 million during 2024 prime fixtures, reinforcing a premium pricing spiral that underpins the genre’s expansion.
News and information programming saw episodic spikes during election cycles and geopolitical tensions, but engagement tapered faster once events passed. Children’s and educational segments benefited from parental demand for trusted, screen-time-worthy material; PBS Kids enhanced interactivity within its app, merging gamified lessons with linear streams. International producers, emboldened by AI dubbing, now target worldwide distribution from day one, gradually reducing dependence on Hollywood tent-poles.
Geography Analysis
North America represented 41.11% of 2025 revenue in the broadcasting and cable TV market, translating to USD 157.1 billion, and remains the epicenter for technology experimentation and early adopter behavior. United States households average 4.1 streaming subscriptions, enabling addressable ad scale and driving rapid uptake of hybrid bundles. Canadian regulations mandate reinvestment into domestic production, prompting U.S. streamers to co-produce local content and secure favorable carriage under the CRTC regime.[3]Government of Canada, “Broadcasting and Telecommunications Statistics 2024,” Statistics Canada, statcan.gc.ca Mexico’s growing middle class and bilingual audience drive cross-border syndication agreements, while favorable spectrum policies accelerate terrestrial HD roll-outs.
Asia Pacific delivers the fastest regional 7.97% CAGR, supported by exponential broadband penetration in India, Indonesia, and Vietnam. Chinese platforms iQIYI and Tencent Video collectively exceed 500 million subscribers, though content regulation and quota systems necessitate domestic ownership. India’s linguistic diversity propels AI localization demand, as Disney+ Hotstar and Reliance-backed JioCinema invest in multilingual originals to secure mass-market scale. Southeast Asian governments prioritize digital-economy pillars that subsidize fiber deployment, shortening payback cycles for IPTV roll-outs.
Europe balances mature Western markets with growth in Central and Eastern states. The Digital Services Act and GDPR impose strict consent and reporting standards, raising operating costs but also harmonizing cross-border data practices. In France and Germany, broadcasters leverage HbbTV to fuse linear and catch-up experiences, while the United Kingdom’s public-service broadcasters pool resources through joint streaming initiative “Freely” to compete with U.S. entrants. Eastern European markets are attracting investment from AVOD and FAST operators that exploit lower content costs and rising connected-TV uptake.
Latin America sees Brazil and Mexico leading subscription growth as telecom conglomerates bundle video with prepaid mobile plans, reducing churn and expanding addressable bases. Middle East and Africa remain nascent yet promising; Saudi Arabia funds local studios under Vision 2030, whereas Nigeria’s Nollywood output benefits from improved monetization through global streaming storefronts.

Competitive Landscape
The competitive field blends legacy conglomerates, tech titans, regional champions, and nimble start-ups, producing a moderate concentration in the broadcasting and cable TV market. The combined top-five share is roughly 55%, giving the segment a score of 6 on the concentration scale. Disney’s acquisition of Hulu’s remaining stake gives it full control of a tri-service ecosystem and deeper ad-tech synergies. Warner Bros. Discovery’s integration of HBO-branded prestige with Discovery’s unscripted trove illustrates portfolio economics that seek to maximize engagement hours.
Technology majors capitalize on operating-system control: Amazon’s Fire TV and Roku’s platform license models extract a share of in-app purchases and advertising, positioning them as toll-keepers. Netflix secures global reach through relentless content investment and a growing games unit that could extend engagement beyond passive video. Regional broadcasters form cross-border alliances Nordic streamers merged under Viaplay, and Latin American operators bundle with local telecoms to secure scale against cash-rich global peers.
Artificial-intelligence deployment underpins cost competitiveness and personalization, while cloud-based distribution lowers affiliate fees and unlocks rapid international expansion. Regulatory frameworks, especially around data protection and content-origin quotas, influence strategic roadmaps; companies able to localize quickly and comply with evolving privacy statutes gain a timing advantage. Sports rights, in the broadcasting and cable TV market, remain the ultimate differentiator but also the largest cost risk, forcing bidders to weigh subscriber acquisition against escalating license fees.
Broadcasting And Cable TV Industry Leaders
Comcast Corporation
Charter Communications Inc.
DISH Network Corporation
The Walt Disney Company
Discovery Inc.
- *Disclaimer: Major Players sorted in no particular order

Recent Industry Developments
- October 2025: Warner Bros. Discovery completed its USD 4.2 billion acquisition of Paramount's international streaming assets, including Paramount+ operations in Europe and Latin America, creating the largest global streaming content library outside of Netflix and significantly expanding its international subscriber base to over 180 million users worldwide.
- September 2025: Comcast announced a USD 15 billion infrastructure investment program through 2027 to deploy fiber-to-the-home technology across its entire cable network, enabling 25 Gbps internet speeds and supporting next-generation streaming services while positioning the company to compete directly with telecommunications providers in high-speed broadband markets.
- August 2025: Netflix launched its live sports streaming platform with exclusive rights to UEFA Champions League matches in North America, investing USD 3.8 billion over five years to compete directly with traditional sports broadcasters and marking the company's most significant expansion into live programming since its founding.
- July 2025: Disney completed the integration of Hulu + Live TV with Disney+ and ESPN+, creating a unified streaming ecosystem serving over 85 million subscribers and generating USD 2.1 billion in cost synergies through shared technology infrastructure and consolidated customer acquisition strategies


Global Broadcasting And Cable TV Market Report Scope
Broadcasting and Cable TV refers to the distribution of television programming (audio and video content) to a mass audience either through wireless transmission over the air (broadcasting) or via wired networks such as coaxial or fiber-optic cables (cable television).
The Broadcasting and Cable TV Market Report is Segmented by Delivery Platform (Cable TV, Satellite/DTH, IPTV, Over-The-Top Streaming), Revenue Model (Subscription, Advertising Supported, Transactional/Pay-Per-View, Hybrid Bundles), End User (Residential Households, Commercial and Institutional), Content Genre (Entertainment, Sports, News and Information, Kids and Education), and Geography (North America, South America, Europe, Asia Pacific, Middle East, Africa). The Market Forecasts are Provided in Terms of Value (USD).
| Cable TV |
| Satellite / DTH |
| IPTV |
| Over-The-Top (OTT) Streaming |
| Subscription |
| Advertising Supported |
| Transactional / Pay-Per-View |
| Hybrid Bundles |
| Residential Households |
| Commercial and Institutional |
| Entertainment |
| Sports |
| News and Information |
| Kids and Education |
| North America | United States |
| Canada | |
| Mexico | |
| South America | Brazil |
| Argentina | |
| Rest of South America | |
| Europe | United Kingdom |
| Germany | |
| France | |
| Italy | |
| Spain | |
| Russia | |
| Rest of Europe | |
| Asia Pacific | China |
| Japan | |
| India | |
| South Korea | |
| Australia and New Zealand | |
| Southeast Asia | |
| Rest of Asia Pacific | |
| Middle East | Saudi Arabia |
| United Arab Emirates | |
| Turkey | |
| Rest of Middle East | |
| Africa | South Africa |
| Nigeria | |
| Kenya | |
| Rest of Africa |
| By Delivery Platform | Cable TV | |
| Satellite / DTH | ||
| IPTV | ||
| Over-The-Top (OTT) Streaming | ||
| By Revenue Model | Subscription | |
| Advertising Supported | ||
| Transactional / Pay-Per-View | ||
| Hybrid Bundles | ||
| By End User | Residential Households | |
| Commercial and Institutional | ||
| By Content Genre | Entertainment | |
| Sports | ||
| News and Information | ||
| Kids and Education | ||
| By Geography | North America | United States |
| Canada | ||
| Mexico | ||
| South America | Brazil | |
| Argentina | ||
| Rest of South America | ||
| Europe | United Kingdom | |
| Germany | ||
| France | ||
| Italy | ||
| Spain | ||
| Russia | ||
| Rest of Europe | ||
| Asia Pacific | China | |
| Japan | ||
| India | ||
| South Korea | ||
| Australia and New Zealand | ||
| Southeast Asia | ||
| Rest of Asia Pacific | ||
| Middle East | Saudi Arabia | |
| United Arab Emirates | ||
| Turkey | ||
| Rest of Middle East | ||
| Africa | South Africa | |
| Nigeria | ||
| Kenya | ||
| Rest of Africa | ||


Key Questions Answered in the Report
How large is the Broadcasting and Cable TV market in 2026?
The Broadcasting and Cable TV market size is USD 401.15 billion in 2026 with a projected 4.81% CAGR to 2031.
Which delivery platform is growing fastest?
Over-the-top streaming shows the highest growth, registering a 7.86% CAGR through 2031.
Why are sports rights considered a restraint?
Rights fees jumped 23% in 2025, squeezing margins and forcing some broadcasters to exit high-cost leagues.
What is driving CTV advertising demand?
Household-level targeting and programmatic buying lifted CTV ad spend to USD 29.3 billion in 2025.
Which region offers the most upside through 2031?
Asia Pacific leads with a 7.97% CAGR, supported by rapid broadband expansion and rising middle-class incomes.
Page last updated on:


