
Brazil Plastic Waste Management Services Market Size and Share
Market Overview
| Study Period | 2020 - 2031 |
|---|---|
| Forecast Data Period | 2026 - 2031 |
| Base Year Market Size (2025) | USD 1.22 Billion |
| Market Size (2026) | USD 1.28 Billion |
| Market Size (2031) | USD 1.47 Billion |
| Growth Rate (2026 - 2031) | 2.81 % |
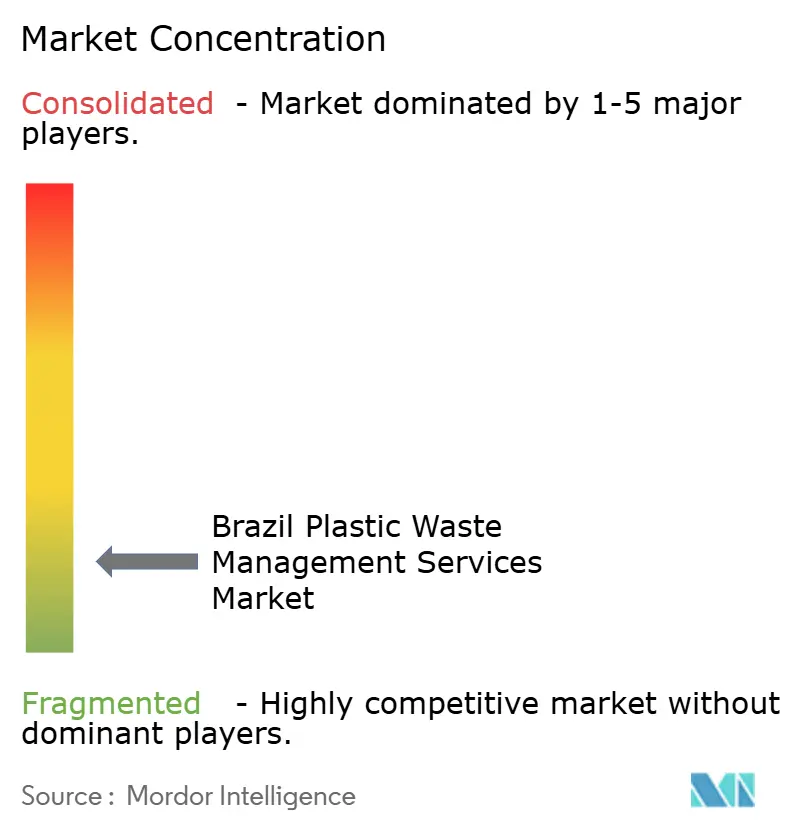
| Market Concentration | Low |
Major Players *Disclaimer: Major Players sorted in no particular order Image © Mordor Intelligence. Reuse requires attribution under CC BY 4.0. | |
Brazil Plastic Waste Management Services Market Analysis by Mordor Intelligence
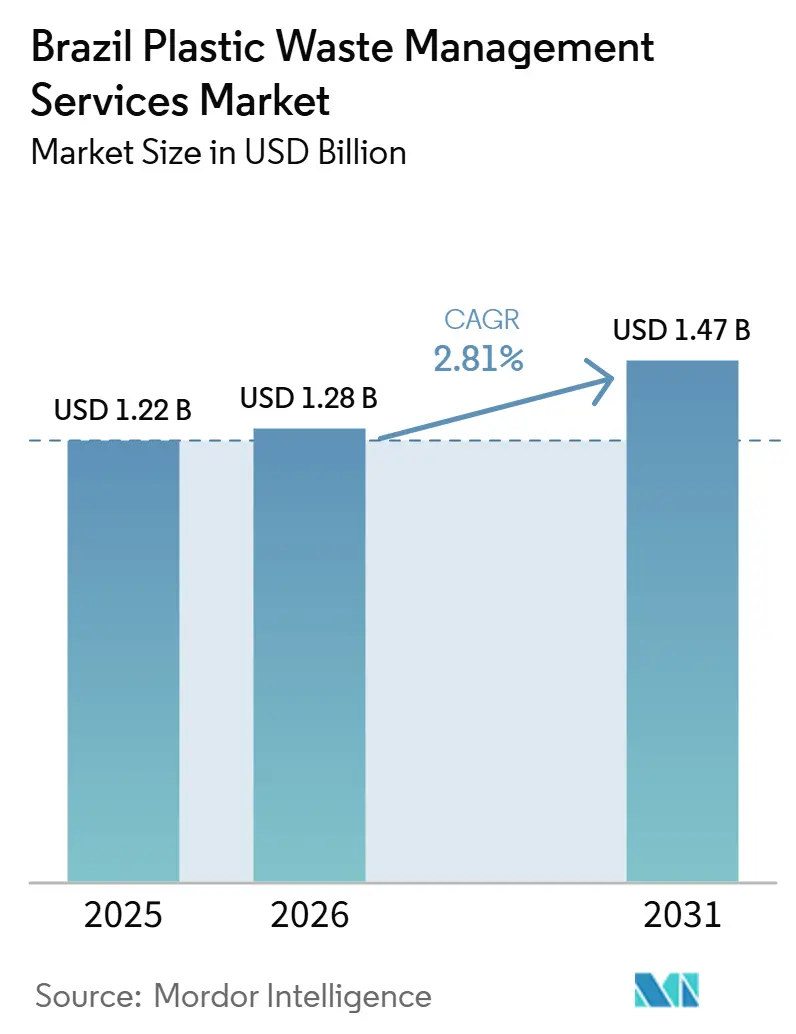
The Brazil Plastic Waste Management Services Market size is expected to increase from USD 1.22 billion in 2025 to USD 1.28 billion in 2026 and reach USD 1.47 billion by 2031, growing at a CAGR of 2.81% over 2026-2031.
Brazil generated 81.6 million tons of municipal solid waste in 2025, which keeps demand active across collection, sorting, treatment, and recovery services. Only 59.7% of collected waste reached proper sanitary landfills in 2025, while 40.3% still went to open dumps or inadequately controlled landfills, which shows that compliance still needs to support service demand across the country. Federal Decree No. 12,688/2025 made reverse logistics for plastic packaging mandatory and set a 32% recovery target for 2026, forcing the faster buildout of compliant collection and processing systems. The National Circular Economy Plan 2025-2034 is also widening the service mix by pushing recovery, reuse, and traceability across value chains, while demand is rising from agribusiness, food processing, and marine cleanup programs. As a result, the Brazil plastic waste management services market is moving beyond basic collection, and competitive advantage is shifting toward operators that can combine recovery, treatment, compliance reporting, and specialized downstream services into a single offering.
Key Report Takeaways
- By source, industrial held 40.8% of the Brazil plastic waste management services market share in 2025, while commercial is projected to grow at the fastest 4.6% CAGR through 2031.
- By service provider, public and municipal operators accounted for 47.2% of the Brazil plastic waste management services market size in 2025, while private waste management companies are set to record the highest 5.2% CAGR through 2031.
- By service type, collection, transportation, sorting, and segregation accounted for 45.4% in 2025, while disposal and treatment are forecast to expand at the fastest 5.8% CAGR through 2031.
Note: Market size and forecast figures in this report are generated using Mordor Intelligence’s proprietary estimation framework, updated with the latest available data and insights as of January 2026.
Brazil Plastic Waste Management Services Market Trends and Insights
Drivers Impact Analysis*
| Driver | (~) % Impact on CAGR Forecast | Geographic Relevance | Impact Timeline |
|---|---|---|---|
| Expansion of Waste-to-Energy Projects for Non-Recyclable Plastics | +0.7% | Southeast, especially São Paulo and Santa Catarina, with expansion to Central-West | Medium term (2-4 years) |
| Closure of Open Dumpsites and Transition to Engineered Landfills | +0.6% | North and Northeast, with national relevance under PNRS | Short term (≤ 2 years) |
| Increasing Co-processing of Plastic Waste in the Cement Industry | +0.5% | São Paulo, Espírito Santo, and Minas Gerais | Medium term (2-4 years) |
| Expansion of Food and Beverage Manufacturing Clusters | +0.4% | Southeast and South industrial corridors, with spillover to the Northeast export zones | Medium term (2-4 years) |
| Growing Demand for Agricultural Plastic Waste Recovery | +0.3% | Central-West and South agribusiness areas | Short term (≤ 2 years) |
| Growing Demand for Ocean and River Plastic Cleanup Services | +0.2% | Coastal states, including Rio de Janeiro, São Paulo, Pernambuco, and Pará | Long term (≥ 4 years) |
| Source: Mordor Intelligence | |||
Expansion of Waste-to-Energy (WtE) Projects for Non-Recyclable Plastics
Non-recyclable plastic streams still move into landfill channels in many parts of Brazil because they are contaminated, multilayered, or unsuitable for standard mechanical recycling.[1]ABREMA, “Panorama of Solid Waste in Brazil 2025,” Brazilian Association of Waste Management Companies, abrema.org.br In the Brazil plastic waste management services market, waste-to-energy is becoming one of the few scalable options for that residual fraction, especially where landfill pressure is already high. Brazil already directed 11.7% of the total waste generated to bioenergy recycling in 2025, indicating that thermal and energy recovery routes are no longer marginal in the country’s waste system. This shift also increases the value of better sorting, fuel preparation, and feedstock control, as operators need cleaner residual streams before they can move them into energy recovery systems. The strongest effect remains concentrated in areas with stronger concession structures and higher waste density, which is why the Southeast remains the first commercial testing ground for these projects.
Closure of Open Dumpsites and Transition to Engineered Landfills
The Brazil plastic waste management services market continues to benefit from dump-closure mandates, as 31.9% of municipalities still use open dumps as their main final disposal site in the MUNIC 2023 survey.[2]IBGE, “In 2024, Waste Collection Reaches 93% of Housing Units, but 4.7 Million Still Burn Waste,” IBGE News Agency, agenciadenoticias.ibge.gov.br When a municipality closes an open dump, it usually has to contract for compliant collection, transfer, and disposal services simultaneously, which increases the size of bundled service contracts. PLANARES set a target to recover 48% of urban solid waste by 2040, starting from an 8.7% mechanical recycling base in 2025, so the required pace of system improvement remains high. That gap supports new demand not only for landfill infrastructure, but also for route design, transfer operations, segregation, and compliance monitoring. Smaller regional operators can still serve local markets, but the need to finance licensed infrastructure tends to favor companies that already offer multiple services on a single platform.
Increasing Co-processing of Plastic Waste in the Cement Industry
The market is also gaining support from higher co-processing demand in cement kilns, where plastic-rich waste can replace part of fossil fuel use and a portion of the mineral feed. Brazil already has standardized licensing and strict emissions controls for kiln co-processing, reducing regulatory uncertainty for qualified operators. The cement sector’s thermal substitution rate remains at 15% to 25%, well below European levels of 60% to 80%, leaving significant room for expansion of refuse-derived fuel supply chains. In 2025, Brazil sent 130,500 tons of municipal solid waste to RDF production units and produced 43,000 tons of usable RDF, confirming that this route already operates at scale. The economies are strongest in São Paulo, Espírito Santo, and Minas Gerais, as these states combine major clinker output with dense industrial waste streams, reducing transport costs and improving service viability.
Expansion of Food and Beverage Manufacturing Clusters
The Brazil plastic waste management services market is being supported by packaging-heavy production growth in the food and beverage chain. Brazil’s plastic industry produced 7.46 million tons in 2024, up 6.3% year on year, with packaging remaining the largest volume category and the main link between manufacturing activity and downstream plastic waste generation.[3]CONAMA, “Resolução CONAMA Nº 499,” National Environmental Council, conama.mma.gov.br As food and beverage clusters expand, they increase the volume and frequency of plastic waste-handling contracts across factories, warehouses, and distribution networks. They also increase the need for more reliable sorting and food-grade recycling capacity, as packaging users require cleaner recycled content streams. Brazil’s plastics sector plans to invest USD 5.7 billion between 2025 and 2027, and that pipeline should keep industrial and commercial waste volumes active beyond the current forecast period.
Restraints Impact Analysis*
| Restraint | (~) % Impact on CAGR Forecast | Geographic Relevance | Impact Timeline |
|---|---|---|---|
| Fragmented Municipal Waste Collection Infrastructure | -0.7% | North and Northeast, with smaller municipalities nationwide also affected | Short term (≤ 2 years) |
| Dependence on the Informal Sector for Plastic Waste Collection | -0.6% | National, with a stronger effect in Southeast and Northeast | Medium term (2-4 years) |
| High Contamination Levels in Mixed Plastic Waste Streams | -0.4% | National, especially in areas with low source separation | Medium term (2-4 years) |
| Insufficient Processing Capacity for Multi-Layer and Flexible Plastics | -0.3% | National, with a limited concentration of capability in the São Paulo metro | Long term (≥ 4 years) |
| Source: Mordor Intelligence | |||
Fragmented Municipal Waste Collection Infrastructure
The Brazil plastic waste management services market still faces a basic structural limit because waste collection is managed across 5,570 municipalities under very different operating models. National household coverage reached 93.1% in 2025, but rural coverage was only 33.1%, and the North and Northeast remained more than 10 percentage points below the national level. Low route density in smaller municipalities makes it harder to justify dedicated plastic collection and segregation systems, as recoverable volumes often remain too low for efficient processing. This problem is worse where local budgets remain tight and solid waste spending cannot support integrated collection upgrades without outside finance or shared regional systems. Until those gaps narrow, service quality will continue to differ sharply across municipalities, and scale benefits will remain concentrated in stronger urban markets.
Dependence on the Informal Sector for Plastic Waste Collection
The Brazil plastic waste management services market relies heavily on informal waste pickers, who collected 64.8% of all recyclable dry waste in 2025. Data compiled by the International Alliance of Waste Pickers showed that more than 281,000 catadores are formally registered in Brazil. At the same time, broader estimates from the National Movement of Brazilian Waste Pickers place the total much higher, given that informal work remains widespread. This network keeps material flowing into the recycling chain, but it also introduces uneven sorting quality, inconsistent contamination control, and inconsistent reporting discipline. Those gaps matter more in light of Decree No. 12,688/2025 and SINIR guidance, as recovery systems now require stronger traceability and more reliable proof of compliance. Lower-value streams such as flexible films and multilayer packaging remain the hardest to collect consistently, leaving more of them in mixed waste and cutting processor revenue per ton.
*Our forecasts treat driver/restraint impacts as directional, not additive. The impact forecasts reflect baseline growth, mix effects, and variable interactions.
Segment Analysis
By Source: Industrial Generators Lock Scale Advantages While Commercial Contracts Accelerate
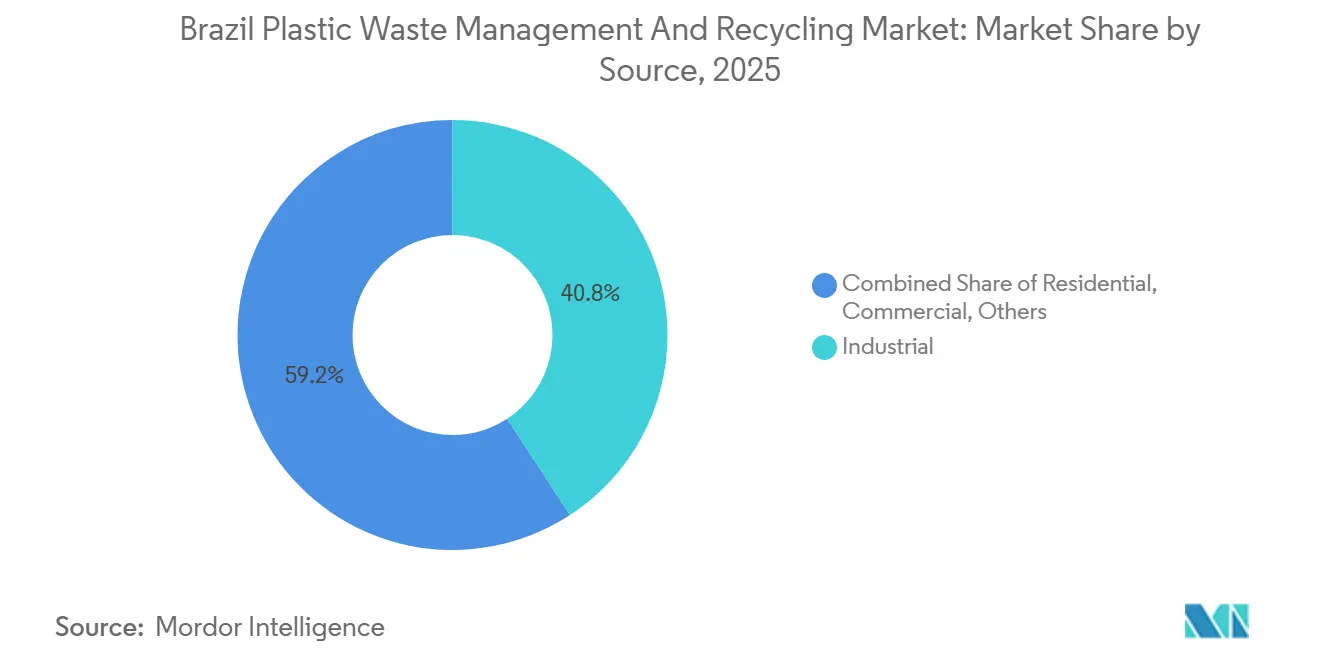
Industrial sources accounted for 40.8% of the Brazil plastic waste management services market share in 2025, making them the largest segment. The segment’s lead reflects Brazil’s large manufacturing base and the concentration of plastic-intensive industries in states such as São Paulo, Santa Catarina, and Rio Grande do Sul. Large industrial generators also face direct disposal obligations under the National Solid Waste Policy, which keeps demand for licensed service providers relatively stable. Brazil’s plastic industry produced 7.46 million tons of plastic products in 2024. It generated BRL 164 billion in revenue, equivalent to USD 30 billion, while planned sector investment of USD 5.7 billion through 2027 should sustain industrial waste flows.
Commercial sources are projected to grow at a 4.6% CAGR through 2031, which makes them the fastest-rising source category in the Brazil plastic waste management services market. Growth is tied to formal retail networks, food service expansion, and rising packaging volumes across trade and distribution points. Residential waste remains broadly distributed, but its plastic fraction is often more contaminated because selective collection reached only 60.5% of Brazilian cities in the MUNIC 2023 survey. The other segment is also becoming more visible as reverse logistics systems expand across agricultural and institutional streams, creating new service needs beyond traditional household and factory routes.



By Service Provider: Public Dominance Masking Private Momentum
Public and municipal operators accounted for 47.2% of the market in 2025, maintaining their lead by provider category. That result reflects Brazil’s legal structure, in which municipalities remain primarily responsible for solid waste management, even when they outsource day-to-day operations. In practice, the public share also captures some of the value created by private contractors, as many contracts are still booked under the municipal service sphere. This means the visible lead of the public segment does not fully represent who controls the most advanced treatment, recovery, and specialized service assets on the ground.
Private waste management companies are forecast to grow at a 5.2% CAGR through 2031, giving them the fastest expansion pace among providers in the Brazil plastic waste management services market. Their momentum comes from concession awards, growth in public-private partnerships, and stronger demand for integrated operators capable of handling collection, processing, and recovery. IFC’s 2025 investment in America Embalagens also showed that producer-linked circular economy platforms are gaining institutional backing as the market formalizes.
By Service Type: Collection Anchors Revenue, Treatment Segment Accelerates
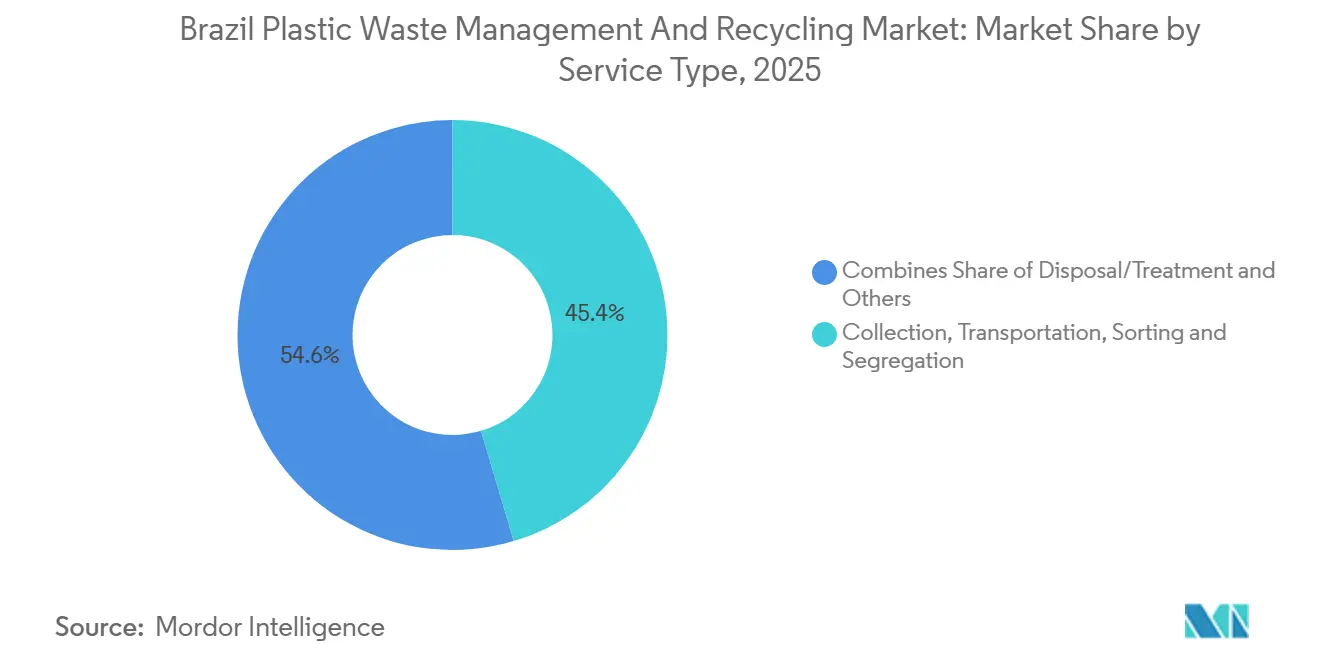
Collection, transportation, sorting, and segregation services accounted for 45.4% of the market in 2025, making them the revenue base of the Brazilian plastic waste management services industry. The segment remains the largest because Brazil has built a broader basic collection coverage than downstream recycling and recovery capacity. In 2024, only 8.7% of municipal solid waste was sent for mechanical recycling, indicating that the system is still much stronger at collecting waste than at processing it into new material. Multi-year municipal contracts also support this segment by providing a stable operating base even when treatment investment follows a more uneven cycle.
Disposal and treatment services are forecast to grow at a CAGR of 5.8% through 2031, giving this segment the strongest growth profile among service types in the Brazil plastic waste management services market. New value is shifting toward recycling, recovery, landfill upgrades, and energy-linked treatment routes, driving this growth. Brazil recycled 1.55 million tons of plastic waste in 2024, a 7.2% increase from 2023, generating USD 726 million in industry revenue and supporting more than 20,000 direct jobs. The others segment, which covers services such as compliance support, auditing, and training, is also gaining relevance as reporting and verification duties become stricter under the new plastic reverse logistics framework.
Geography Analysis
The Southeast accounted for 49.2% of national municipal solid waste generation in 2024 and had a 98.9% collection coverage rate, keeping it at the center of the Brazil plastic waste management services market by region. São Paulo remains the country’s main operating hub because it concentrates licensed operators, large industrial generators, and the earliest large-scale recovery projects. The South follows closely behind in operating maturity, with a 97.3% collection rate and strong agro-industrial activity, which support steady flows of packaging and post-industrial plastics. Together, these two regions offer the strongest route density, better infrastructure use, and the clearest path for advanced service expansion.
The North and Northeast had collection coverage rates of 83.7% and 84.0% in 2024, while improper disposal reached 61.3% in the North and 55.3% in the Northeast. Those figures show why both regions remain less developed in terms of current operating quality, but are more open to new contract formation. As municipalities replace weak collection and disposal systems, they create room for private operators with capital and licensing capacity to enter. Veolia’s May 2025 acquisition of Alagoas Ambiental and Serquip Tratamentos Resíduos AL shows that the Northeast is now attracting direct strategic expansion rather than being treated as a delayed opportunity. The regional gap is therefore not only a service challenge but also one of the clearest long-term growth opportunities in the Brazil plastic waste management services market.
The Central-West had a 95.5% collection rate in 2024, but its improper disposal rate remained 54.2%, indicating that coverage alone does not guarantee adequate final treatment. Its role is distinct because agribusiness generates specialized plastic streams that require recovery systems distinct from those for ordinary household waste. At the national level, demand for coastal and riverine cleanup is also beginning to shape geography, as the ENOP strategy for 2025-2030 has spurred a formal policy push for plastic removal and remediation in states such as Rio de Janeiro, São Paulo, Pernambuco, and Pará. This means regional development will not depend solely on municipal solid waste volumes, but also on the rise of agriculture- and marine-linked service lines within the Brazil plastic waste management services market.
Competitive Landscape
The Brazil plastic waste management services market remains fragmented in upstream collection and sorting, but it is consolidating in treatment, recovery, and other higher-value service layers. Municipal contracting remains dispersed across thousands of local authorities, while informal aggregators continue to influence material flows at the front end. This structure gives larger integrated operators an advantage because they can spread compliance, processing, and reporting costs across a broader asset base. Traceability is becoming increasingly important as producers and municipalities face stricter reporting requirements under the plastic reverse logistics system.
Strategic moves by major players indicate how the Brazil plastic waste management services market is evolving. Veolia expanded its licensed treatment footprint in the Northeast by acquiring Alagoas Ambiental and Serquip Tratamentos Resíduos AL, strengthening its regional platform beyond its established bases. In 2024, Dow and Ambipar signed an agreement to build an integrated polyethylene circular economy center in Brazil, targeting 80,000 tons of plastic waste input and 60,000 tons per year of post-consumer recycled polyethylene output. This move shows that upstream resin producers are entering the service chain to secure recovered material, rather than only promoting recycling targets from a distance. IFC’s 2025 investment in America Embalagens would point in the same direction, as it supports circular packaging supply chains and strengthens mid-sized operators linked to material recovery.
Service gaps remain wide in flexible and multilayer plastics, which current infrastructure still struggles to process at scale. The same is true for agricultural plastics outside the best-established reverse logistics streams. Operators that can document volumes in real time, prove compliance, and connect multiple service steps are likely to win the most attractive contracts in the Brazil plastic waste management services market. Competition is therefore shifting away from basic collection alone and toward the ability to combine collection, treatment, recovery, and reporting into a single credible operating model.
Brazil Plastic Waste Management Services Industry Leaders
Ambipar
Orizon Valorização de Resíduos
Solví Participações (Grupo Solví)
Estre Ambiental
Veolia Environnement S.A.
- *Disclaimer: Major Players sorted in no particular order

Recent Industry Developments
- May 2025: Veolia Environnement completed the acquisition of Alagoas Ambiental and Serquip Tratamentos Resíduos AL in Brazil's Northeast, approved by CADE, extending Veolia's Brazilian footprint beyond São Paulo and Santa Catarina and positioning it as one of the first major international operators to establish licensed treatment capacity in the Alagoas market.
- October 2025: Brazil's federal government published Decree No. 12,688/2025, the "Plastic Decree," establishing a mandatory reverse logistics system for plastic packaging as the 14th reverse logistics system under PNRS, setting a 32% recovery target for 2026 and a 22% recycled content mandate, creating binding compliance obligations for producers, importers, distributors, and retailers.
- October 2025: President Lula signed the decree establishing the National Strategy for a Plastic-Free Ocean, ENOP, for 2025-2030, coordinated by the Ministry of Environment and Climate Change with the Brazilian Navy, IBAMA, ICMBio, and Ministries of Science, Fisheries, and Industry. ENOP includes eight action axes covering removal, remediation, and financing, formally creating a government-backed demand signal for ocean and river plastic cleanup services.


Brazil Plastic Waste Management Services Market Report Scope
The Brazil Plastic Waste Management Service Market Report is Segmented by Source (Residential, Commercial, Industrial, and Others), by Service Provider (Public/Municipal, Private Waste Management Companies, and Others), by Service Type (Collection, Transportation, Sorting & Segregation, Disposal / Treatment, and Others). The Market Forecasts are Provided in Terms of Value (USD).
| Residential |
| Commercial (Retail, Office, etc.) |
| Industrial |
| Others (Institutional, Agricultural, etc) |
| Public/Municipal |
| Private Waste Management Companies |
| Others - Producer Responsibility Organizations (PROs), etc. |
| Collection, Transportation, Sorting & Segregation | |
| Disposal / Treatment | Landfill |
| Recycling & Resource Recovery | |
| Incineration & Waste-to-Energy | |
| Others (Chemical Treatment, etc.) | |
| Others (Consulting, Audit & Training, etc.) |
| By Source | Residential | |
| Commercial (Retail, Office, etc.) | ||
| Industrial | ||
| Others (Institutional, Agricultural, etc) | ||
| By Service Provider | Public/Municipal | |
| Private Waste Management Companies | ||
| Others - Producer Responsibility Organizations (PROs), etc. | ||
| By Service Type | Collection, Transportation, Sorting & Segregation | |
| Disposal / Treatment | Landfill | |
| Recycling & Resource Recovery | ||
| Incineration & Waste-to-Energy | ||
| Others (Chemical Treatment, etc.) | ||
| Others (Consulting, Audit & Training, etc.) | ||


Key Questions Answered in the Report
What is the 2031 value forecast for plastic waste management services in Brazil?
The sector is forecast to reach USD 1.47 billion by 2031, up from USD 1.28 billion in 2026, with a 2.81% CAGR over 2026-2031.
What is driving growth in this sector in Brazil?
The main drivers are mandatory reverse logistics for plastic packaging, the need for dump closure, rising demand for recovery and treatment, and broader circular-economy policies.
Which source segment generates the most revenue?
Industrial sources led in 2025 with a 40.8% share because large generators require licensed service providers, and Brazil has a large manufacturing base.
Which provider type is growing the fastest?
Private waste management companies are expected to grow the fastest, at a 5.2% CAGR through 2031, as concessions and integrated service models expand.
Which service type is expanding the fastest?
Disposal and treatment are projected to grow the fastest, at a 5.8% CAGR, as recycling, recovery, and advanced treatment capacity scale up.
Which region is most important for operations?
The Southeast is the core operating region because it generated 49.2% of municipal solid waste in 2024 and had 98.9% collection coverage.
Page last updated on:





