Botanical Ingredients Market Size and Share
Market Overview
| Study Period | 2021 - 2031 |
|---|---|
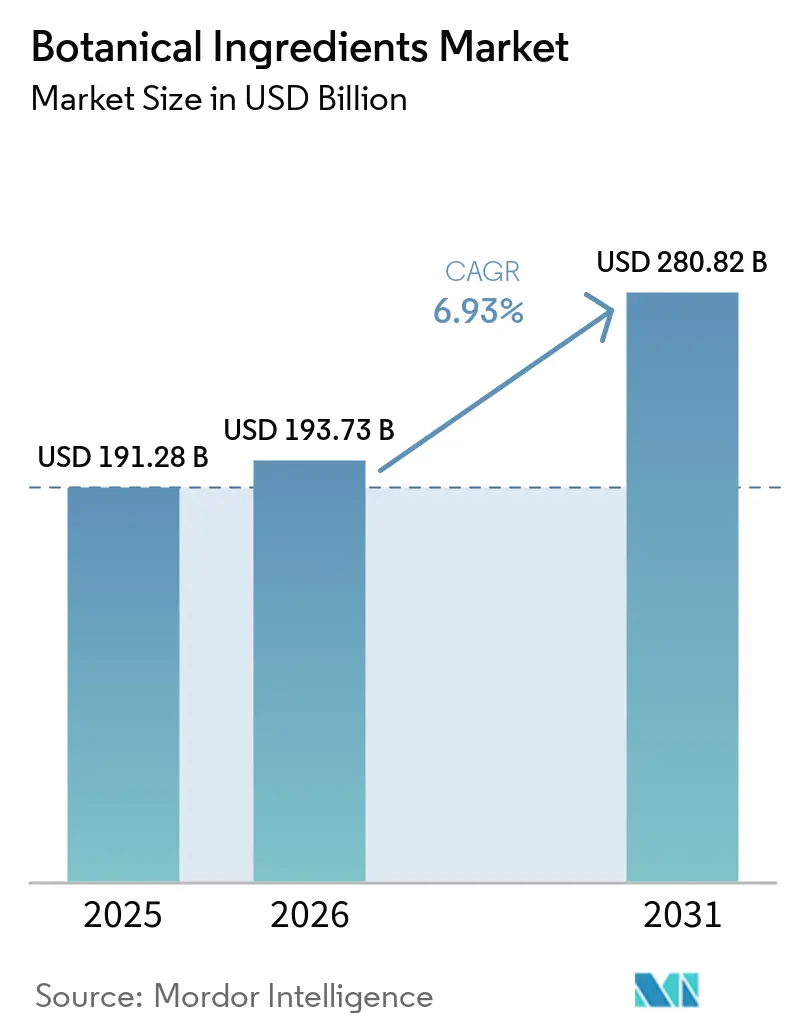
| Market Size (2026) | USD 193.73 Billion |
| Market Size (2031) | USD 280.82 Billion |
| Growth Rate (2026 - 2031) | 6.93% CAGR |
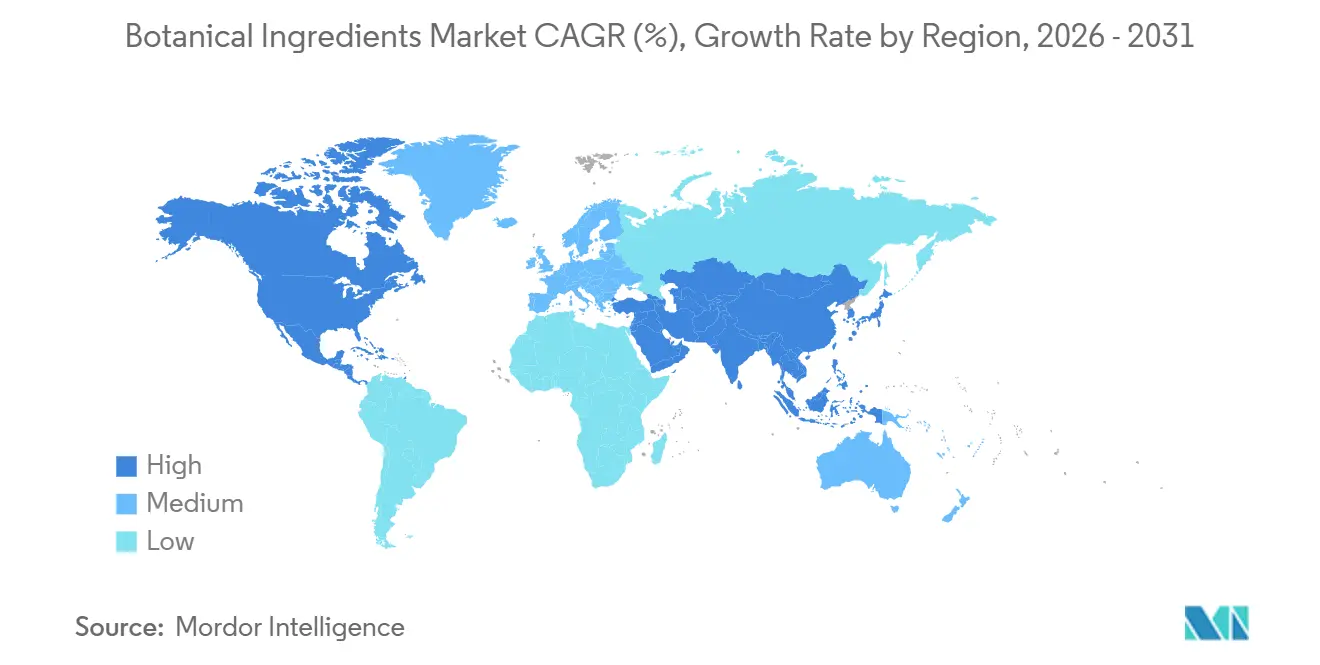
| Fastest Growing Market | Asia-Pacific |
| Largest Market | North America |
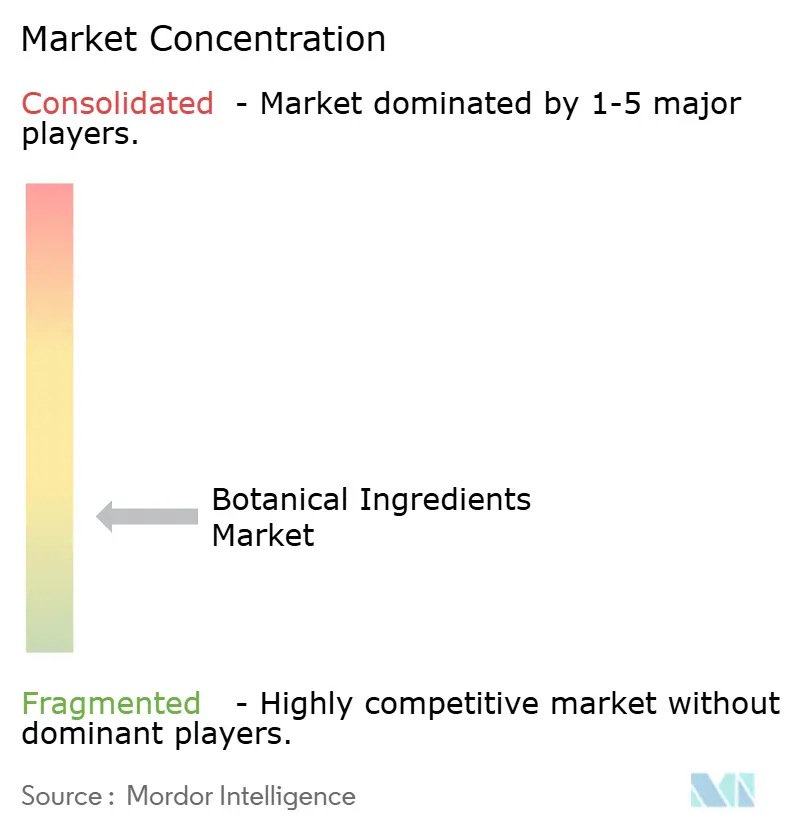
| Market Concentration | Low |
Major Players *Disclaimer: Major Players sorted in no particular order Image © Mordor Intelligence. Reuse requires attribution under CC BY 4.0. | |
Botanical Ingredients Market Analysis by Mordor Intelligence
The botanical ingredients market size is expected to grow from USD 191.3 billion in 2025 to USD 193.7 billion in 2026 and is forecast to reach USD 270.8 billion by 2031 at 6.9% CAGR over 2026-2031. The botanical ingredients market is being supported by reformulation activity across food, personal care, and dietary supplements, as brands replace synthetic colors, stabilizers, and bioactives with plant-based alternatives. Demand is also widening beyond consumer goods because pharmaceutical producers are increasing their use of standardized herbal ingredients and phytomedicine inputs, which expands the addressable base for the botanical ingredients market. The botanical ingredients market is also being shaped by a dual Asia-Pacific role, where the region supplies critical raw materials while also becoming a larger end market, which raises both growth potential and sourcing exposure. Traceability rules, quality documentation, and origin verification now matter more in supplier selection, which favors integrated producers that can document farm-level sourcing and maintain specification consistency. Competition remains broad, with global ingredient groups, specialized extractors, and origin-country manufacturers all active, and that keeps the botanical ingredients market moderately fragmented.
Key Report Takeaways
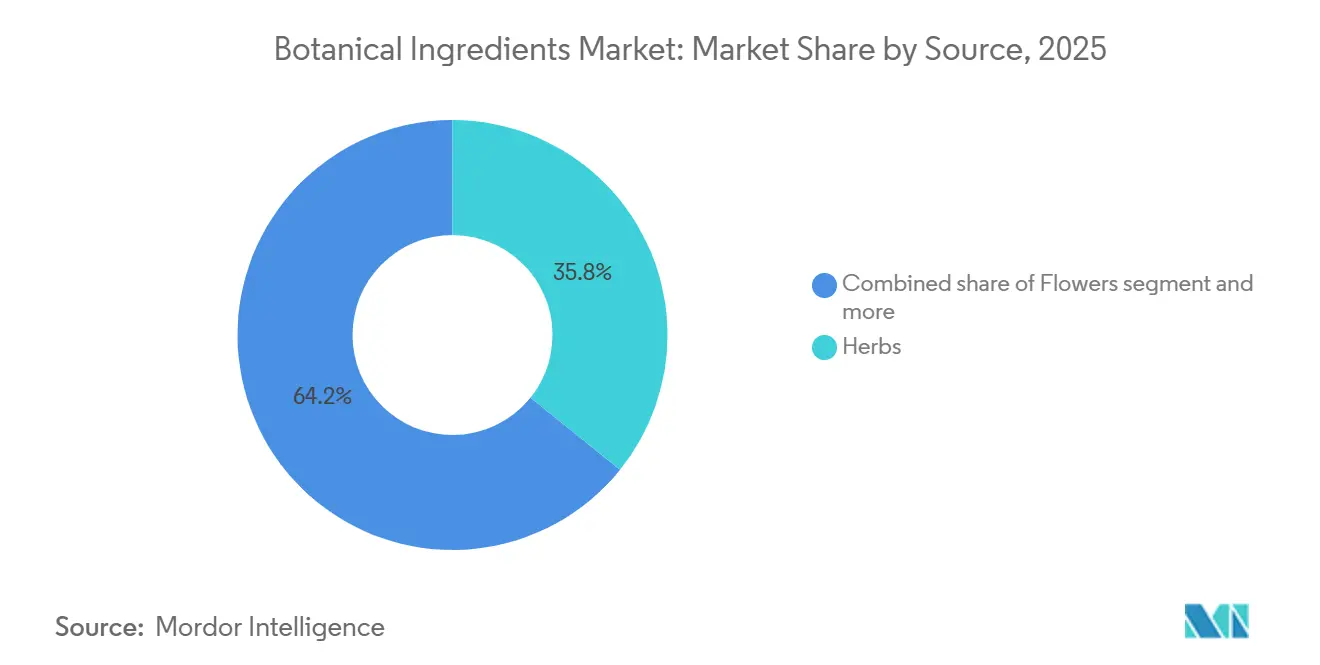
- By source, herbs accounted for the largest share of the botanical ingredients market, at 35.8% in 2025, while flowers are projected to grow at the fastest CAGR of 8.0% during 2026-2031.
- By form, powder led the botanical ingredients market with a share of 59.7% in 2025, while liquid is anticipated to register the fastest CAGR of 7.8% during 2026-2031.
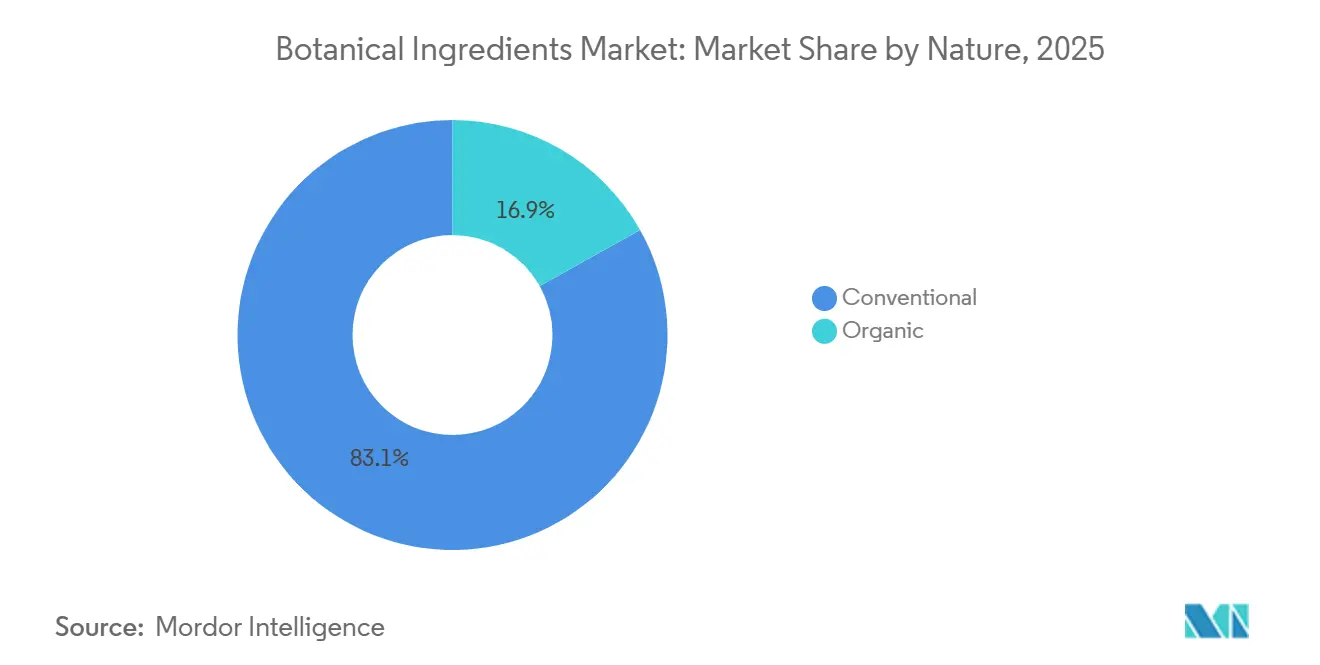
- By nature, conventional products retained 83.1% share of the botanical ingredients market in 2025, whereas organic products are forecast to expand at an 8.0% CAGR through 2031.
- By application, food and beverages accounted for the largest share of the botanical ingredients market, at 33.7% in 2025, while cosmetics and personal care are projected to grow at the fastest CAGR of 7.7% during 2026-2031.
- By geography, North America accounted for the largest share of the botanical ingredients market, at 34.4% in 2025, while Asia-Pacific is projected to grow at the fastest CAGR of 8.0% during 2026-2031.
Note: Market size and forecast figures in this report are generated using Mordor Intelligence’s proprietary estimation framework, updated with the latest available data and insights as of January 2026.
Global Botanical Ingredients Market Trends and Insights
Drivers Impact Analysis*
| Driver | (~) % Impact on CAGR Forecast | Geographic Relevance | Impact Timeline |
|---|---|---|---|
| Growing Demand for Clean-Label and Plant-Based Formulations | +1.8% | Global | Short term (≤ 2 years) |
| Expansion of Functional Nutrition and Preventive Wellness | +1.5% | Global, led by North America, Europe, and the Asia-Pacific core | Medium term (2–4 years) |
| Premiumization of Botanical Actives in Beauty and Dermaceuticals | +1.2% | North America and Europe; spill-over to Asia-Pacific | Medium term (2–4 years) |
| Traceability Requirements Are Becoming a Commercial Differentiator | +0.8% | Europe and North America core, expanding globally | Long term (≥ 4 years) |
| Climate-Driven Supply Squeezes Reward Vertically Integrated Suppliers | +0.5% | Global (South Asia, MEA, Southeast Asia origin markets) | Medium term (2–4 years) |
| Regulatory Support for Traditional Medicine and Natural Claims | +0.6% | Asia-Pacific, South America, and Europe | Long term (≥ 4 years) |
| Source: Mordor Intelligence | |||
Growing demand for clean-label and plant-based formulations
FMCG manufacturers are feeling the heat from consumers pushing for the removal of undeclared additives, synthetic stabilizers, and artificial dyes. As a result, herbal ingredients and plant-based extracts have become indispensable in product reformulations. Purchasing managers have shifted their approach, now routinely verifying the botanical origin of ingredients during procurement, elevating it from a mere premium consideration. The Netherlands Enterprise Agency (CBI) reported that in 2024, European imports of botanical extracts reached EUR 1.2 billion. This figure has been growing at an average annual rate of 3.1% from 2020 to 2024[1]Source: Centre for the Promotion of Imports, “Botanical Extracts in Europe,” CBI, cbi.eu. Notably, Germany, Italy, France, Spain, and the Netherlands together made up 64% of the total import volume. Analyzing this data reveals a notable trend: European botanical processors are facing disintermediation. Manufacturers from origin countries like India and Southeast Asia are now directly supplying branded, specification-grade extracts to CPG companies. This shift is not only compressing margins for European distributors but also pushing traditional European processors to focus on differentiating their offerings through standardization, quality, and clinical documentation, rather than relying solely on geographic proximity.
Expansion of functional nutrition and preventive wellness
In developed markets, aging populations and, in emerging economies, a health-conscious demographic are driving a steady demand for botanical supplements and functional foods, especially those with clinically proven benefits. Unlike traditional post-illness remedies, today's consumers are proactively turning to daily adaptogens, immune-boosting herbs, and digestive botanicals. This consistent demand not only underscores the market's resilience but also its stability across economic fluctuations. A 2025 review in Pharmacology highlighted that climate change is already impacting the potency and consistency of raw botanical ingredients. As a result, manufacturers who invest in controlled-environment cultivation and stringent quality checks are poised to gain premium specifications, outpacing those relying on wild-harvested ingredients. This shift is particularly advantageous for deep-science experts like Indena S.p.A. and Sabinsa Corporation, setting them apart from traditional commodity extract brokers.
Premiumization of botanical actives in beauty and dermaceuticals
Beauty and personal care brands are increasingly turning to clinically validated botanical actives, not just for their premium pricing but also to bolster their clean-beauty credentials. This shift is evident in their research and development choices, rather than mere marketing tweaks. In March 2026, Robertet made a strategic move by investing in Aethera Biotech[2]Source: Robertet, “News and Press Releases,” Robertet, robertet.com. This partnership aims to commercialize cosmetic actives using the multi-patented CROP (Controlled Release of Optimized Plants) biotechnology platform. Such moves highlight how fragrance and natural product companies are safeguarding against climate-sensitive harvesting by pivoting towards controlled-environment botanical production. In another significant move, The Estée Lauder Companies announced in March 2026 that it would acquire the remaining stakes in Forest Essentials. This brand, a premium Ayurveda beauty label from India, is renowned for its vertically integrated botanical sourcing. Such acquisitions underscore that global beauty giants view botanical heritage as a valuable asset on their balance sheets, rather than just a narrative for branding. Given these developments, the cosmetics and personal care segment's projected 7.72% CAGR through 2031 signals a deeper demand. It's not just about channel growth; it's a testament to the heightened emphasis on the science and provenance of plant-derived actives.
Regulatory support for traditional medicine and natural claims
Governments in China, India, Japan, and ASEAN nations are increasingly recognizing traditional medicine systems. This endorsement is bolstering the commercial prospects of botanical actives, especially those with a long-standing history in Ayurvedic, Traditional Chinese Medicine (TCM), and Kampo formulations. In Brazil, biodiversity legislation, in tandem with the Nagoya Protocol compliance frameworks, is offering commercial incentives. These incentives, rooted in benefit-sharing models, legitimize bioprospecting access. Furthermore, the documentation barriers established by these frameworks serve as competitive advantages for well-resourced ingredient companies. Highlighting this trend, IFF's August 2025 collaboration with Reservas Votorantim grants IFF exclusive bioprospecting rights to nearly 1,000 flora species spread over 31,000 hectares in Brazil's Legado das Águas Atlantic Forest reserve. This move underscores the perspective of the Nagoya Protocol, not merely as a compliance hurdle, but as a valuable sourcing privilege. Concurrently, Debut and Natura's partnership in May 2026, aims to commercialize AI-discovered longevity actives. By merging cutting-edge bioactive discovery with the rich heritage of Amazonian botanicals, they exemplify the fusion of modern digital ingredient discovery with age-old ecological wisdom, paving the way for distinct product differentiation.
Restraints Impact Analysis*
| Restraint | (~) % Impact on CAGR Forecast | Geographic Relevance | Impact Timeline |
|---|---|---|---|
| Raw Material Yield Volatility Across Botanical Harvest Cycles | -0.8% | Global (South Asia, MEA, Southeast Asia origin markets) | Medium term (2–4 years) |
| Adulteration Risk Raises Testing and Compliance Costs | -0.6% | Global; heightened in North America and Europe import channels | Short term (≤ 2 years) |
| Fragmented Standards for Potency, Residual Solvents, and Claims | -0.4% | Europe and North America | Long term (≥ 4 years) |
| Supply Chain Complexity in Multi-Origin Sourcing Models | -0.5% | Global | Medium term (2–4 years) |
| Source: Mordor Intelligence | |||
Raw material yield volatility across botanical harvest cycles
Climate-driven harvest variability poses significant challenges to botanical supply chains, which struggle to self-correct. Most commercially vital species produce only one viable harvest annually, leading to compounded production shortfalls throughout the year's procurement cycle. Flavor Chem's Q2 2026 Raw Material Report highlighted a looming shortfall: the 2026 nutmeg harvest is set to fall short of global demand. Meanwhile, lemongrass cultivation areas have shrunk, as farmers pivot to more lucrative food crops. In April 2026, the confirmed onset of an El Niño event began to dampen Patchouli Oil output in Sulawesi, Indonesia. This region is pivotal in the global botanical market. In response, ingredient manufacturers there have adopted stringent air-drying protocols to uphold quality standards amidst the challenges. Ingredient buyers have evolved their strategies; once seen as risk-mitigation tactics, forward contracting, multi-region sourcing, and ties with vertically integrated growers are now essential operational norms. Companies lacking these strategies grapple with significant pricing volatility, jeopardizing their margin projections.
Adulteration risk raises testing and compliance costs
Botanical ingredient adulteration poses a significant risk in the supply chain. In July 2025, the Botanical Adulterants Prevention Program (BAPP) released a bulletin highlighting issues like species mix-ups, undeclared Echinacea varieties, and unauthorized Cistanche substitutions in the commercial echinacea supply. Such practices not only mislead consumers but also breach CITES Appendix II trade regulations[3]Source: American Botanical Council, “Botanical Adulterants Prevention Program,” HerbalGram, herbalgram.org. The FDA has updated its import guidance for dietary supplement botanical ingredients from China. Now, imports must undergo thorough HPLC-MS chemical fingerprinting. This marks a pivotal shift from merely checking identity and potency to a comprehensive compositional analysis, aiming to identify undeclared adulterants and monitor marker compound degradation. A 2022 study in the Journal of Natural Products underscored the growing necessity of advanced forensic techniques. Methods like hyperspectral imaging, DNA-based identification, and orthogonal chromatography are becoming essential to uncovering sophisticated adulteration attempts that can bypass single-method tests. The financial burden of compliance isn't evenly distributed. Smaller suppliers and mid-tier distributors grapple with higher per-unit testing costs. This disparity subtly pressures consolidation, favoring larger, vertically integrated producers equipped with their own analytical capabilities.
*Our forecasts treat driver/restraint impacts as directional, not additive. The impact forecasts reflect baseline growth, mix effects, and variable interactions.
Segment Analysis
By Source: Herbs Anchor Revenue While Flowers Drive Premium Growth
In 2025, herbs accounted for 35.79% of global botanical ingredients revenue. Extracts from rosemary, mint, echinacea, and basil demonstrated versatility in food preservation, supplement formulation, and skincare. This broad applicability positions herbs as the category with the highest penetration rate across applications, ensuring steady demand despite innovation cycles in specific categories. Spices, the second-largest source segment, owe their position to oleoresin demand as food manufacturers reformulate for natural flavors and clean-label standards. Synthite Industries, with a group turnover of around INR 1,700 crore (approximately USD 204 million) in 2026, exemplifies integration from raw spice sourcing to blended ingredient solutions, meeting global FMCG buyer expectations. Fruits, roots, leaves, and seeds also support diverse applications: roots like ashwagandha, ginseng, and valerian cater to nutraceutical demand, while seeds and leaves drive flavoring and functional beverage innovations.
Flowers are the fastest-growing source segment, with a projected 7.96% CAGR through 2031. This growth stems from two demand channels. The cosmeceuticals sector drives volumes for bioactives like rose, lavender, chamomile, and hibiscus, known for skin benefits. Simultaneously, functional beverage and premium tea markets increasingly use elderflower, jasmine, and blue butterfly pea extracts as formulation differentiators. High average selling prices for flower-derived extracts, due to the infrastructure-intensive and climate-sensitive nature of flower cultivation, further boost growth. Industry leaders Givaudan and Symrise AG have strengthened floral botanical supply chains to serve premium fragrance and active beauty lines, capitalizing on the pricing power of certified-origin floral extracts through 2031.


By Form: Powder Commands Scale; Liquid Formats Track the Functional Beverage Boom
In 2025, the powder form segment will account for 59.72% of total revenues, highlighting its market dominance. This is due to advantages across the ingredient value chain: extended shelf life, reduced logistics costs, and compatibility with encapsulation, tableting, and blending processes essential for dietary supplements and pharmaceuticals. MartinBauer's investment in a new spraying tower at its Kleinostheim facility eliminated reliance on third-party drying and improved product tolerance control. Leading powder botanical suppliers now treat standardized spray-drying as a cost-leadership strategy rather than a legacy process. Both conventional and organic powder segments benefit from this trend, though organic powders command premium pricing that offsets higher capital intensity per production line.
Liquid botanical extracts are growing at a 7.81% CAGR through 2031, the fastest within the segment, driven by the rise of ready-to-drink functional beverages, kombucha, adaptogenic tonics, botanical water enhancers, and liquid supplement formats. Liquid bioactives offer superior sensory integration and formulation transparency compared to encapsulated powders. German life-science startup Evanium's April 2026 funding targets dual-encapsulation technology to enhance the bioavailability of liquid botanical actives like curcumin, berberine, boswellia, and passiflora. This signals a bifurcation in liquid extract innovation into commodity-grade and bioavailability-enhanced specialty tiers. Premium liquid actives are seeing significant ASP divergence from commodity extracts, creating a high-margin subsegment that rewards ingredient specialists with clinical validation programs.
By Nature: Conventional Scale Meets Organic Premium Momentum
In 2025, conventional botanical ingredients commanded a dominant 83.13% share of total revenues. This dominance underscores the vast scale and depth of established ingredient supply chains. Here, the shift to organic sourcing is only economically feasible for certain species, those that consistently enjoy a high consumer willingness to pay. However, this concentration doesn't signal a stagnation in the organic sector. Instead, it highlights a structural lag: while consumer preferences evolve, the commercial organic conversion of growing areas demands a 3–5-year certification timeline. A case in point is Synthite's 2025 move to bolster its supercritical CO2 extraction capacity at the Kolenchery facility in Kerala. This expansion, aimed squarely at the European organic market, showcases Indian suppliers' forward-thinking approach, investing in certifications ahead of demand. Viewed through a risk lens, the scarcity of organic produce during challenging harvest cycles is intensified by these certification constraints. Conventional supplies can't step in at premium organic price points, complicating inventory management for buyers and driving them towards forward contracting.
Forecasted to grow at an 8.01% CAGR through 2031, the organic segment is outpacing all other nature classifications. This surge is largely attributed to retailer shelf policies in Western Europe and North America, which increasingly prioritize certified-organic botanical SKUs. These SKUs are now staples in premium supplements, natural beauty products, and clean-label food lines. Suppliers who secure multi-standard certifications, spanning USDA NOP, EU Organic Regulation 848/2018, and India's NPOP framework, can tap into three lucrative export markets from a single certified production line. This strategy significantly boosts returns per certified acre compared to pursuing a single-market certification. Furthermore, there's a ripple effect: as brand owners increasingly view multi-standard certification as a non-negotiable supplier qualification, it raises the market entry barriers for uncertified producers.
By Application: Food and Beverages Lead; Cosmetics and Personal Care Accelerates Fastest
In 2025, food and beverages claimed a 33.70% share of the application market. This dominance is the result of decades of product development, seamlessly integrating herbs, spices, and botanical extracts. These ingredients have become staples for flavoring, natural preservation, coloring, and enhancing nutrition across categories like processed food, dairy, bakery, and beverages. Companies like Döhler GmbH and Sensient Technologies Corporation have established technical service capabilities tailored to specific applications. Their formulation labs, application trials, and regulatory documentation support transform botanical ingredient selection into a managed service for major food manufacturers, moving it away from mere commodity procurement. This added technical service layer not only elevates the value of these relationships but also introduces significant switching costs, especially for solutions that involve intricate botanical blends.
Cosmetics and personal care are witnessing the fastest growth, boasting a 7.72% CAGR projected through 2031. This surge is fueled by beauty brands increasingly investing in clinically validated botanical actives, leveraging them for premium pricing and a sustainability narrative. A prime example is AlUla Peregrina Trading Company's introduction at In-Cosmetics Global 2026. They showcased patented Peregrina seed extracts, ceramide-rich actives sourced from the desert, and boasting a fully verified supply chain from Saudi Arabia's Al-Ula region. This underscores the premium supply chain model now deemed essential by beauty brand research and development teams. Dietary supplements continue to be a robust segment, buoyed by an almost OTC accessibility that nurtures diverse product pipelines. However, while pharmaceutical-grade botanical actives demand stringent evidentiary standards, limiting market access to a select few specialists with regulatory-grade clinical documentation, other sectors like animal nutrition and industrial uses are emerging as smaller yet expanding avenues for botanical co-products and secondary-grade extracts.
Geography Analysis
North America held 34.4% of the botanical ingredients market share in 2025, which made it the largest regional contributor. The region benefits from mature supplement retail channels, strong spending on preventive wellness, and a large base of multinational ingredient buyers and manufacturers. That combination gives North America an outsized role in setting quality specifications and procurement expectations for the broader botanical ingredients market. Europe also remained a major consuming region, with Germany, France, Italy, Spain, and the United Kingdom serving as key demand centers. European demand remains especially important for suppliers that can meet stricter traceability, documentation, and origin requirements.
Asia-Pacific is projected to grow at an 8% CAGR through 2031, which makes it the fastest-growing region in the botanical ingredients market. China plays a dual role as a major producer and an increasingly premium domestic buyer of botanical extracts. India is also strengthening its export base through the formalization of Ayurvedic and herbal ingredient manufacturing for nutraceutical and pharmaceutical customers. Sabinsa inaugurated its USD 15 million Hassan Unit-2 facility in Karnataka’s Pharma SEZ in late 2025, with GMP certification and Zero Liquid Discharge design, which reflects the scale of fixed investment moving into export-oriented herbal processing. Thailand, Indonesia, South Korea, and Singapore are also improving their positions as value-added processing hubs through higher GMP adoption and closer links to Western brand supply chains.
South America is gaining structural relevance in the botanical ingredients market because biodiversity access is increasingly tied to commercial development and defensible sourcing. Brazil remains the key anchor because large ingredient companies are building sourcing and discovery models around its flora base. Colombia, Peru, and Argentina also support the regional pipeline with growing extraction and processing capacity for export markets. The Middle East and Africa remain important as an origin region for medicinal and aromatic plants, especially in Morocco, where drought pushed farm-gate prices higher through 2025 before conditions improved in early 2026. The UAE and Saudi Arabia are also becoming demand centers for premium supplements and cosmetic actives, and Saudi Arabia’s Peregrina launch shows how origin regions are trying to move into premium branded ingredients rather than staying only in raw material supply.

Competitive Landscape
The botanical ingredients market remains moderately fragmented, with a top tier of multinational ingredient groups and a wide field of specialized extractors and origin-country manufacturers. Givaudan through Naturex, DSM-Firmenich, IFF, and Symrise compete on broad extraction capability, global sourcing reach, and application support for customer formulations. Indena, MartinBauer, Sabinsa, and Synthite compete with deeper specialization in selected botanicals, stronger standardization know-how, and more focused clinical documentation. This structure keeps the botanical ingredients market competitive because customers can choose between global-scale suppliers and more specialized partners depending on product need. It also means that no single competitive model fully defines the botanical ingredients market.
Strategic moves in 2025 and 2026 show that major companies are reshaping portfolios around higher-value ingredients and tighter operational focus. DSM-Firmenich sold its Animal Nutrition and Health business to CVC Capital Partners in February 2026 for EUR 2.2 billion, or USD 2.4 billion, which completed a shift toward nutrition, health, and beauty priorities. IFF agreed in May 2026 to sell its Food Ingredients business to CVC Capital Partners for USD 4.3 billion while retaining a 10% minority stake, which pointed to a similar move toward biotechnology-led naturals and biosciences. These deals suggest that private equity is becoming more active in asset consolidation, where large ingredient groups no longer view some operations as core.
Vertical integration is becoming a stronger competitive advantage in the botanical ingredients market because buyers want fewer traceability gaps and better supply assurance. MartinBauer acquired American Botanicals in October 2025, which expanded its North American footprint and added 33,000 acres of wildcrafted Appalachian land. Robertet’s investment in Aethera Biotech in March 2026 showed a second route, where companies reduce climate exposure by moving toward controlled botanical production systems. Debut’s May 2026 partnership with Natura also showed how AI-led discovery and biodiversity-rich sourcing are starting to work together in premium actives development. These moves keep competition active across sourcing, extraction, formulation science, and intellectual property.
Botanical Ingredients Industry Leaders
Givaudan
International Flavors and Fragrances Inc.
Symrise AG
DSM-Firmenich AG
Martin Bauer Group
- *Disclaimer: Major Players sorted in no particular order

Recent Industry Developments
- May 2026: Debut and Natura announced a strategic partnership to commercialize an AI-discovered longevity ingredient complex combining Debut's proprietary AI-based ingredient discovery platform with Natura's Amazonian botanical heritage. Commercial products are targeted for launch as early as 2027.
- October 2025: MartinBauer acquired American Botanicals, the leading U.S. supplier of wildcrafted botanicals with stewardship of 33,000 acres in the Appalachian region. The acquisition extends MartinBauer's vertical integration within North America from wildcrafted farm origins through global extract manufacturing, strengthening supply chain resilience for US-origin botanical ingredients.
- December 2025: Sami-Sabinsa Group inaugurated its USD 15 million Hassan Unit-2 facility in Karnataka's Pharma SEZ Industrial Area, its ninth global manufacturing hub. The facility is built to GMP and Zero Liquid Discharge standards on a 15-acre site with 30–40% of land reserved for future expansion, targeting both existing herbal ingredient lines and innovative new products for global pharmaceutical and nutraceutical customers.


Global Botanical Ingredients Market Report Scope
Botanical ingredients are substances derived directly from plants, including herbs, roots, flowers, fruits, seeds, leaves, bark, or wood, used in commercial products for their functional, nutritional, therapeutic, or aromatic properties. The global botanical ingredients market is segmented by source, form, nature, application, and geography. By source, the market is segmented into herbs, spices, fruits, roots, leaves, seeds, and flowers. By form, the market is segmented into powder and liquid. By nature, the market is segmented into conventional and organic. By application, the market is segmented into food and beverages, dietary supplements, cosmetics & personal care, pharmaceuticals, and others. By geography, the market is segmented into North America, Europe, Asia-Pacific, South America, and the Middle East and Africa. The Market Forecasts are Provided in Terms of Value (USD).
| Herbs |
| Spices |
| Fruits |
| Roots |
| Leaves |
| Seeds |
| Flowers |
| Powder |
| Liquid |
| Conventional |
| Organic |
| Food and Beverages |
| Dietary Supplements |
| Cosmetics and Personal Care |
| Pharmaceuticals |
| Other Applications |
| North America | United States |
| Canada | |
| Mexico | |
| Rest of North America | |
| Europe | United Kingdom |
| Germany | |
| France | |
| Italy | |
| Spain | |
| Sweden | |
| Belgium | |
| Poland | |
| Netherlands | |
| Rest of Europe | |
| Asia-Pacific | China |
| Japan | |
| India | |
| Thailand | |
| Singapore | |
| Indonesia | |
| South Korea | |
| Australia | |
| Rest of Asia-Pacific | |
| South America | Brazil |
| Argentina | |
| Colombia | |
| Peru | |
| Chile | |
| Rest of South America | |
| Middle East and Africa | United Arab Emirates |
| South Africa | |
| Saudi Arabia | |
| Nigeria | |
| Egypt | |
| Morocco | |
| Turkey | |
| Rest of Middle East and Africa |
| Source | Herbs | |
| Spices | ||
| Fruits | ||
| Roots | ||
| Leaves | ||
| Seeds | ||
| Flowers | ||
| Form | Powder | |
| Liquid | ||
| Nature | Conventional | |
| Organic | ||
| Application | Food and Beverages | |
| Dietary Supplements | ||
| Cosmetics and Personal Care | ||
| Pharmaceuticals | ||
| Other Applications | ||
| Geography | North America | United States |
| Canada | ||
| Mexico | ||
| Rest of North America | ||
| Europe | United Kingdom | |
| Germany | ||
| France | ||
| Italy | ||
| Spain | ||
| Sweden | ||
| Belgium | ||
| Poland | ||
| Netherlands | ||
| Rest of Europe | ||
| Asia-Pacific | China | |
| Japan | ||
| India | ||
| Thailand | ||
| Singapore | ||
| Indonesia | ||
| South Korea | ||
| Australia | ||
| Rest of Asia-Pacific | ||
| South America | Brazil | |
| Argentina | ||
| Colombia | ||
| Peru | ||
| Chile | ||
| Rest of South America | ||
| Middle East and Africa | United Arab Emirates | |
| South Africa | ||
| Saudi Arabia | ||
| Nigeria | ||
| Egypt | ||
| Morocco | ||
| Turkey | ||
| Rest of Middle East and Africa | ||


Key Questions Answered in the Report
What is the 2026 value of the botanical ingredients space?
The botanical ingredients market was valued at USD 193.7 billion in 2026 and is forecast to reach USD 270.8 billion by 2031 at a 6.9% CAGR.
Which application generates the most revenue for botanical ingredients?
Food and beverages led applications with a 33.7% share in 2025 because botanical extracts are widely used in flavoring, preservation, color, and functional formulation.
Which end-use area is growing the fastest for botanical actives?
Cosmetics and personal care are the fastest-growing applications, with a projected 7.7% CAGR through 2031, driven by demand for clinically supported clean beauty ingredients.
Which region leads global demand for botanical ingredients?
North America held the largest regional share at 34.4% in 2025 due to its strong supplement retail base, preventive wellness spending, and established ingredient manufacturing ecosystem.
Page last updated on:


