Bone Replacement Products Market Size and Share
Market Overview
| Study Period | 2020 - 2031 |
|---|---|
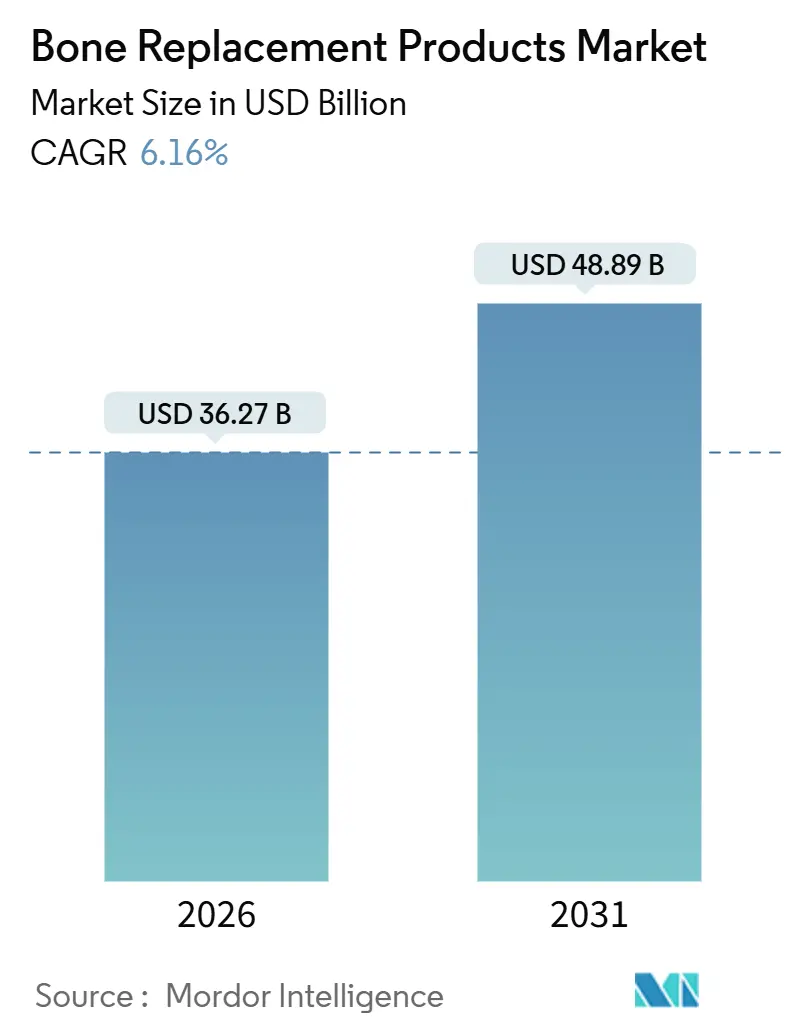
| Market Size (2026) | USD 36.27 Billion |
| Market Size (2031) | USD 48.89 Billion |
| Growth Rate (2026 - 2031) | 6.16% CAGR |
| Fastest Growing Market | Asia Pacific |
| Largest Market | North America |
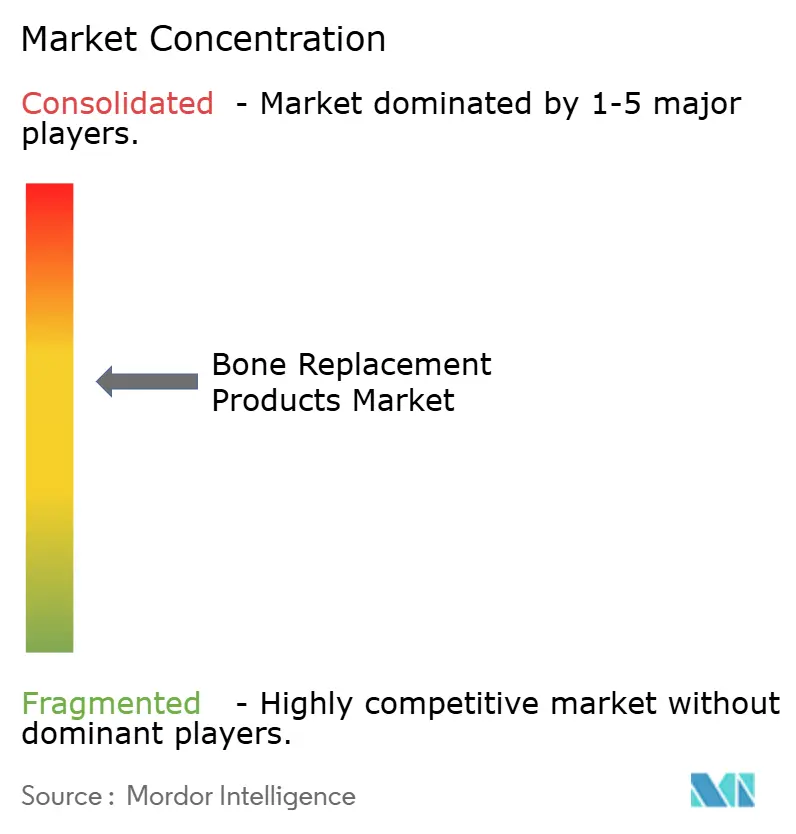
| Market Concentration | Medium |
Major Players *Disclaimer: Major Players sorted in no particular order Image © Mordor Intelligence. Reuse requires attribution under CC BY 4.0. | |
Bone Replacement Products Market Analysis by Mordor Intelligence
The Bone Replacement Products Market size is estimated at USD 36.27 billion in 2026, and is expected to reach USD 48.89 billion by 2031, at a CAGR of 6.16% during the forecast period (2026-2031).
Rising life expectancy, reimbursement reforms that back outpatient arthroplasty, and breakthroughs in 3-D printing, smart sensors, and bio-resorbable materials are expanding the addressable surgical pool and redefining product design priorities. Manufacturers are pivoting from one-size-fits-all metal constructs to data-enabled, patient-matched systems that promise faster recovery and longer implant survivorship. Hospitals, ambulatory surgical centers (ASCs), and orthopedic clinics now compete on throughput and bundled‐payment economics, motivating device makers to deliver shorter instrument trays, robotics-guided workflows, and cloud-based monitoring dashboards. At the same time, China’s volume-based procurement, India’s production incentives, and the European Union’s Medical Device Regulation are reshaping global go-to-market strategies, as price and compliance pressures collide with growing procedure demand.
Key Report Takeaways
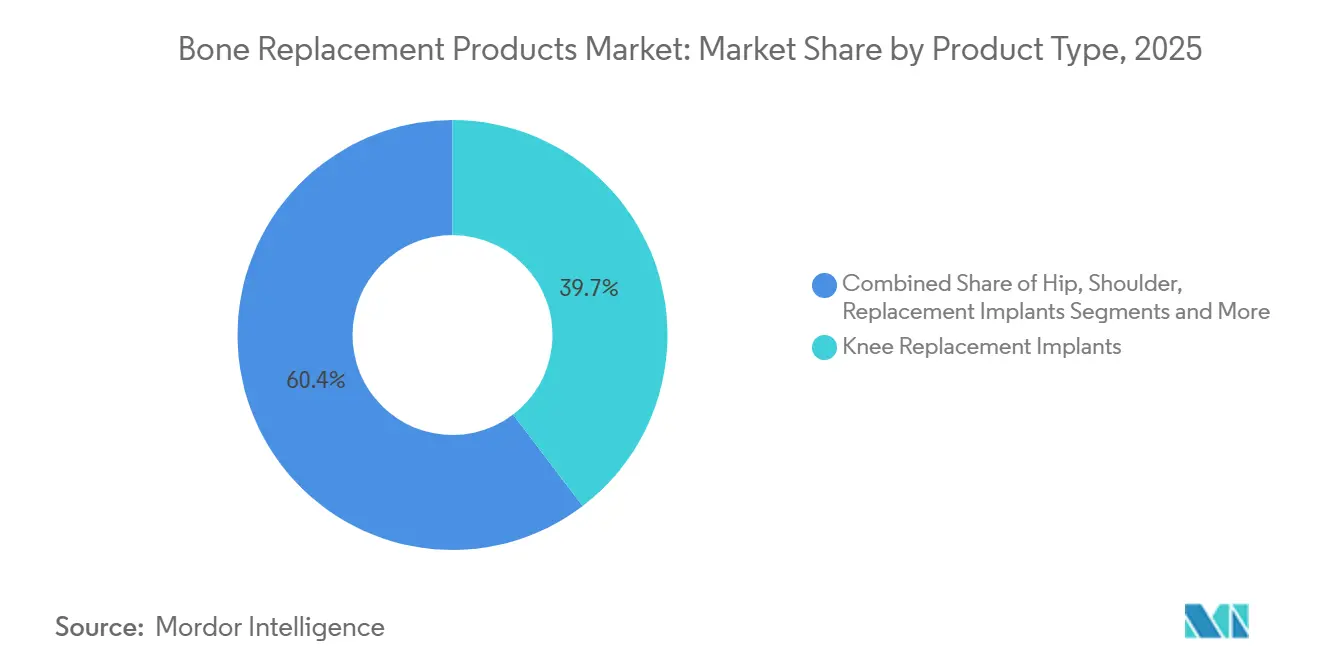
- By product category, knee implants led with 39.65% of the bone replacement products market share in 2025, while shoulder implants are forecast to expand at a 9.36% CAGR through 2031.
- By material, metal-alloy constructs accounted for 46.36% share of the bone replacement products market size in 2025 and bio-resorbable composites are projected to grow at a 10.67% CAGR to 2031.
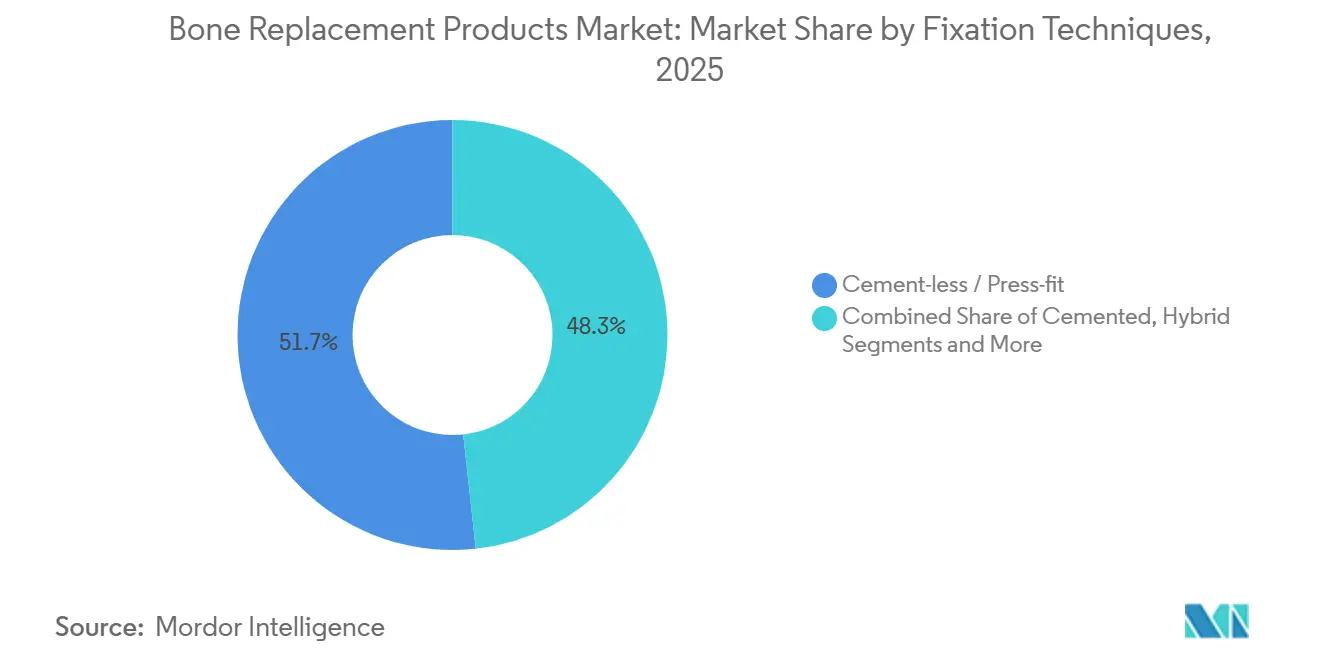
- By fixation technique, cement-less press-fit systems captured 51.73% share in 2025; patient-matched 3-D-printed implants record the highest projected CAGR at 9.74% through 2031.
- By end-user, hospitals held 64.26% volume in 2025, whereas ASCs are set to rise at an 8.83% CAGR to 2031.
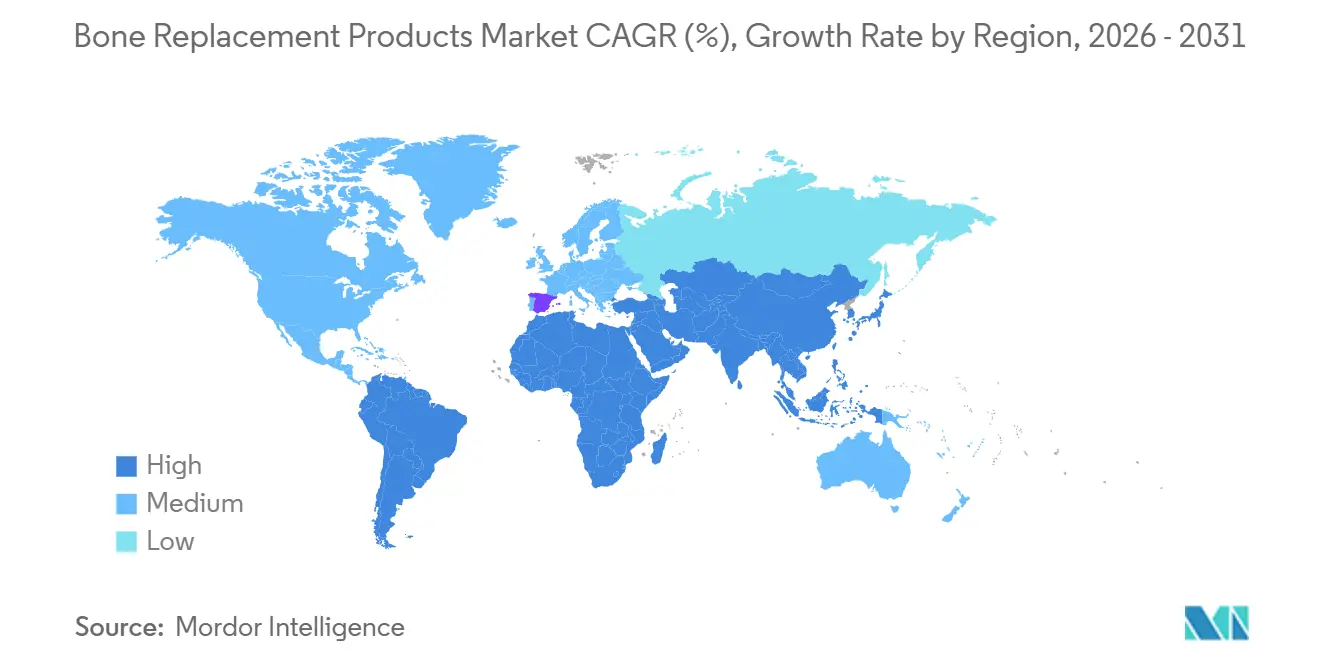
- By geography, North America commanded 39.52% revenue in 2025, yet Asia-Pacific is the fastest-growing region at an 8.22% CAGR to 2031.
Note: Market size and forecast figures in this report are generated using Mordor Intelligence’s proprietary estimation framework, updated with the latest available data and insights as of January 2026.
Global Bone Replacement Products Market Trends and Insights
Drivers Impact Analysis*
| Driver | (~) % Impact on CAGR Forecast | Geographic Relevance | Impact Timeline |
|---|---|---|---|
| Aging Population & Rising Incidence of Osteoarthritis | +1.8% | Japan, Germany, Italy, South Korea | Long term (≥ 4 years) |
| Technological Advances in 3-D Printed & Patient-Specific Implants | +1.2% | North America, EU, tier-1 APAC cities | Medium term (2-4 years) |
| Increased Preference for Minimally Invasive & Outpatient Joint Replacement | +1.0% | North America, Western Europe, Australia | Short term (≤ 2 years) |
| Developing Markets’ Reimbursement Expansions | +0.9% | China, India, Brazil, GCC | Medium term (2-4 years) |
| Smart Sensor-Enabled Implants for Real-Time Load Monitoring | +0.7% | United States, Germany, United Kingdom | Medium term (2-4 years) |
| Value-Based Care Incentives to Reduce Revision Surgeries | +0.6% | United States, United Kingdom | Long term (≥ 4 years) |
| Source: Mordor Intelligence | |||
Aging Population & Rising Incidence of Osteoarthritis
The 2021 Global Burden of Disease study logged 606 million osteoarthritis cases and projected 1 billion by 2050 as longevity and obesity climb.[1]Saeid Safiri, “Global Burden of Osteoarthritis Study 1990-2021,” The Lancet Rheumatology, thelancet.com Japan already sees 29.1% of its citizens above 65, prompting 1.2 million hip and knee arthroplasties a year.[2]Ministry of Health, Labour and Welfare Japan, “Annual Report on Health, Labour and Welfare 2024,” Ministry of Health, Labour and Welfare Japan, mhlw.go.jp Patients aged 55-70 increasingly choose surgery sooner to protect work and recreation time, compressing the interval between symptom onset and replacement. Hospitals respond by adding robotic platforms that cut operative minutes and turnover delays. National health systems view early intervention as a productivity safeguard, creating durable volume tailwinds for the bone replacement products market.
Technological Advances in 3-D Printed & Patient-Specific Implants
FDA clearance of 3D Systems’ VSP PEEK cranial system in 2024 validated rapid, scan-to-implant manufacturing within 72 hours. Conformis shipped more than 200,000 patient-matched knees before its 2024 restructuring, demonstrating commercial appetite when customization trims surgical time and bone cuts. A 2025 Journal of Arthroplasty study linked personalized cutting guides to a drop in malalignment beyond 3 degrees from 18% to 7%, with clear survivorship benefits.[3]Michael J. Thomas, “Patient-Specific Cutting Guides Reduce Malalignment in Total Knee Arthroplasty,” Journal of Arthroplasty, arthroplastyjournal.org However, U.S. reimbursement still limits custom implants to complex revisions, a policy stance expected to soften as longitudinal data accrues.
Increased Preference for Minimally Invasive & Outpatient Joint Replacement
CMS moved total knee arthroplasty onto the ASC list in its 2025 final rule, aligning payments with hospital outpatient departments. Stryker’s Mako platform enables 6-8 cm anterior hip incisions that shed blood loss to under 100 mL and let 85% of patients leave within four hours. Single-use trays add per-case cost but remove sterilization bottlenecks—a price many ASCs willingly pay. Surgeons see outpatient pathways as a strategic lever to control schedules and improve patient satisfaction, accelerating the shift of the bone replacement products market toward lower-acuity venues.
Developing Markets’ Reimbursement Expansions
India’s Production-Linked Incentive scheme offers 5% sales subsidies to local orthopedic manufacturers through 2029, aiming to replace imports across 400,000 annual joint replacements. China’s 2024 volume-based procurement slashed implant prices by 70-80% yet sparked a 35% jump in surgeries among 300 million insured citizens. Brazil added total hip arthroplasty to its high-complexity list in 2025, reimbursing USD 3,200 per case and attracting foreign-local alliances. These policy levers expand procedural access and keep emerging regions central to long-run growth.
Restraints Impact Analysis*
| Restraint | (~) % Impact on CAGR Forecast | Geographic Relevance | Impact Timeline |
|---|---|---|---|
| High Implant & Procedure Cost Burden | -1.1% | Low- and middle-income economies; U.S. uninsured | Long term (≥ 4 years) |
| Lengthy and Evolving Global Regulatory Pathways | -0.8% | FDA, EMA, NMPA jurisdictions | Medium term (2-4 years) |
| Supply-Chain Risk for Titanium & Co-Cr Alloys | -0.6% | North America, EU | Short term (≤ 2 years) |
| Cyber-Security & Data-Privacy Concerns | -0.4% | United States, EU, APAC | Medium term (2-4 years) |
| Source: Mordor Intelligence | |||
High Implant & Procedure Cost Burden
Medicare patients still faced USD 4,200 in out-of-pocket costs for a total knee in 2025, postponing surgery for many households under USD 50,000 income. Indian patients often pay 12-30 months of earnings for a hip replacement because private coverage reaches just 20% of citizens. China’s USD 900 implants offset only the hardware portion; hospital and surgeon fees keep total bills near USD 5,000. Margin compression follows as payers demand all-inclusive pricing while hospitals hesitate to invest in million-dollar robots absent firm volume guarantees.
Lengthy and Evolving Global Regulatory Approval Pathways
FDA 510(k) reviews average 6-12 months, yet Europe’s MDR now stretches certification to 18-24 months with mandatory post-market surveillance. China’s “green channel” can clear domestic systems in nine months, but foreign suppliers still endure multi-year timelines and must run local trials. The 2024 FDA cybersecurity rule adds software validation layers specifically for connected implants. Such divergence forces staggered launches and raises the odds that a rival enters first in growth markets, suppressing near-term revenue for the bone replacement products industry.
*Our forecasts treat driver/restraint impacts as directional, not additive. The impact forecasts reflect baseline growth, mix effects, and variable interactions.
Segment Analysis
By Product Type: Shoulder Implants Outpace Knee Volume Leaders
Knee systems dominated with 39.65% share in 2025, yet shoulders are on course for a 9.36% CAGR to 2031 as reverse designs liberate patients with non-repairable rotator cuffs. The bone replacement products market size for shoulder devices is thus growing from a lower base but outstripping hip and spine categories in relative terms. Dual-mobility hips held 28% of revenue thanks to lower dislocation risk among frail elders. Expandable spinal cages logged a 7.8% CAGR as they restore vertebral height without graft harvesting.
The reverse shoulder’s 68% share of all shoulder procedures in 2025 confirms its mainstream status. Elbow and wrist implants remain niche at 3% because reimbursement outside rheumatoid arthritis remains limited. Ankle and small-joint arthroplasty, however, grew 8.1% on the back of Stryker’s STAR system, improving motion relative to fusion. Outpatient migration pressures prices, pushing manufacturers to trim low-volume SKUs and sharpen value propositions across the bone replacement products market.


By Material: Bio-Resorbable Composites Challenge Metal Dominance
Metal alloys retained 46.36% share in 2025, underlining their strength-to-weight advantages in load-bearing joints. Yet bio-resorbable scaffolds rise at a 10.67% CAGR as clinicians prize hardware that disappears once bone heals. Ceramic heads such as alumina and zirconia claimed 18% share, achieving 0.02% yearly wear for young, active hips
Polymeric constructs, mainly UHMWPE and PEEK, contributed 22% revenue; cross-linked polyethylene slashes debris by 90%, cutting osteolysis risk. PEEK’s radiolucency aids imaging but its hydrophobicity slows bone bonding, prompting titanium-coated hybrids from firms like NuVasive. Carbon-fiber composites now show 70% of titanium’s strength at 40% weight, yet lack defined regulatory pathways, a hurdle that will shape future material share inside the bone replacement products market.
By Fixation Technique: Patient-Matched 3-D Printing Disrupts Press-Fit Norms
Press-fit constructs represented 51.73% of surgeries in 2025, cementing biological integration as surgeon preference. Cemented stems kept a 32% niche in osteoporotic or revision scenarios. Hybrid fixation occupied 11%, blending approaches to individual bone quality.
Custom 3-D-printed implants, though just emergent, clock a 9.74% CAGR and promise leaner OR workflows by removing trial sizing. FDA clearances are accelerating, as shown by the 6-9-month pathway of 3D Systems’ PEEK cranial device. The economic case strengthens where revision rates run high, aligning with payer targets to cut costly redo surgeries and expanding long-run penetration in the bone replacement products market.
By End-User: Ambulatory Centers Gain Share Through Payment Parity
Hospitals processed 64.26% of procedures in 2025, essential for revisions and multi-trauma cases. ASCs, however, post an 8.83% CAGR to 2031 following CMS payment parity. Orthopedic clinics kept 14% share, mostly in markets that allow physician-owned facilities to capture facility fees.
ASCs favor regional anesthesia 85% of the time, enabling same-day discharge for 90% of hips and knees. Yet capital outlays of USD 1-2 million for robotics limit adoption to centers with 300+ annual cases. Hospitals counter with joint-venture ASCs, securing 60% of facility revenue while shifting low-acuity cases out of costlier inpatient wards. This venue rebalancing shapes implant design, logistics, and pricing across the bone replacement products market.
Geography Analysis
North America generated 39.52% of 2025 revenue as CMS broadened outpatient eligibility and the United States booked 1.2 million large-joint replacements. Canada trails similar trends as provincial payers roll out bundled payments. Asia-Pacific, however, leads growth at 8.22% CAGR through 2031. China’s price-volume deal cut implant tags from USD 4,500 to USD 900 yet raised procedure count 35% in a year. India’s incentive program nudges multinationals to partner locally and tap its 400,000 annual surgeries. Japan’s aging society pushes hospitals toward robotics to clear high caseloads.
Europe reflects high procedure volumes but MDR compliance costs that now eat 30-40% of regulatory budgets. The United Kingdom’s ceramic bearing guidance bolsters material premium segments. Middle East & Africa captured 6% as Gulf nations build medical tourism hubs under Saudi Vision 2030. South America’s 5% share leans on Brazil’s 2025 reimbursement of USD 3,200 per hip under SUS, drawing supply-chain joint ventures.
Australia shortened implant approval to six months for FDA or CE-marked devices, tempting firms frustrated by Europe’s MDR backlog. South Korea’s insurer began covering reverse shoulders at 80%, boosting volumes 40%. Mexican near-shoring trimmed lead times for U.S. distributors from 90 days to 30 days as Tijuana and Monterrey plants ramped output. Together, these shifts amplify regional opportunities, making localization strategy pivotal for the bone replacement products market.

Competitive Landscape
The market is moderately concentrated. Stryker’s Mako robot, present in 1,500+ sites, ties implant orders to proprietary software upgrades, cementing customer lock-in. Zimmer Biomet’s Persona IQ knee extends revenue beyond hardware via subscription analytics stitched into CMS’s bundled models. Smith & Nephew pairs oxidized-zirconium knees with risk-sharing guarantees that refund hospitals when revision rates exceed set limits.
Mid-tier challengers such as LimaCorporate use lattice-structured titanium to tailor revision hips quickly, while AK Medical and MicroPort leverage China’s procurement to win on value lines. Conformis’ 2024 bankruptcy, followed by Xtant’s purchase, underlines the cash burn needed to scale custom implants without a broad catalogue. Start-ups in bio-resorbables and carbon composites chase fracture and craniofacial niches, but regulatory clarity and manufacturing consistency remain hurdles. Overall, incumbents press advantages in robotics, data, and compliance infrastructure, yet nimble entrants still find openings in the bone replacement products market where customization or cost disruption matters.
Bone Replacement Products Industry Leaders
Zimmer Biomet Holdings
Stryker Corporation
Smith & Nephew plc
Medtronic plc
Johnson & Johnson
- *Disclaimer: Major Players sorted in no particular order

Recent Industry Developments
- January 2026: Cerapedics won FDA approval to expand PearlMatrix P-15 bone graft use to degenerative disc disease patients.
- October 2025: FDA granted Breakthrough Device status to Zimmer Biomet’s iodine-treated total hip replacement system.
- April 2025: South Korea-based CGBIO secured FDA IDE approval to run NOVOSIS PUTTY spinal fusion trials in the United States.


Global Bone Replacement Products Market Report Scope
Bone replacement products, also known as bone substitutes or graft substitutes, are biomaterials designed to replace missing bone, fill defects, or support fracture healing by mimicking natural bone structure and promoting new bone growth (osteoconduction and osteoinduction).
The Bone Replacement Products Market Report is segmented by Product Type, Material, Fixation Technique, End User, and Geography. By Product Type, the market is segmented into Hip, Knee, Shoulder, Elbow & Wrist, Spinal, and Extremity. By Material, the market is segmented into Metal-Alloy, Ceramic, Polymeric, and Bio-resorbable. By Fixation Technique, the market is segmented into Cemented, Cement-less, Hybrid, and 3-D Printed. By End User, the market is segmented into Hospitals, ASCs, and Clinics. By Geography, the market is segmented into North America, Europe, Asia-Pacific, MEA, and South America. The market report also covers the estimated market sizes and trends for 17 countries across major regions globally. Market Forecasts are Provided in Terms of Value (USD).
| Hip Replacement Implants |
| Knee Replacement Implants |
| Shoulder Replacement Implants |
| Elbow & Wrist Implants |
| Spinal Vertebral Body Replacement |
| Extremity & Others |
| Metal-Alloy |
| Ceramic |
| Polymeric (UHMWPE, PEEK) |
| Bio-resorbable & Composite |
| Cemented |
| Cement-less / Press-fit |
| Hybrid |
| Patient-matched 3-D Printed |
| Hospitals |
| Ambulatory Surgical Centers |
| Orthopedic & Specialty Clinics |
| North America | United States |
| Canada | |
| Mexico | |
| Europe | Germany |
| France | |
| United Kingdom | |
| Italy | |
| Spain | |
| Rest of Europe | |
| Asia-Pacific | China |
| Japan | |
| India | |
| South Korea | |
| Australia | |
| Rest of Asia-Pacific | |
| Middle East & Africa | GCC |
| South Africa | |
| Rest of Middle East & Africa | |
| South America | Brazil |
| Argentina | |
| Rest of South America |
| By Product Type | Hip Replacement Implants | |
| Knee Replacement Implants | ||
| Shoulder Replacement Implants | ||
| Elbow & Wrist Implants | ||
| Spinal Vertebral Body Replacement | ||
| Extremity & Others | ||
| By Material | Metal-Alloy | |
| Ceramic | ||
| Polymeric (UHMWPE, PEEK) | ||
| Bio-resorbable & Composite | ||
| By Fixation Technique | Cemented | |
| Cement-less / Press-fit | ||
| Hybrid | ||
| Patient-matched 3-D Printed | ||
| By End-user | Hospitals | |
| Ambulatory Surgical Centers | ||
| Orthopedic & Specialty Clinics | ||
| By Geography | North America | United States |
| Canada | ||
| Mexico | ||
| Europe | Germany | |
| France | ||
| United Kingdom | ||
| Italy | ||
| Spain | ||
| Rest of Europe | ||
| Asia-Pacific | China | |
| Japan | ||
| India | ||
| South Korea | ||
| Australia | ||
| Rest of Asia-Pacific | ||
| Middle East & Africa | GCC | |
| South Africa | ||
| Rest of Middle East & Africa | ||
| South America | Brazil | |
| Argentina | ||
| Rest of South America | ||


Key Questions Answered in the Report
How large is the bone replacement products market in 2026?
The bone replacement products market size is USD 36.27 billion in 2026 and is forecast to grow to USD 48.89 billion by 2031 at a 6.16% CAGR.
Which implant category leads revenue today?
Knee systems hold the largest revenue share at 39.65% in 2025.
Which segment is growing fastest?
Shoulder implants, specifically reverse shoulder systems, are projected to expand at a 9.36% CAGR through 2031.
Why are ambulatory surgical centers gaining volume?
CMS payment parity and minimally invasive robotics allow same-day discharge, driving an 8.83% CAGR in ASC procedures to 2031.
What material trend should suppliers watch?
Bio-resorbable composites are the fastest-rising material class, growing at a 10.67% CAGR as surgeons seek implants that eventually dissolve.
Page last updated on:


