Biological Data Visualization Market Size and Share
Market Overview
| Study Period | 2020 - 2031 |
|---|---|
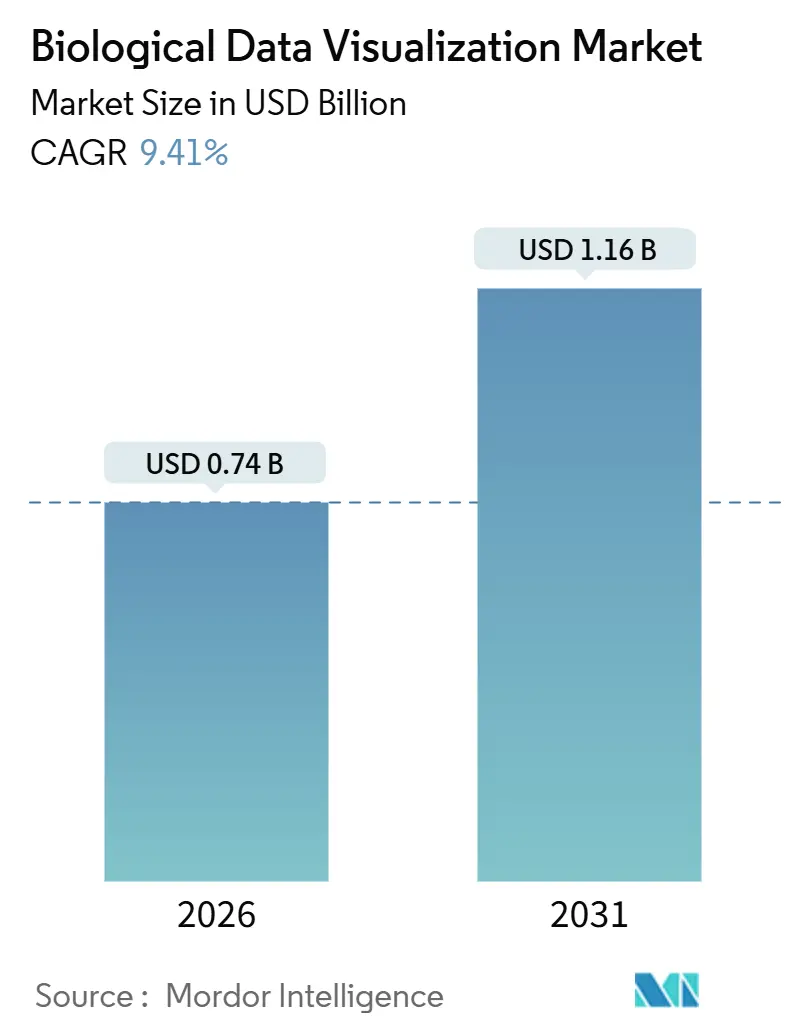
| Market Size (2026) | USD 0.74 Billion |
| Market Size (2031) | USD 1.16 Billion |
| Growth Rate (2026 - 2031) | 9.41% CAGR |
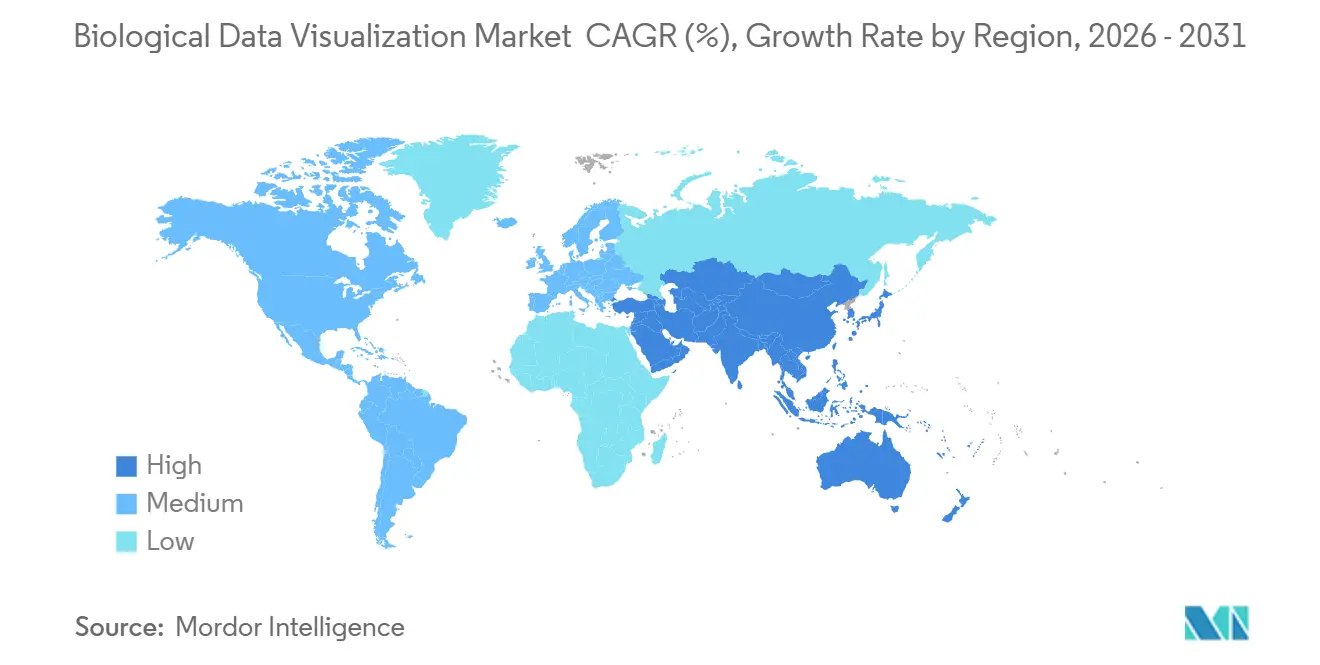
| Fastest Growing Market | Asia Pacific |
| Largest Market | North America |
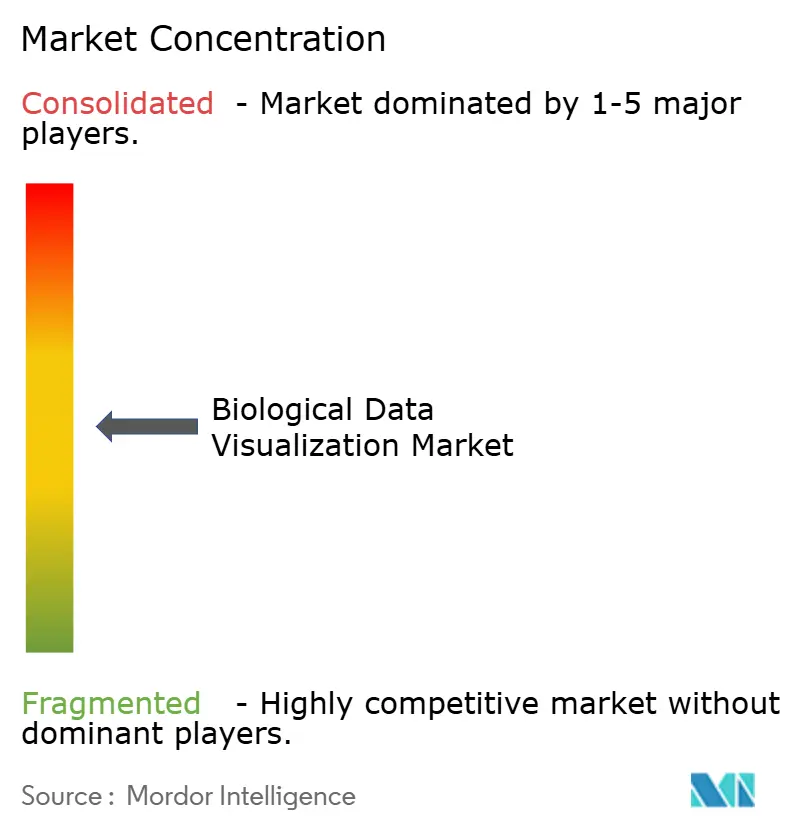
| Market Concentration | Medium |
Major Players *Disclaimer: Major Players sorted in no particular order Image © Mordor Intelligence. Reuse requires attribution under CC BY 4.0. | |
Biological Data Visualization Market Analysis by Mordor Intelligence
The Biological Data Visualization Market size is estimated at USD 0.74 billion in 2026, and is expected to reach USD 1.16 billion by 2031, at a CAGR of 9.41% during the forecast period (2026-2031).
Sequencing throughput now tops 6 terabases per NovaSeq X run, sovereign-AI mandates move compute to the edge, and the ratified WebGPU standard allows browser-native rendering of spatial-omics files once restricted to workstations. Cloud-based platforms will nevertheless climb at 15.13% as Terra’s linkage with the NIH All of Us cohort and Illumina Connected Analytics’ real-time DRAGEN pipelines lower activation barriers for academic labs. Academic research commanded 61.93% of end-user spending in 2025, supported by USD 3.2 billion in NIH genomics allocations. Pharmaceutical and biotechnology firms, however, will expand their outlays by 13.31% as structure-based drug design migrates from static PDB files to interactive, GPU-accelerated molecular dynamics trajectories.
Key Report Takeaways
- By technique, microscopy retained 32.91% of the revenue share in 2025, while magnetic resonance imaging is forecast to expand at a 11.07% CAGR through 2031.
- By application, genomic analysis generated 66.03% of 2025 sales, whereas systems biology is projected to grow at a 12.15% CAGR through 2031.
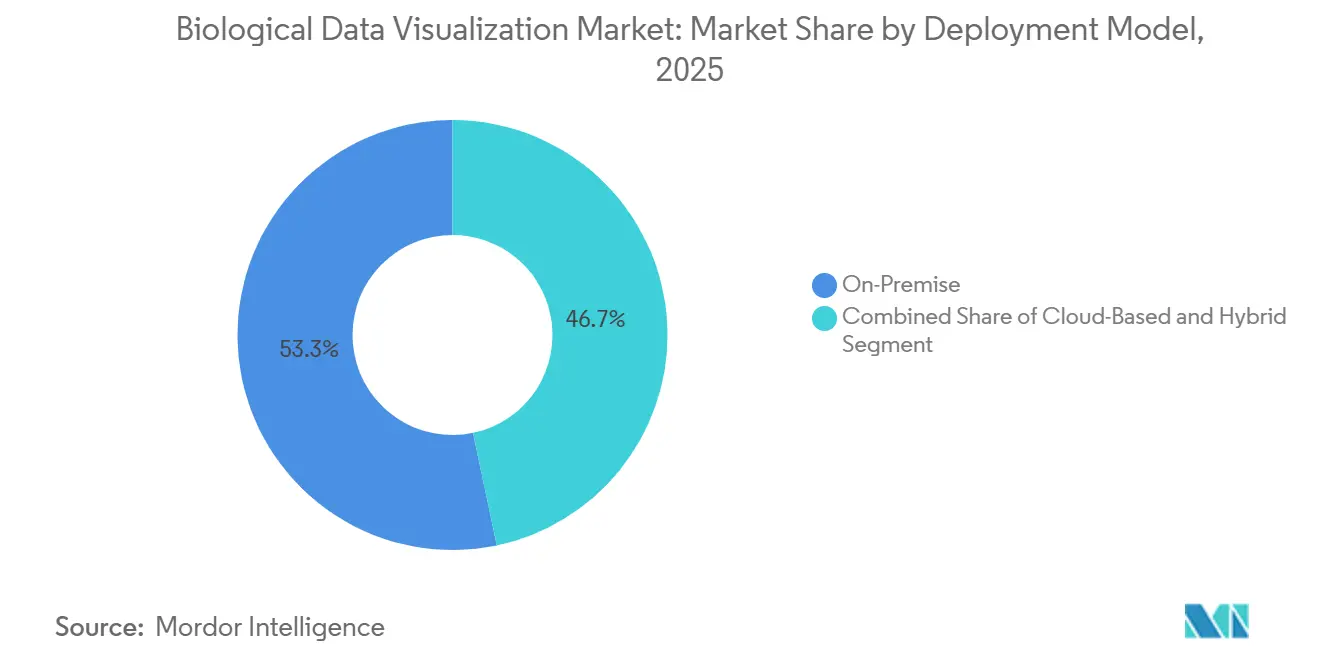
- By deployment model, on-premises deployments held 53.29% of the biological data visualization market share in 2025, but cloud-based platforms will grow at a 15.13% CAGR through 2031.
- By end user, academic researchers accounted for 61.93% of the biological data visualization market in 2025; pharmaceutical and biotechnology companies are poised to record a 13.31% CAGR through 2031.
- By geography, North America captured 51.53% of 2025 revenue; Asia-Pacific is climbing at a 16.03% CAGR over the same horizon.
Note: Market size and forecast figures in this report are generated using Mordor Intelligence’s proprietary estimation framework, updated with the latest available data and insights as of January 2026.
Global Biological Data Visualization Market Trends and Insights
Drivers Impact Analysis*
| Driver | (~) % Impact on CAGR Forecast | Geographic Relevance | Impact Timeline |
|---|---|---|---|
| Explosion of Next-Generation Sequencing (NGS) Data Volumes | +2.1% | Global, with concentration in North America, Europe, and China | Medium term (2-4 years) |
| Integration of AI/ML for Real-Time Multi-Omics Visualization | +1.8% | North America & EU lead; APAC adoption accelerating | Short term (≤ 2 years) |
| Adoption of Cloud-Native Bioinformatics Platforms | +1.5% | Global, strongest in North America and Western Europe | Medium term (2-4 years) |
| Rising Demand for Precision & Personalized Therapeutics | +1.3% | North America, EU, Japan; emerging in India and China | Long term (≥ 4 years) |
| GPU-Accelerated In-Browser WebGPU Renderers Enable Edge Analytics | +1.0% | Global, with early traction in academic research hubs | Short term (≤ 2 years) |
| Supply-Chain Reshoring Incentives Funding Domestic Biocompute Stacks | +0.8% | United States (CHIPS Act), EU (Chips Act), limited MEA/LatAm | Long term (≥ 4 years) |
| Source: Mordor Intelligence | |||
Explosion of Next-Generation Sequencing (NGS) Data Volumes
Sequencing instruments shipped in 2025 collectively produced more than 50 petabases per year, a fourfold jump over 2020, overwhelming legacy desktop viewers.[1]Illumina, “NovaSeq X Series,” illumina.com Illumina NovaSeq X now delivers 16 terabases per 2-day run, and Oxford Nanopore’s PromethION 2 Solo adds 10 gigabases per hour of real-time reads. The Integrative Genomics Viewer (IGV) adopted CUDA-based track rendering, slashing BAM-file load times from minutes to seconds. At the same time, DRAGEN processes a whole genome in under 20 minutes on AWS F1 instances. Pharmaceutical R&D groups embed these GPU-accelerated viewers into clinical-trial dashboards to track circulating-tumor DNA during patient enrollment in near real time. Vendors unable to parallelize across GPU clusters risk losing market share in biological data visualization as users gravitate toward streaming pipelines.
Integration of AI/ML for Real-Time Multi-Omics Visualization
Transformer models trained on paired transcriptomic and proteomic matrices achieve R² > 0.85 in predicting protein abundance from RNA-seq, collapsing analysis into a unified latent space.[2]Nature Methods, “Multi-Omics Integration,” nature.com Platforms such as OmicsAnalyst auto-annotate pathway enrichment as users pan across single-cell UMAP plots, trimming manual GSEA steps that once consumed days. Novartis cut target-validation cycles by 30% after deploying AI-led visualization across 12 tissue types. Start-ups like CellWhisperer use diffusion models to impute missing spatial-omics spots, enabling pathologists to identify tumor margins with 95% concordance to H&E staining. The FDA’s 2024 draft guidance permits visualization algorithms that augment clinical decision-making, provided training sets are auditable. Predictive visualization thus becomes a differentiator across the biological data visualization market.
Adoption of Cloud-Native Bioinformatics Platforms
Terra surpassed 100,000 users in 2025, having processed more than 2 exabytes of genomic data on Google Cloud.[3]Broad Institute, “Terra,” terra.bio AWS HealthOmics manages Nextflow at 10,000 vCPUs, lowering per-sample compute costs by 40% versus on-premise clusters. Illumina Connected Analytics streams runs directly from NovaSeq instruments to S3, enabling browser-based dashboards without local servers. Hybrid architectures keep raw FASTQ files on-premise while de-identified variant calls move to Azure for collaboration, a model that satisfies stringent 21 CFR Part 11 requirements in big pharma. The 2024 EU Data Act, which prohibits vendor lock-in, further accelerates multi-cloud strategies. Academic consortia benefit disproportionately as the All of Us program now pre-loads half a million genomes into Terra workspaces.
Rising Demand for Precision & Personalized Therapeutics
The FDA cleared 16 companion diagnostics in 2024, each of which embeds visualization modules to match patients with targeted therapies. Guardant360 CDx overlays somatic variants onto protein-domain schematics, enabling same-day oncologist decisions. FoundationOne CDx integrates with Epic EHR to auto-populate therapy recommendations. Japan’s AMED earmarked JPY 50 billion (USD 340 million) for pharmacogenomic visualization tools in 2025. India’s Genome India Project portal catalogs 10,000 reference genomes to reduce false positives in South Asian cohorts. Such initiatives sustain growth in the biological data visualization market.
Restraints Impact Analysis*
| Restraint | (~) % Impact on CAGR Forecast | Geographic Relevance | Impact Timeline |
|---|---|---|---|
| High Cost of Advanced Visualization Platforms & HPC Infrastructure | -1.2% | Global, acute in emerging markets and mid-tier CROs | Medium term (2-4 years) |
| Shortage of Skilled Bioinformatics-Visualization Talent | -0.9% | Global, most severe in APAC and LatAm | Long term (≥ 4 years) |
| Data-Sovereignty Regulations Limiting Cross-Border Cloud Workflows | -0.7% | EU (GDPR), China (PIPL), India (Digital Personal Data Protection Act) | Short term (≤ 2 years) |
| Interoperability Gaps Among Spatial-Omics File Formats | -0.5% | Global, impacting multi-vendor research consortia | Medium term (2-4 years) |
| Source: Mordor Intelligence | |||
High Cost of Advanced Visualization Platforms & HPC Infrastructure
A turnkey spatial-omics cluster with eight NVIDIA A100 GPUs and two petabytes of NVMe storage costs roughly USD 600,000, exceeding the average NIH R01 grant budget. Annual licenses for proprietary renderers add USD 50,000 per seat. Misconfigured S3 buckets have generated six-figure egress bills at U.S. universities, pushing labs back to on-premise transfers. Open-source suites avoid license fees but force institutions to hire CIS-grade engineers at USD 150,000 salaries, deepening the cost divide and tempering growth in the biological data visualization market.
Shortage of Skilled Bioinformatics-Visualization Talent
Only 12% of U.S. bioinformatics master’s programs teach GPU acceleration. Genentech offered 40% salary premiums to recruit visualization developers in 2025. Startups delay product launches; 10x Genomics slipped Xenium software updates by two quarters due to hiring gaps.
*Our forecasts treat driver/restraint impacts as directional, not additive. The impact forecasts reflect baseline growth, mix effects, and variable interactions.
Segment Analysis
By Application: Genomic Analysis Anchors Revenue, Systems Biology Accelerates
Genomic analysis commanded 66.03% of 2025 revenue, reflecting mature variant-calling pipelines and widespread whole-exome diagnostics, anchoring the biological data visualization market size for applications. Genome Analysis Toolkit processes more than 1 million samples monthly, and its visualization plug-ins support multi-terabyte datasets. By contrast, systems biology visualization will grow at a 12.15% CAGR through 2031, driven by demand for multi-omics dashboards. Platforms like Cytoscape rendered hundred-thousand-node protein-interaction maps after adopting GPU acceleration in 2024.
Systems-level tools now animate time-series expression shifts across pharmacologic exposures, an interaction style unavailable in first-generation genome browsers. Venture investors target these immersive interfaces, such as EMBL-EBI’s virtual-reality pathway viewer piloted in 2025. Regulatory frameworks remain permissive because ISO 15189 accredits traceability rather than display methods. As a result, suppliers differentiate on interactivity and AI-assisted annotation, allowing systems biology to punch above its current market share in biological data visualization.
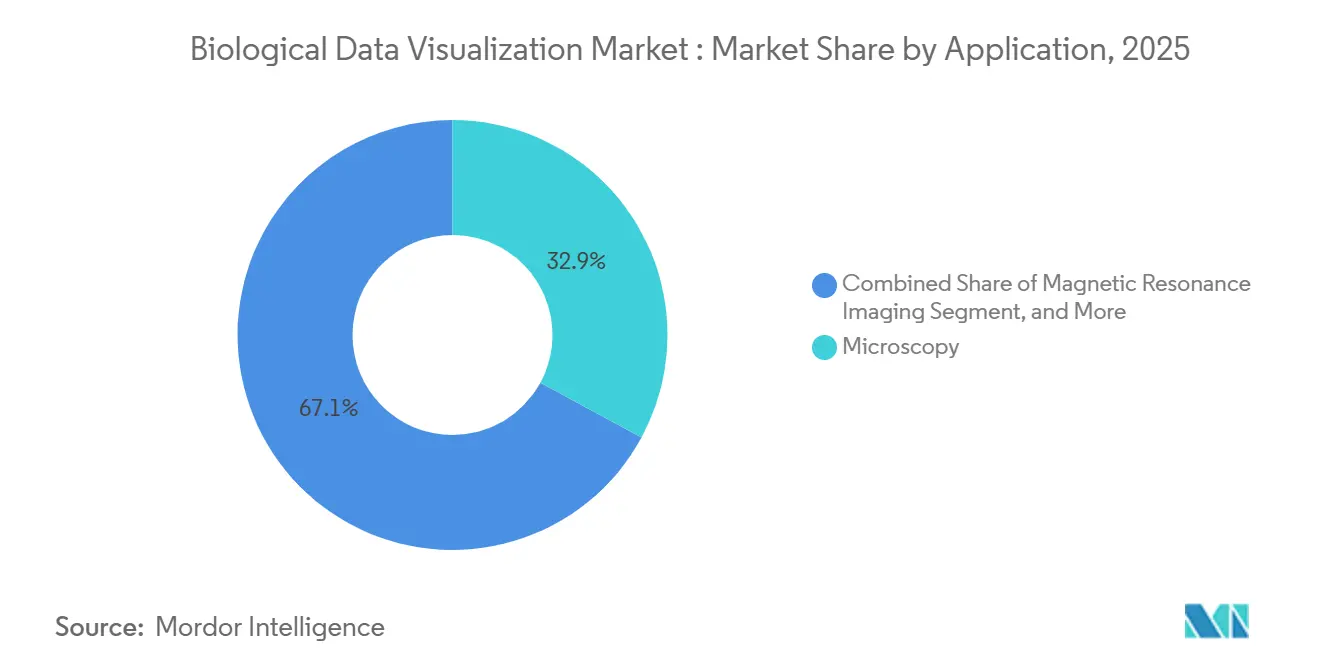


By Technique: Microscopy Leads, MRI Surges on Ultra-High-Field Adoption
Microscopy produced 32.91% of 2025 revenue, cementing its role in cell biology pipelines that feed high-content screens into downstream analytics. Zeiss Lattice SIM³ pushes resolution to 60 nm, visualizing synaptic vesicles in intact brain slices. Magnetic resonance imaging is slated to post an 11.07% CAGR through 2031 after FDA clearance of 7-tesla systems, elevating the market size for biological data visualization in ultra-high-field imaging. Siemens MAGNETOM Terra 7T achieves sub-0.5-mm voxels, opening the door to molecular-scale neuroimaging.
Sequencing visualizers, though not formal in this taxonomy, intersect heavily with NGS output. Illumina BaseSpace handled 2.5 million samples in 2024, pairing DRAGEN with IGV-derived dashboards. Cryo-EM adoption soared when ChimeraX introduced specialized rendering in 2024. Such diversification of techniques ensures the biological data visualization market remains resilient across budget cycles.
By Deployment Model: On-Premise Dominates, Cloud Gains on Collaboration Needs
On-premise deployments held 53.29% share in 2025, anchored by pharmaceutical quality-system mandates and clinical-trial protocols that prohibit off-site data transfer. Pfizer's 2025 disclosure that 70% of its genomics infrastructure remains on-premise, citing 21 CFR Part 11 validation costs for cloud migrations, typifies big-pharma conservatism. Cloud-based platforms, however, will post 15.13% growth through 2031, driven by academic consortia and biotech startups that lack capital for HPC clusters.
Terra's integration with the NIH All of Us cohort, providing pre-authorized access to 500,000 genomes, eliminated a 6-month data-request bottleneck that previously deterred exploratory research. AWS HealthOmics' managed Nextflow service, launched in late 2024, auto-scales to 10,000 vCPUs and charges only for compute time, reducing per-sample costs from USD 50 on legacy HPC to USD 20. Hybrid deployments, blending on-premise raw-data storage with cloud-based analytics, are emerging as a middle path; Illumina Connected Analytics exemplifies this model by streaming sequencing runs to AWS while retaining FASTQ files locally.
By End-User: Academic Research Leads, Pharma Accelerates on Drug-Discovery Needs
Academic research accounted for 61.93% of end-user spending in 2025, sustained by USD 3.2 billion in NIH genomics allocations and USD 1.8 billion from the European Research Council's Horizon Europe program. The NIH's BRAIN Initiative, which received USD 680 million in fiscal 2025, prioritizes visualization tools that map neural circuits at single-cell resolution and funds 12 academic labs to develop open-source renderers. Pharmaceutical and biotechnology companies will expand at 13.31% through 2031, driven by structure-based drug design and spatial-omics profiling of clinical biopsies.
Schrödinger's 2025 annual report noted that 18 of the top 20 pharma companies license its molecular-visualization suite, with usage growing 25% year-over-year as AI-predicted protein structures (e.g., AlphaFold3) require interactive validation. Genentech's 2024 deployment of spatial transcriptomics visualization for tumor microenvironment mapping, analyzing 500 patient samples per quarter, exemplifies pharma's shift from bulk RNA-seq to spatially resolved profiling.
Geography Analysis
North America generated 51.53% of 2025 revenue, powered by NIH’s USD 48 billion annual budget with USD 3.2 billion earmarked for genomics research. The FDA's willingness to approve AI-enabled algorithms and 7-tesla MRI systems shortens commercialization timelines. U.S. pharma giants invested USD 12 billion in informatics in 2024, allocating 15% to visualization software. Canada’s Genome Canada committed CAD 120 million (USD 88 million) in 2025 to cloud-based visualization portals, strengthening regional demand. Mexico’s rising nearshore service centers boost support capacity for Spanish-language customers.
Asia-Pacific will expand at a 16.03% CAGR to 2031, pivoting the biological data visualization market toward the east. China’s National GeneBank hosts 100 petabytes of omics data and funds proprietary viewers that incorporate traditional medicine phenotypes. India’s 25 BioNEST incubators nurture visualization start-ups focused on population-specific allele frequencies. Japan’s AMED invested JPY 50 billion to embed spatial-omics viewers in cancer centers. Australia leverages AWS Sydney to visualize 50,000 cancer genomes without buying on-premise GPUs. South Korea’s K-Chips Act guarantees domestic GPU supply, reducing the risk of supply-chain disruptions.
Horizon Europe budgets EUR 8 billion for health research, including bioinformatics infrastructure. Fraunhofer’s RISC-V accelerators reduce reliance on U.S. chips. The UK Biobank embedded WebGPU browsers, reducing query latency by 70%, illustrating efficiency gains in the biological data visualization market. France’s CNMG rolled out DRAGEN servers across 12 hubs, standardizing variant calling. Italy and Spain ride the EU Data Act provisions that enable cloud portability. Latin America and Africa remain nascent but fast-growing, with Brazil’s FAPESP funding local genomics portals and South Africa partnering with Wellcome Sanger on pathogen dashboards.

Competitive Landscape
The biological data visualization market is moderately concentrated: Illumina, Thermo Fisher Scientific, Danaher, 10x Genomics, and Agilent Technologies together controlled significant revenue in 2025. Illumina bundles NovaSeq X instruments with Connected Analytics subscriptions to lock in end-to-end workflows. Danaher’s USD 5.7 billion acquisition of Abcam secured antibody-validation libraries that enrich imaging pipelines. Thermo Fisher extends Orbitrap mass spectrometry visualizers for proteomics integration.
Horizontal specialists pursue openness. Genedata offers 20-plus format connectors, helping pharma unify sequencing and imaging feeds. Tableau’s business-intelligence roots limit traction, so bio-specific players like Benchling and Geneious gain ground with molecular-biology-aware viewers. Start-ups such as CellWhisperer and kana embrace WebGPU and WebAssembly, differentiating on browser-based speed and low IT footprint. NVIDIA’s CUDA ecosystem remains dominant, yet Intel's oneAPI gains subsidies under the CHIPS Act and offers performant alternatives. Patent filings echo these themes: 10x Genomics filed 18 spatial-omics visualization patents in 2024, and Schrödinger targets AI-assisted protein validation workflows.
White-space opportunities persist in federated learning compliant with GDPR and PIPL, as the GA4GH DRS standard gains traction for secure cross-cloud exchange. Edge analytics built on WebGPU enables hospital IT teams to bypass public clouds, a decisive advantage in regions that enforce strict data localization. Given the 40% combined share of the top five vendors, market concentration scores a 6 on a 10-point scale, indicating room for nimble entrants targeting spatial-omics and in-browser acceleration niches.
Biological Data Visualization Industry Leaders
3M
Agilent Technologies
Bio-Rad Laboratories
GE HealthCare
Danaher Corporation
- *Disclaimer: Major Players sorted in no particular order

Recent Industry Developments
- January 2026: NVIDIA BioNeMo adopted by leading life-science firms to accelerate AI-driven drug discovery, underscoring rising demand for generative-AI visualization platforms.
- January 2026: Illumina released the Billion Cell Atlas dataset as part of a three-year plan to map five billion cells, aiming to train large-scale disease-biology models.
- January 2026: Arthur Glowacki demonstrated big-data X-ray fluorescence visualization at the Advanced Photon Source, making complex spectroscopy outputs actionable for researchers.
- January 2025: Insilico Medicine deployed its Nach01 multimodal foundation model on Microsoft Discovery to orchestrate secure, Azure-native workflows for computational drug discovery.


Global Biological Data Visualization Market Report Scope
The Biological Data Visualization Market Report is Segmented by Technique (Microscopy, Magnetic Resonance Imaging, Sequencing, X-ray Crystallography, Others), Application (Cell & Organism Imaging, Structural Biology & Molecular Modeling, Genomic Analysis, Alignments, Phylogeny & Evolution, Systems Biology), Deployment Model (On-Premise, Cloud-Based, Hybrid), End-User (Academic Research, Pharmaceutical & Biotechnology Companies, Hospitals & Clinics, Other Users), and Geography (North America, Europe, Asia-Pacific, Middle East & Africa, South America). The Market Forecasts are Provided in Terms of Value (USD).
| Microscopy |
| Magnetic Resonance Imaging |
| Sequencing |
| X-ray Crystallography |
| Others |
| Cell & Organism Imaging |
| Structural Biology & Molecular Modeling |
| Genomic Analysis |
| Alignments, Phylogeny & Evolution |
| Systems Biology |
| On-Premise |
| Cloud-Based |
| Hybrid |
| Academic Research |
| Pharmaceutical & Biotechnology Companies |
| Hospitals & Clinics |
| Other Users |
| North America | United States |
| Canada | |
| Mexico | |
| Europe | Germany |
| United Kingdom | |
| France | |
| Italy | |
| Spain | |
| Rest of Europe | |
| Asia-Pacific | China |
| Japan | |
| India | |
| Australia | |
| South Korea | |
| Rest of Asia-Pacific | |
| Middle East & Africa | GCC |
| South Africa | |
| Rest of Middle East & Africa | |
| South America | Brazil |
| Argentina | |
| Rest of South America |
| By Technique | Microscopy | |
| Magnetic Resonance Imaging | ||
| Sequencing | ||
| X-ray Crystallography | ||
| Others | ||
| By Application | Cell & Organism Imaging | |
| Structural Biology & Molecular Modeling | ||
| Genomic Analysis | ||
| Alignments, Phylogeny & Evolution | ||
| Systems Biology | ||
| By Deployment Model | On-Premise | |
| Cloud-Based | ||
| Hybrid | ||
| By End-User | Academic Research | |
| Pharmaceutical & Biotechnology Companies | ||
| Hospitals & Clinics | ||
| Other Users | ||
| By Geography | North America | United States |
| Canada | ||
| Mexico | ||
| Europe | Germany | |
| United Kingdom | ||
| France | ||
| Italy | ||
| Spain | ||
| Rest of Europe | ||
| Asia-Pacific | China | |
| Japan | ||
| India | ||
| Australia | ||
| South Korea | ||
| Rest of Asia-Pacific | ||
| Middle East & Africa | GCC | |
| South Africa | ||
| Rest of Middle East & Africa | ||
| South America | Brazil | |
| Argentina | ||
| Rest of South America | ||


Key Questions Answered in the Report
What CAGR is the biological data visualization market expected to post through 2031?
The market is projected to grow at a 9.41% CAGR between 2026 and 2031.
Which application currently dominates spending within biological data visualization?
Genomic analysis led with 66.03% of 2025 revenue.
Why is Asia-Pacific viewed as the fastest-growing geography?
China’s National GeneBank, India’s BioNEST incubators and regional precision-medicine budgets drive a 16.03% forecast CAGR.
How do WebGPU renderers alter deployment strategies in hospitals?
They enable GPU-accelerated visualization inside air-gapped browsers, satisfying data-localization laws without external clouds.
Which deployment model is expanding most rapidly?
Cloud-based platforms will advance at a 15.13% CAGR thanks to managed services such as Terra and AWS HealthOmics.
Page last updated on:


