Biologic Excipients Market Size and Share
Market Overview
| Study Period | 2020 - 2031 |
|---|---|
| Market Size (2026) | USD 5.70 Billion |
| Market Size (2031) | USD 8.70 Billion |
| Growth Rate (2026 - 2031) | 8.61% CAGR |
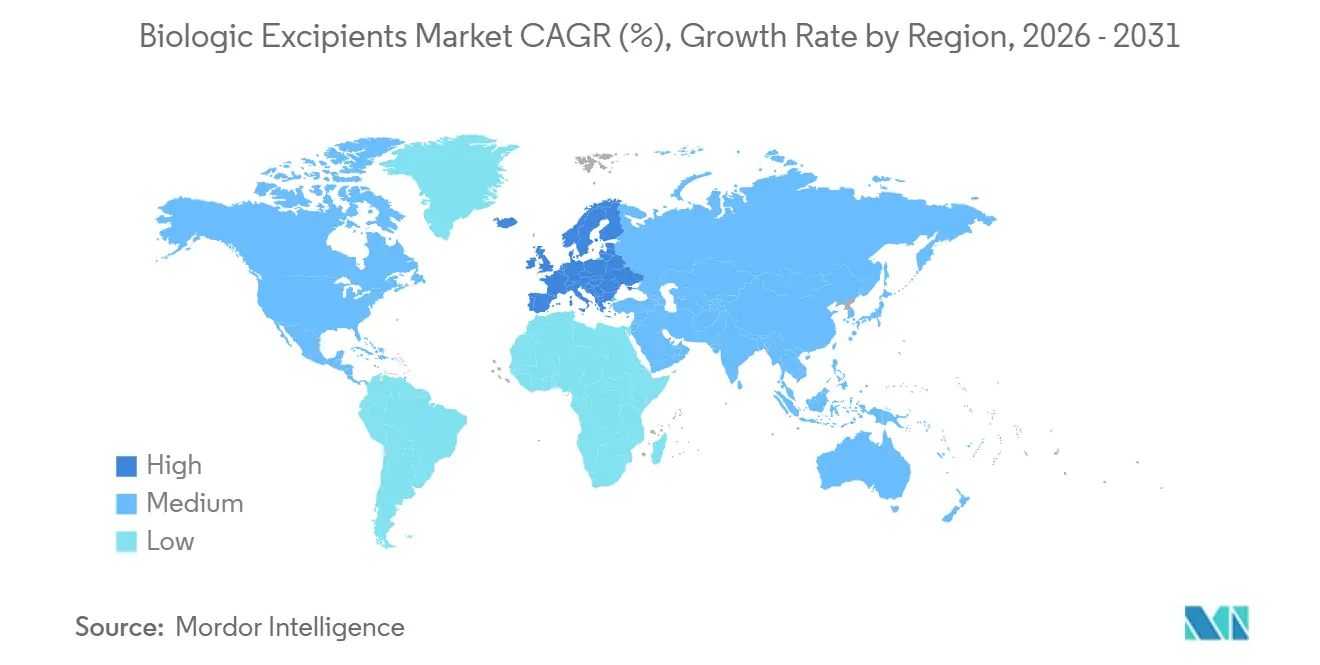
| Fastest Growing Market | Europe |
| Largest Market | North America |
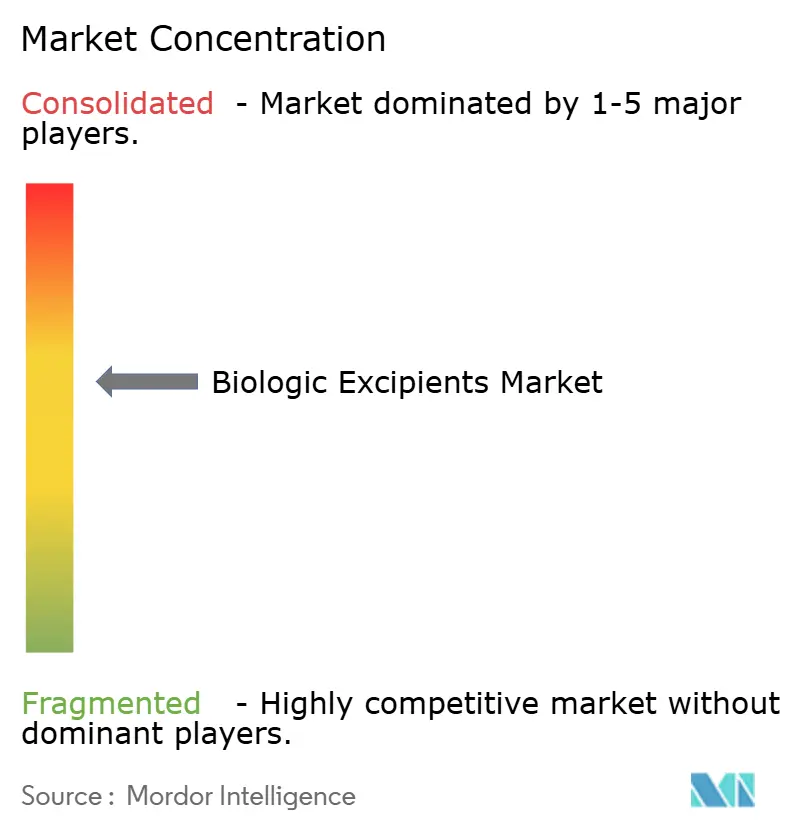
| Market Concentration | Medium |
Major Players
*Disclaimer: Major Players sorted in no particular order Image © Mordor Intelligence. Reuse requires attribution under CC BY 4.0. |
|
Biologic Excipients Market Analysis by Mordor Intelligence
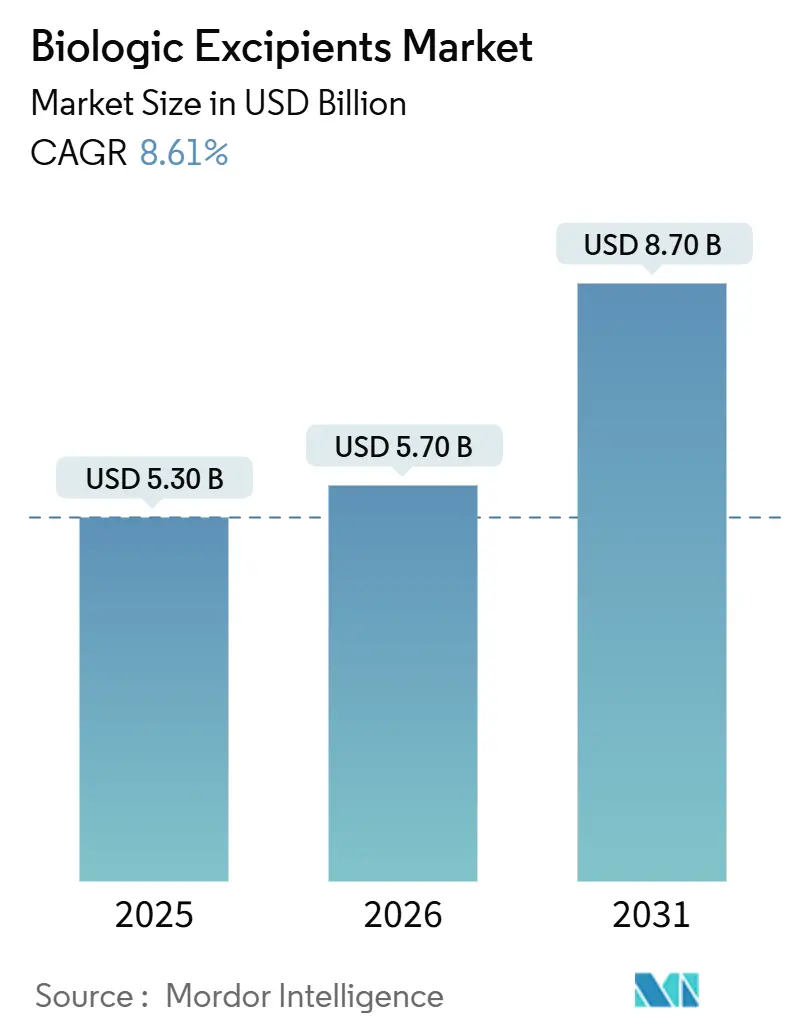
The Biologic Excipients Market size is projected to expand from USD 5.30 billion in 2025 and USD 5.70 billion in 2026 to USD 8.70 billion by 2031, registering a CAGR of 8.61% between 2026 to 2031.
Robust clinical pipelines, rising approvals of injectable biologics, and tightening pharmacopeial standards are the principal demand catalysts. North American and European regulators have clarified data expectations for novel excipients, shortening qualification timelines and stimulating supplier innovation [1]“Inactive Ingredients in Biological Products – Guidance for Industry,” U.S. Food and Drug Administration, fda.gov. Capacity additions by Asian CDMOs are localizing supply chains, compressing freight lead times for parenteral-grade ingredients. At the product level, specialty and co-processed grades that combine buffering, stabilization, and viscosity reduction are outpacing commodity polymers and carbohydrates. Competitive intensity remains moderate because no supplier controls a majority share across all categories, yet incumbents with extensive Drug Master Files enjoy a regulatory moat.
Key Report Takeaways
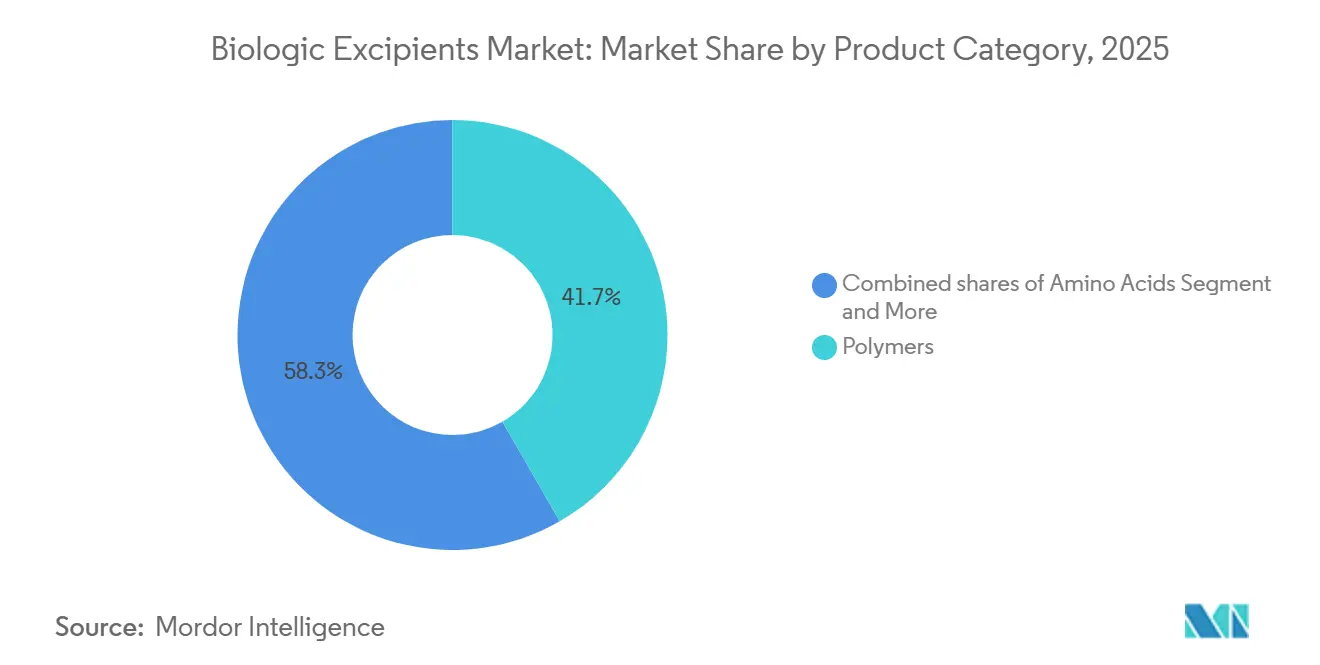
- By product category, polymers led with 41.68% revenue share in 2025, while specialty and co-processed grades are forecast to expand at an 8.80% CAGR through 2031.
- By dosage form, parenteral formulations captured 58.93% of the biologic excipients market share in 2025; lyophilized products are projected to post an 8.91% CAGR over 2026-2031.
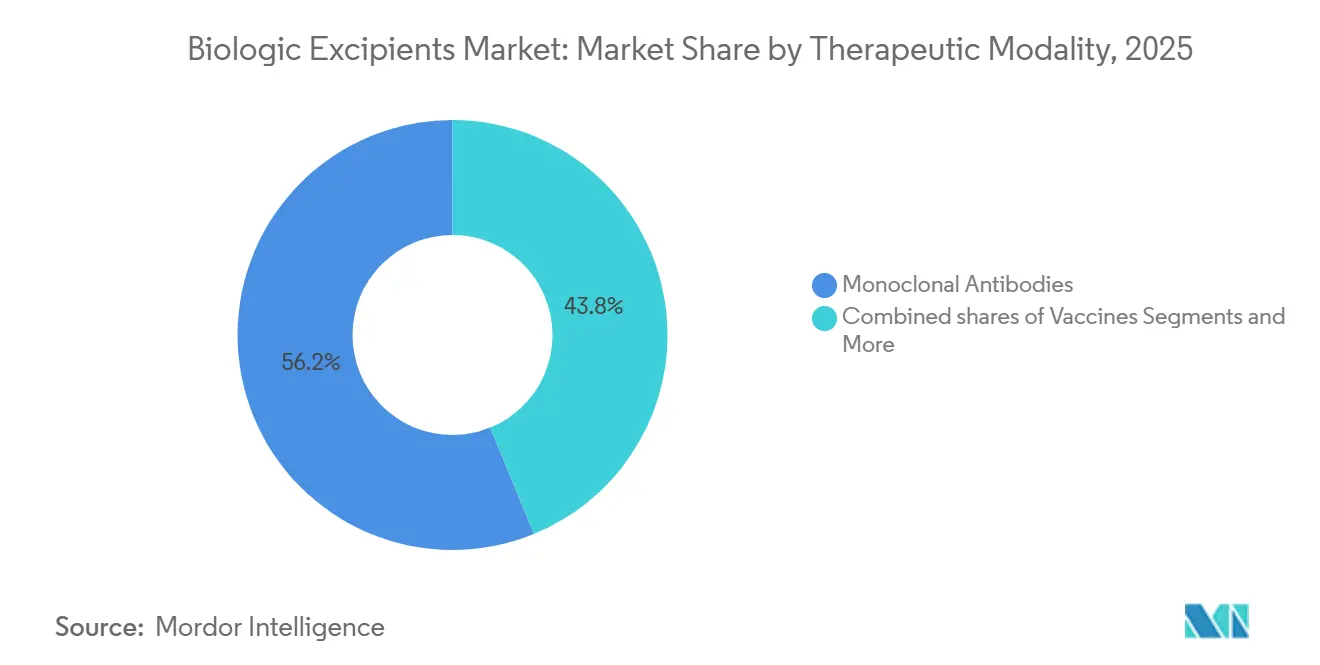
- By therapeutic modality, monoclonal antibodies held a 56.18% share of the biologic excipients market in 2025 and are advancing at a 9.01% CAGR through 2031.
- By end user, biopharma and biotech companies accounted for 61.87% of demand in 2025, whereas CMOs/CDMOs recorded the fastest CAGR at 8.87% through 2031.
- By geography, North America led with 43.87% of the global biologic excipients market share, whereas Europe is expected to grow at a CAGR 8.78% through 2031.
Note: Market size and forecast figures in this report are generated using Mordor Intelligence’s proprietary estimation framework, updated with the latest available data and insights as of January 2026.
Global Biologic Excipients Market Trends and Insights
Drivers Impact Analysis*
| Driver | (~) % Impact on CAGR Forecast | Geographic Relevance | Impact Timeline |
|---|---|---|---|
| Biologics pipeline expansion and approvals accelerate demand for injectable-grade excipients | +1.8% | Global, led by North America and Europe | Medium term (2-4 years) |
| Dominance of parenteral routes increases need for high-purity stabilizers, buffers, surfactants | +1.5% | Global, concentrated in North America, Europe, APAC core | Long term (≥ 4 years) |
| Monoclonal antibodies and high-concentration formulations require viscosity-reducing / stabilizing excipients | +1.3% | Global, with North American and European R&D hubs | Medium term (2-4 years) |
| APAC biomanufacturing and CDMO expansion boosts excipient consumption | +1.2% | APAC core (China, India, South Korea), spill-over to MEA | Medium term (2-4 years) |
| FDA / USP initiatives lower uncertainty for novel excipient adoption in biologics | +0.9% | North America & EU, regulatory influence extends globally | Short term (≤ 2 years) |
| Shift to ultra-pure / engineered excipients to mitigate degradation | +0.7% | Global, early adoption in North America and Europe | Long term (≥ 4 years) |
| Source: Mordor Intelligence | |||
Biologics Pipeline Expansion and Approvals Accelerate Demand for Injectable-Grade Excipients
Global regulators cleared 55 novel drugs in 2024, and biologics accounted for a significant share of them. Each biologic typically employs four-to-eight discrete excipients, so every approval magnifies consumption of buffers, stabilizers, surfactants, and tonicity agents. The subcutaneous share of monoclonal antibody launches now has a significant share in the market, which pushes purity specifications even tighter to avoid local reactions. EMA cleared 12 biosimilars in 2025, obliging each developer to match or justify every excipient choice, thereby multiplying demand for injectable-grade ingredients. Innovators and biosimilar manufacturers consequently compete for the same finite pool of ultra-pure stabilizers.
Dominance of Parenteral Routes Increases Need for High-Purity Stabilizers, Buffers, and Surfactants
Parenteral products impose endotoxin limits of ≤ 0.5 EU / mg and elemental impurity controls under ICH Q3D. USP tightened particulate limits for prefilled syringes in 2024, compelling suppliers to adopt cleanroom packaging[2]“General Chapter <1> Injections and Implanted Drug Products,” United States Pharmacopeia, usp.org. High-concentration monoclonal antibody formats rely on arginine hydrochloride or proline at 50-200 mM to suppress viscosity. Croda’s 2025 “Super Refined” polysorbate 80, with peroxide below 5 ppm, illustrates the pivot toward engineered excipients that address oxidation in dense protein solutions.
Monoclonal Antibodies and High-Concentration Formulations Require Viscosity-Reducing / Stabilizing Excipients
Monoclonal antibodies drive the biologic excipients market because self-administered subcutaneous products need concentrations above 150 mg / mL, which can exceed 20 cP. Arginine hydrochloride, histidine buffers, and polysorbate 20 mitigate aggregation, yet their interplay can induce opalescence during long storage. Evonik’s 2024 co-processed arginine-polyol excipient lowered viscosity by 30% in a 200 mg / mL IgG1 formulation, signaling industry movement toward multifunctional solutions.
APAC Biomanufacturing and CDMO Expansion Boosts Excipient Consumption
Asia-Pacific added 1.8 million L of biologics capacity across 2024-2025. WuXi Biologics’ USD 1.2 billion Wuxi campus and Samsung Biologics’ 256,000 L Plant 4 localize demand for parenteral-grade polysorbates, sugars, and buffers. Domestic excipient production in Japan and China is shortening delivery cycles from 12 weeks to 4 weeks, helping regional formulators adjust batches faster during clinical trials.
Restraints Impact Analysis*
| Restraint | (~) % Impact on CAGR Forecast | Geographic Relevance | Impact Timeline |
|---|---|---|---|
| Lack of independent global excipient approval pathways delays novel excipient uptake | -0.6% | Global, most acute outside ICH regions | Long term (≥ 4 years) |
| High cost and supply complexity for parenteral-grade excipients vs oral grades | -0.5% | Global, pricing pressure strongest in APAC & Latin America | Medium term (2-4 years) |
| Stringent endotoxin / elemental impurity controls complicate supplier changes | -0.4% | Global, burden highest in North America & Europe | Medium term (2-4 years) |
| Polysorbate degradation risks raise QC burden and reformulation cycles | -0.3% | Global, impacting high-concentration mAb and ADC formats | Short term (≤ 2 years) |
| Source: Mordor Intelligence | |||
Lack of Independent Global Excipient Approval Pathways Delays Novel Excipient Uptake
Because excipients are approved within each drug dossier, suppliers must piggyback on biopharma partners, creating a circular risk that stalls innovation. The FDA’s database lists only 42 excipients permitted for parenteral biologics, unchanged since 2022. Emerging economies also impose local studies, adding up to 18 months, and discouraging smaller innovators.
High Cost and Supply Complexity for Parenteral-Grade Excipients vs Oral Grades
Injectable polysorbate 80 costs USD 80-120 / kg, four-to-five times oral-grade. Trehalose spikes to USD 200-300 / kg under injectable specs. Just six manufacturers worldwide supply pharmaceutical-grade polysorbate at scale; a 2024 fire eliminated 15% of capacity for eight months, forcing emergency re-qualifications and delaying launches [3]Croda Acquires Specialty Surfactant Manufacturer,” Croda International, croda.com.
*Our forecasts treat driver/restraint impacts as directional, not additive. The impact forecasts reflect baseline growth, mix effects, and variable interactions.
Segment Analysis
By Product Category: Multifunctional Excipients Gain Share
Polymers commanded 41.68% of 2025 revenue within the biologic excipients market size, anchored by PEG and HPMC for sustained-release syringes. Specialty and co-processed grades, however, are on track for an 8.80% CAGR, benefiting suppliers that combine buffering and viscosity control in one particle. Roquette’s mannitol-sucrose blend trims lyophilization cycles by 20%, demonstrating why formulators are migrating from single-function fillers to engineered composites. Carbohydrates such as trehalose safeguard protein tertiary structure during freeze-dry, while amino acids like arginine hydrochloride now appear in the majority of subcutaneous mAb recipes.
Surfactant demand remains dominated by polysorbate 20 and 80, yet oxidation has accelerated the search for poloxamers and recombinant albumin. Inorganic salts preserve tonicity, with phosphate still preferred for mAbs. The biologic excipients market continues to reward suppliers that document ultra-low endotoxin and peroxide profiles, a trend likely to cement premium-tier pricing over the forecast window.


By Dosage Form: Parenteral Dominance Reflects Injectable Biologics' Primacy
Parenteral formats delivered 58.93% of 2025 revenue and are projected to hold the biologic excipients market share lead through 2031 as oral bioavailability hurdles persist. Lyophilized vials are the fastest-growing sub-segment because they extend shelf life and can eliminate cold-chain logistics; a trastuzumab biosimilar approved in 2024 validated room-temperature storage for 36 months. High-purity sugars and bulking polyols are essential for these freeze-dry cycles, keeping excipient demand strong even as equipment costs remain high.
Oral peptides such as oral semaglutide showcase gradual diversification, but volumes are dwarfed by injectables. Topical biologics stay niche. Consequently, suppliers continue to expand cleanroom capacity for injectable-grade buffers, reinforcing a virtuous cycle in which parenteral requirements dictate quality benchmarks for the wider biologic excipients market.
By Therapeutic Modality: Monoclonal Antibodies Drive Viscosity-Reducing Excipient Demand
Monoclonal antibodies still anchor 56.18% of 2025 consumption and power a 9.01% CAGR forward. Concentrations above 150 mg / mL elevate viscosity beyond 20 cP, necessitating high-molality arginine hydrochloride and surfactant pairs tailored to each IgG isotype. The biologic excipients market size linked to vaccines also remains meaningful because mRNA platforms require pharmaceutical-grade cholesterol and DSPC from a triopoly of suppliers.
Cell and gene therapies impose the strictest thresholds: endotoxin below 0.25 EU / mg and animal-origin-free certificates are non-negotiable. Recombinant proteins, insulins, and antibody-drug conjugates round out demand, each layering on distinctive stability challenges that keep the pipeline for engineered excipients active.
By End User: Biopharma In-House Formulation Protects IP
Biopharma and biotech companies retained 61.87% of 2025 demand for the biologic excipients market, preferring internal formulation labs that safeguard intellectual property. High-throughput screening now screens hundreds of excipient permutations, accelerating IND timelines. CMOs / CDMOs, the next-largest cohort, use bulk-purchase contracts to shave 15-25% off excipient costs and are adding analytical suites to offer turnkey development. Academic centers need small but ultra-pure lots, a profitable micro-segment for distributors willing to repack 1-kg orders.
Growing regulatory divergence means innovators often cling to excipients with global precedent, whereas emerging-market firms can adopt novel stabilizers if cost savings offset re-qualification hurdles. This divide is prompting suppliers to tailor portfolios either to commodity volume or premium innovation, reinforcing mid-level market fragmentation.
Geography Analysis
North America contributed 43.87% of 2025 revenue, buoyed by FDA guidance that cut excipient qualification timelines by two years. Twelve of the world’s 20 largest biologic producers call the United States home, and their 2025 formulation R&D outlays exceeded USD 8 billion. Canada’s CAD 2.2 billion biomanufacturing plan funds three new plants that will absorb polysorbate and trehalose once operational. Mexican near-shoring adds further pull, exemplified by Pfizer’s USD 500 million Toluca syringe line expanded in 2025.
Europe is projected to log the fastest regional CAGR at 8.78% through 2031. German CDMOs have added 180,000 L since 2024, and France’s EUR 1 billion Sanofi upgrade embeds dedicated suites for high-concentration mAbs. The MHRA’s 2025 realignment with EMA standards restored regulatory clarity in the United Kingdom. Italy and Spain are emerging low-cost hubs that nevertheless meet EU monograph requirements, attracting biosimilar contracts.
Asia-Pacific saw USD 6.8 billion in 2024-2025 capacity investments, pushing local biologic output above 2 million L. China’s Wuxi and Henlius sites, India’s biosimilar expansions, and South Korea’s Samsung Biologics mega-plant collectively tighten the loop between formulation labs and excipient suppliers. Japan’s NOF Corporation now supplies injectable polysorbate domestically, trimming lead times to four weeks. Australia and ASEAN markets remain smaller but benefit from harmonized TGA and EMA excipient rules.
The Middle East and Africa segment is nascent but strategic. Saudi Arabia aims to cover nearly one third of its pharmaceutical needs locally by 2030, and South Africa’s Biovac Institute is retrofitting capacity for mRNA vaccines. South America’s activity centers on Brazil’s USD 300 million Rio facility and Argentina’s mAbxience expansion, both of which will depend on regional trehalose and buffer imports until local purification capacity matures.

Competitive Landscape
Competitive intensity is moderate: the five largest suppliers—Merck KGaA, BASF, Roquette, Evonik, and Croda control a significant share of revenues. Roquette’s 2024 co-location venture with a European CDMO illustrates a shift toward embedded supply that shortens excipient lead times from eight weeks to two. Patent trends favor multifunctional excipients such as Evonik’s arginine-polyol blend that simultaneously cuts viscosity and stabilizes protein payloads.
Disruptors like InVitria leverage recombinant expression to deliver animal-origin-free albumin for cell culture and injectable stabilizers. Merck KGaA’s machine-learning platform predicts protein-excipient fit and trims screening cycles by significantly. USP monograph coverage remains a gatekeeper; excipients lacking a monograph add USD 200,000-500,000 in bespoke testing, delaying uptake among smaller biotech firms. The market therefore bifurcates into a commodity tier serving biosimilars with established grades and a premium tier that commands 3-5× pricing for engineered, ultra-pure solutions.
Biologic Excipients Industry Leaders
-
Merck KGaA
-
BASF SE
-
Roquette Frères
-
Evonik Industries AG
-
Croda International Plc
- *Disclaimer: Major Players sorted in no particular order

Recent Industry Developments
- April 2026: Oxford BioTherapeutics & Bristol Myers Squibb announced collaboration to discover T-cell engager therapies for solid tumors using specialized discovery platforms.
- May 2025: Univar Solutions & Krahn Chemie expanded their specialty ingredient distribution partnership into key European pharmaceutical and nutraceutical markets.


Global Biologic Excipients Market Report Scope
As per the scope of the report, biologic excipients are inactive ingredients intentionally added to biologic drug products such as monoclonal antibodies, vaccines, and recombinant proteins to enhance their stability, efficacy, and delivery. Because biologics are large, complex molecules derived from living sources, they are inherently unstable and prone to physical and chemical degradation from environmental factors like temperature, pH, and light. Excipients address these challenges by acting as stabilizers, solvents, buffers, and antioxidants.
The biologic excipients market is segmented by product category, dosage form, therapeutic modality, end user, and geography. By product category, the market is segmented into solubilizers & surfactants/emulsifiers, carbohydrates (sugars), polyols, polymers, amino acids, inorganic salts, specialty / co‑processed excipients, and others. By dosage form, the market is segmented into parenteral, lyophilized, oral, and topical. By therapeutic modality, the market is segmented into monoclonal antibodies, vaccines, cell & gene therapies, recombinant proteins/enzymes, insulins & analogs, and ADCs & long‑acting injectables. End users include biopharmaceutical and biotech companies (drug developers), contract manufacturing and development organizations (CMOs/CDMOs), academic and research institutions, and other related entities.
Geographically, the market is segmented across North America, Europe, the Asia-Pacific region, the Middle East & Africa, and South America. The market report also covers the estimated market sizes and trends for 17 countries across major regions globally. For each segment, the market size and forecast are provided in terms of value (USD).
| Solubilizers & Surfactants/Emulsifiers |
| Carbohydrates (Sugars) |
| Polyols |
| Polymers |
| Amino Acids |
| Inorganic Salts |
| Specialty / Co‑processed Excipients |
| Others |
| Parenteral (Injectables) |
| Lyophilized (Freeze‑dried) |
| Oral |
| Topical |
| Monoclonal Antibodies |
| Vaccines |
| Cell & Gene Therapies (incl. mRNA) |
| Recombinant Proteins/Enzymes |
| Insulins & Analogs |
| ADCs & Long‑acting Injectables |
| Biopharma & Biotech Companies (Drug Developers) |
| CMOs/CDMOs |
| Academic/Research & Others |
| North America | United States |
| Canada | |
| Mexico | |
| Europe | Germany |
| United Kingdom | |
| France | |
| Italy | |
| Spain | |
| Rest of Europe | |
| Asia-Pacific | China |
| India | |
| Japan | |
| South Korea | |
| Australia | |
| Rest of Asia-Pacific | |
| Middle East and Africa | GCC |
| South Africa | |
| Rest of Middle East and Africa | |
| South America | Brazil |
| Argentina | |
| Rest of South America |
| By Product Category | Solubilizers & Surfactants/Emulsifiers | |
| Carbohydrates (Sugars) | ||
| Polyols | ||
| Polymers | ||
| Amino Acids | ||
| Inorganic Salts | ||
| Specialty / Co‑processed Excipients | ||
| Others | ||
| By Dosage Form | Parenteral (Injectables) | |
| Lyophilized (Freeze‑dried) | ||
| Oral | ||
| Topical | ||
| By Therapeutic Modality | Monoclonal Antibodies | |
| Vaccines | ||
| Cell & Gene Therapies (incl. mRNA) | ||
| Recombinant Proteins/Enzymes | ||
| Insulins & Analogs | ||
| ADCs & Long‑acting Injectables | ||
| By End User | Biopharma & Biotech Companies (Drug Developers) | |
| CMOs/CDMOs | ||
| Academic/Research & Others | ||
| By Geography | North America | United States |
| Canada | ||
| Mexico | ||
| Europe | Germany | |
| United Kingdom | ||
| France | ||
| Italy | ||
| Spain | ||
| Rest of Europe | ||
| Asia-Pacific | China | |
| India | ||
| Japan | ||
| South Korea | ||
| Australia | ||
| Rest of Asia-Pacific | ||
| Middle East and Africa | GCC | |
| South Africa | ||
| Rest of Middle East and Africa | ||
| South America | Brazil | |
| Argentina | ||
| Rest of South America | ||


Key Questions Answered in the Report
How large is global spending on biologic excipients today?
Global spending reached USD 5.7 billion in 2026 and is projected to grow to USD 8.7 billion by 2031.
Which dosage form consumes the most injectable-grade excipients?
Parenteral formulations dominate, accounting for 58.93% of 2025 revenue and maintaining the lead through 2031.
Why are specialty and co-processed excipients growing faster than commodity grades?
They cut manufacturing steps, reduce viscosity, and improve stability, supporting an 8.80% CAGR that outpaces the overall market.
Which therapeutic modality drives the highest excipient demand?
Monoclonal antibodies lead consumption and are forecast to expand at a 9.01% CAGR through 2031, especially in high-concentration subcutaneous formats.
Page last updated on:


