
Market Overview
| Study Period | 2022 - 2031 |
|---|---|
| Market Size (2026) | USD 621.93 Billion |
| Market Size (2031) | USD 848.47 Billion |
| Growth Rate (2026 - 2031) | 6.44 % |
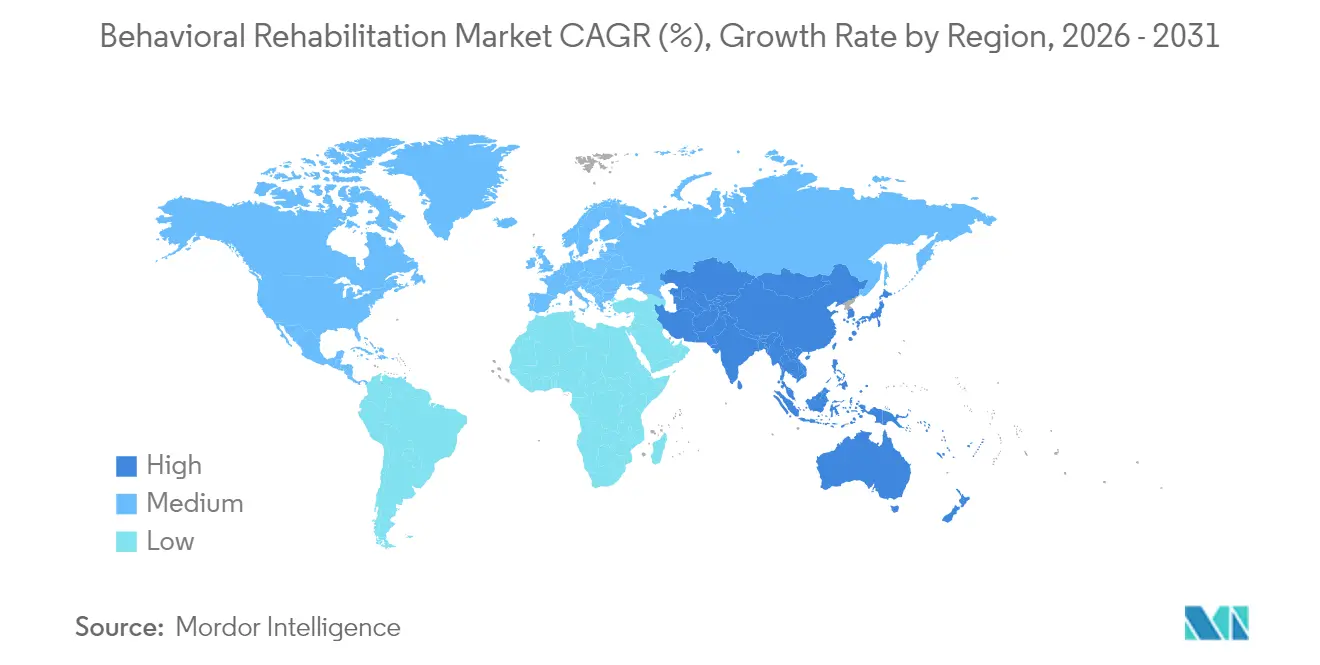
| Fastest Growing Market | Asia Pacific |
| Largest Market | North America |
| Market Concentration | Medium |
Major Players *Disclaimer: Major Players sorted in no particular order Image © Mordor Intelligence. Reuse requires attribution under CC BY 4.0. | |
Behavioral Rehabilitation Market Analysis by Mordor Intelligence
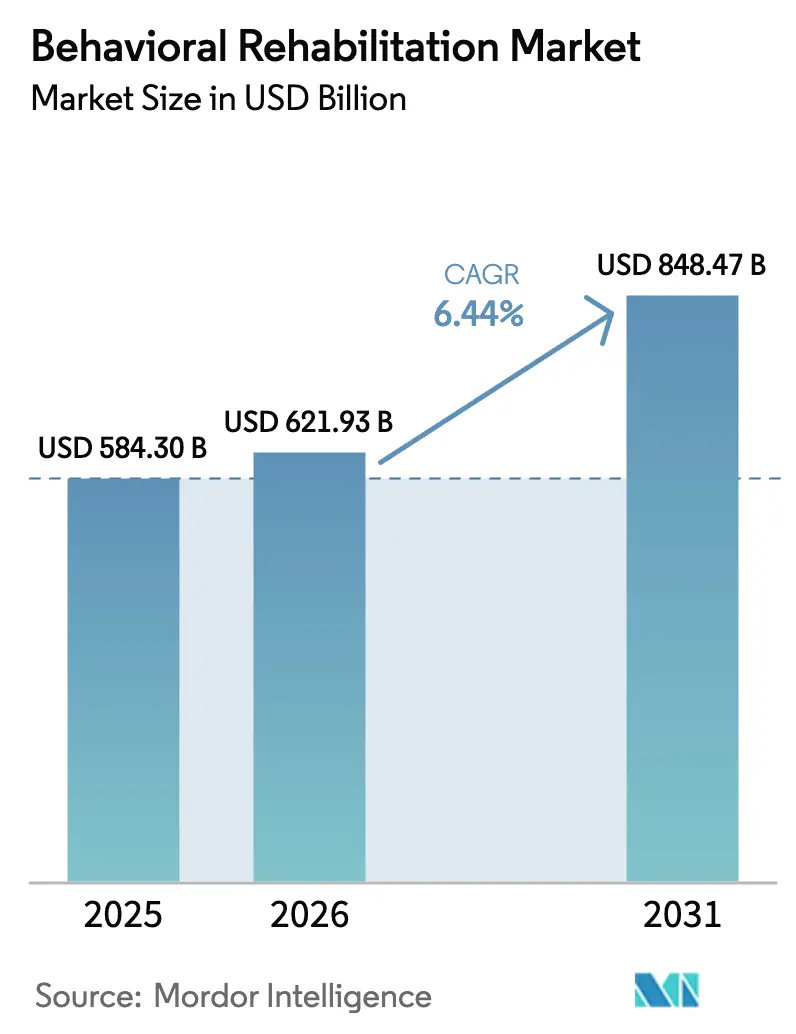
The behavioral rehabilitation market size in 2026 is estimated at USD 621.93 billion, growing from 2025 value of USD 584.3 billion with 2031 projections showing USD 848.47 billion, growing at 6.44% CAGR over 2026-2031. Solid demand stems from rising mental-health prevalence, swift telehealth uptake, and policy moves that mandate parity between behavioral and medical benefits. Anxiety disorders retain the largest behavioral rehabilitation market share at 31% in 2024, reflecting heightened diagnosis and treatment-seeking behavior. Outpatient programs command 37% revenue owing to community-based models that trim costs and stigma. The virtual/tele-rehabilitation niche is expanding at 12.4% CAGR as permanent Medicare flexibilities open remote access. North America leads with 42% revenue, while Asia-Pacific posts the fastest 7% CAGR on the back of public-health campaigns and growing disposable incomes.
Key Report Takeaways
- By disorder type, anxiety disorders accounted for 30.86% behavioral rehabilitation market share in 2025, whereas substance abuse disorders are projected to grow at 7.63% CAGR through 2031.
- By healthcare setting, outpatient programs led with 36.68% revenue share in 2025; inpatient crisis-oriented services are forecast to rise at 6.78% CAGR to 2031.
- By treatment method, counselling held 47.55% share of the behavioral rehabilitation market size in 2025, while cognitive behavioral therapy is poised for 8.69% CAGR between 2026-2031.
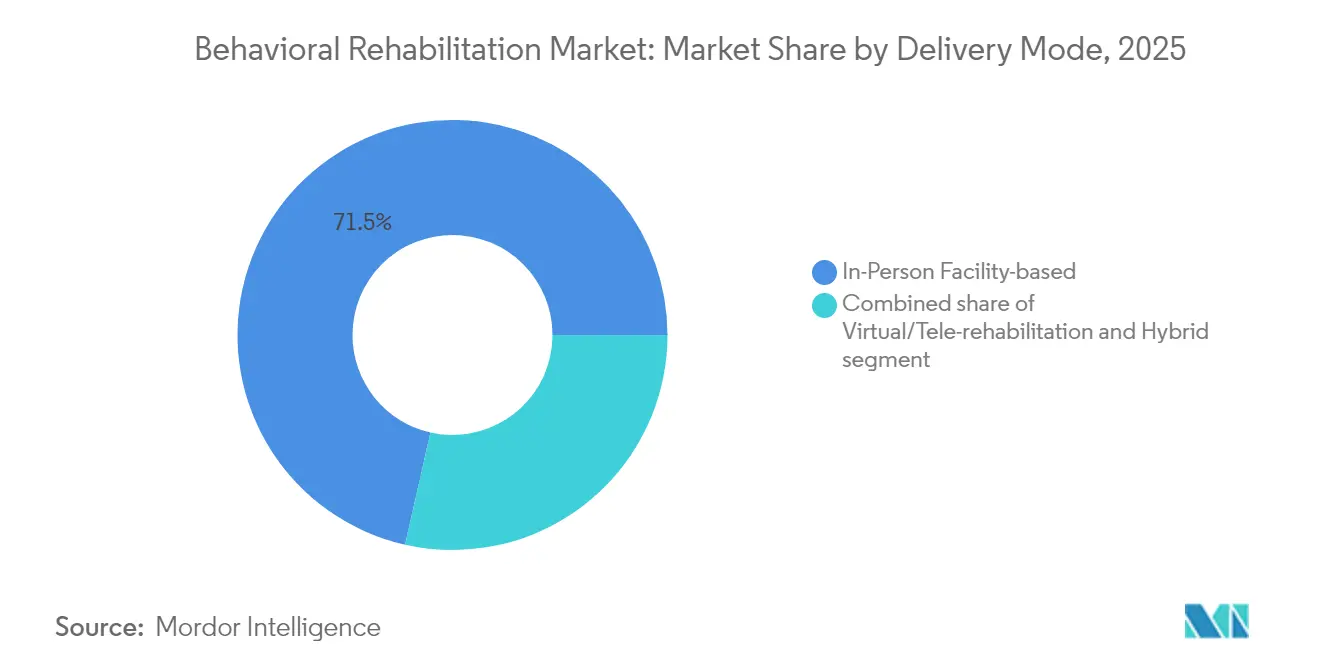
- By delivery mode, in-person services captured 71.46% revenue in 2025, but virtual/tele-rehabilitation is advancing at 12.04% CAGR through 2031.
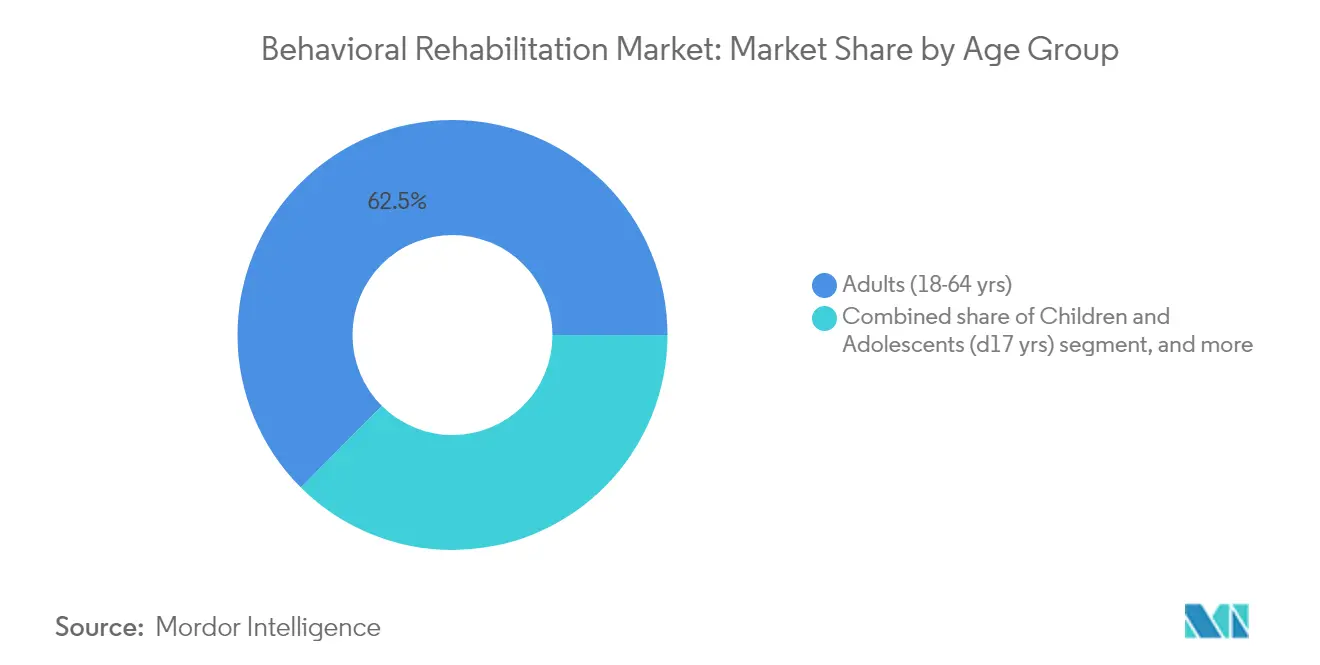
- By age group, adults (18-64 yrs) segment captured 62.54% revenue in 2025, whereas, geriatric (≥65 yrs) is advancing at 7.08% CAGR through 2031.
- By geography, North America contributed 41.72% revenue in 2025; Asia-Pacific is on track for the highest 6.88% CAGR to 2031.
Note: Market size and forecast figures in this report are generated using Mordor Intelligence’s proprietary estimation framework, updated with the latest available data and insights as of 2026.
Market Trends and Insights
Drivers Impact Analysis of Behavioral Rehabilitation Market*
| Driver | % Impact on CAGR Forecast | Geographic Relevance | Impact Timeline |
|---|---|---|---|
| Escalating global disease burden | +6.0% | Global | Long term (≥ 4 years) |
| Coverage-parity regulations | +4.0% | United States, Europe | Medium term (2-4 years) |
| Telehealth & digital expansion | +5.0% | Global | Short term (≤ 2 years) |
| Private-equity investment & standardization | +3.0% | North America, Europe | Medium term (2-4 years) |
| Primary-care integration | +2.5% | United States | Medium term (2-4 years) |
| Workforce innovation (peer support, AI triage) | +2.0% | Global | Short term (≤ 2 years) |
| Source: Mordor Intelligence | |||
Escalating Global Mental-Health Disease Burden Accelerating Demand
The worldwide rise in mental-health disorders is stretching existing treatment capacity. One-third of the U.S. population lives in designated Mental Health Professional Shortage Areas, demonstrating the gap between service need and availability[1]U.S. Department of Health and Human Services, “National Health Professional Shortage Areas,” hhs.gov. Drug-overdose deaths exceeded 107,000 in 2021, and untreated behavioral conditions cost the U.S. economy USD 280 billion annually in lost productivity and medical expenses. These figures underscore the imperative for capacity expansion across all treatment modalities.
Government Policy Shifts Toward Coverage Parity
Final rules under the Mental Health Parity and Addiction Equity Act take effect on January 1, 2025, prohibiting health plans from applying stricter limits to behavioral health than to medical benefits[2]U.S. Department of Labor, “MHPAEA Final Rules Fact Sheet,” dol.gov. Plans must analyze network adequacy and utilization management, which is expected to widen coverage for millions of Americans. CMS’s 2025 physician fee schedule also adds new codes for FDA-cleared digital therapeutics and safety-planning services, unlocking fresh reimbursement pathways for providers.
Rapid Adoption of Telehealth & Digital Platforms
Behavioral health now records the highest share of remote visits across U.S. specialties, with 38% of encounters delivered virtually in 2023. Congress has extended Medicare telehealth flexibilities through March 31 2025 and permanently allowed Federally Qualified Health Centers to serve as distant-site providers[3]U.S. Department of Health and Human Services, “National Health Professional Shortage Areas,” hhs.gov. Telehealth is saving an estimated USD 42 billion annually by reducing emergency visits and travel barriers, while AI-enabled assessment tools refine triage accuracy.
Integration of Behavioral Health into Primary-Care Pathways
Frameworks released by the American Medical Association standardize behavioral health integration within primary-care teams, pairing routine screenings with warm handoffs to specialists. CMS will launch the ACO Primary Care Flex Model in 2025, providing prospective per-member payments to practices that embed behavioral clinicians. States such as California are injecting USD 140 million into equity-focused practice-transformation grants that prioritize integrated mental-health workflows.
Restraints Impact Analysis of Behavioral Rehabilitation Market*
| Restraints Impact Analysis | (~) % Impact on CAGR Forecast | Geographic Relevance | Impact Timeline |
|---|---|---|---|
| Stigma & cultural barriers | –4.0% | Global | Long term (≥ 4 years) |
| Licensed-workforce shortages | –6.0% | United States, Rural regions worldwide | Medium term (2-4 years) |
| Fragmented reimbursement models | –3.0% | Global | Short term (≤ 2 years) |
| Data-privacy & cross-border rules | –2.0% | Global | Short term (≤ 2 years) |
| Source: Mordor Intelligence | |||
Persistent Stigma & Cultural Barriers Limiting Service Uptake
Only 58.5% of U.S. teenagers reported adequate emotional and social support in 2024, and 91% of Hispanic Americans with substance-use disorders did not receive needed treatment. Cultural norms, language gaps, and mistrust of formal systems hamper engagement even when services exist. Community-based outreach, bilingual workforce development, and culturally relevant peer-support models are essential to close this divide.
Shortage of Licensed Behavioral-Health Professionals Restricting Scalability
Federal projections indicate a deficit of 113,930 addiction counselors, 87,840 mental-health counselors, and 50,440 psychiatrists by 2037. Seventy percent of U.S. counties lack a child psychiatrist, correlating with higher adolescent-suicide rates. Burnout remains rampant; up to 61% of mental-health workers report significant stress and depression. Scaling paraprofessional roles, expanding loan-forgiveness incentives, and broadening tele-supervision can partially offset the talent gap.
*Our forecasts treat driver/restraint impacts as directional, not additive. The impact forecasts reflect baseline growth, mix effects, and variable interactions.
Behavioral Rehabilitation Market Segment Analysis
By Type of Behavioral Disorder:
Anxiety Maintains Lead While Substance Abuse SurgesAnxiety disorders contributed 30.86% to the behavioral rehabilitation market size in 2025, cementing their status as the dominant segment. Rising diagnosis rates and broader insurance coverage promote early intervention, while AI-based monitoring tools have lifted adherence by 45%. Digital therapeutics that deliver cognitive-behavioral content via mobile apps reinforce therapist-led protocols and extend reach beyond clinic walls. Immersive VR exposure therapy, for instance, helps recalibrate maladaptive fear responses and shortens course duration.
Substance-abuse disorders are projected to log a 7.63% CAGR between 2026 and 2031. Policy priority reflects the ongoing opioid crisis, with USD 1.6 billion earmarked for the State Opioid Response program in 2025. Medication-assisted treatment expansion and 988 crisis-line funding support earlier identification and referral. Managed-care penetration is steering providers toward value-based contracts that reward sustained abstinence, nudging facilities to adopt data-driven outcome tracking and wraparound social-support services.




By Healthcare Setting:
Outpatient Programs Dominate Amid Community-Care PivotOutpatient services accounted for 36.68% behavioral rehabilitation market share in 2025 as payers favor lower-intensity, community-anchored care. CMS has designated new facility-specialty provider types for outpatient behavioral health beginning 2025, enabling direct billing by licensed counselors and marriage-and-family therapists. These shifts bolster financial sustainability for clinics and accelerate geographic spread into underserved zones.
Inpatient centers still attract significant percentage of revenue, primarily managing acute crises and dual-diagnosis complexity. Updated SAMHSA crisis-care guidelines stress a coordinated system comprising 988 call centers, mobile crisis teams, and stabilization units. Residential programs face heightened scrutiny over youth outcomes and cost-effectiveness, prompting operators to standardize evidence-based protocols and publish routine performance dashboards.
By Treatment Method:
Counselling Leads, CBT Innovations Drive GrowthCounselling services delivered 47.55% of 2025 revenues, underpinning integrated care plans that blend psychotherapy, pharmacotherapy, and peer support. Acceptance of counseling has grown as public campaigns normalize help-seeking, and insurers waive copays for initial visits. Increasing deployment of measurement-based care—such as PHQ-9 tracking—sharpens personalization and enhances remission rates.
Cognitive Behavioral Therapy is slated for an 8.69% CAGR through 2031, propelled by next-generation CBT platforms that combine therapist video sessions with synchronous digital homework. Mindfulness-based CBT is inducing measurable neuroplastic changes in emotion-regulation circuits, delivering durable relapse prevention for recurrent depression. Task-shifting models that train lay health workers to administer protocolized CBT have demonstrated clinical equivalence in resource-constrained settings, broadening global reach.
By Delivery Mode:
Virtual Care Reshapes Access ParadigmsIn-Person Facility-based encounters retained a dominant 71.46% revenue share in 2025, yet the operational model is tilting toward hybrid delivery. Many hospitals now embed tele-psychiatry pods within emergency departments to expedite consults and reduce boarding times. Integrated electronic health records streamline data flow between virtual and on-site teams, elevating continuity of care.
Virtual/tele-rehabilitation is the fastest-expanding slot at a 12.04% CAGR, catalyzed by permanent Medicare flexibilities and smartphone penetration. CMS has confirmed payment parity for audio-only behavioral visits, enhancing reach among patients lacking broadband. AI-driven sentiment analysis during video sessions flags suicidality risks in real time, enabling proactive intervention. The Internet of Medical Things is projected to climb to USD 588.9 billion by 2030, embedding passive sensors that feed adherence data straight to clinicians, thus reinforcing outcome-based reimbursement models.
By Age Group:
Adults Remain Core, Geriatric Demand Climbs FastestAdults aged 18-64 accounted for 62.54% revenue in 2025, reflecting high prevalence across working populations and employer-sponsored insurance coverage. Corporations have added mental-health modules to wellness programs, with utilization boosting productivity and lowering absenteeism. Tele-coaching services outperform traditional employee-assistance programs by offering 24/7 availability and culturally matched coaches.
Geriatric demand is set to advance at 7.08% CAGR, catalyzed by population aging and specialized interventions for dementia and depression. About 15% of older adults contend with mental-health disorders, yet mobility constraints impede clinic visits. Tele-psychiatry bridges access gaps, and geriatric-friendly CBT modules integrate memory aids and sensory-accommodation features. Academic centers such as McLean Hospital have rolled out continuing-education consortia to upskill providers in late-life psychiatry best practices.
Geography Analysis
North America Behavioral Rehabilitation Market
North America topped the behavioral rehabilitation market with a 41.72% share in 2025 on the strength of comprehensive insurance coverage and mature provider networks. Implementation of parity regulations and USD 602 million federal funding for the 988 crisis-line in 2025 reinforce service access. Consolidation is brisk as private equity funds buy multi-state platforms, standardize electronic medical records, and elevate outcome reporting. Rising unionization among clinical staff, however, is lifting wage costs and nudging operators toward tele-supervision efficiencies.
APAC Behavioral Rehabilitation Market
Asia-Pacific is the fastest-growing region, registering a 6.88% CAGR between 2026 and 2031. Government campaigns in Japan, China, and India are destigmatizing mental-health consultations and embedding coverage into national insurance schemes. Task-shifting programs that certify bachelor-level counselors are rapidly scaling capacity. The region’s med-tech sector is investing in language-agnostic chatbots to surmount clinician shortages and extend behavioral rehab services into rural districts.
Europe Behavioral Rehabilitation Market
Europe maintained 27.00% revenue in 2025, supported by universal health coverage and robust social-protection mechanisms. Countries such as the United Kingdom and Germany have introduced digital-therapeutics formularies that allow physicians to prescribe app-based cognitive behavioral programs reimbursed under statutory funds. Workforce demographics, however, signal impending retirements; several EU nations now offer expedited licensure pathways for migrants with psychiatric credentials.
MEA Behavioral Rehabilitation Market
The Middle East & Africa, while smaller in base, is experiencing consistent growth as governments integrate mental-health targets into national vision plans. Telehealth platforms circumvent clinician scarcity and cultural stigma, particularly in Gulf Cooperation Council member states. International NGOs are partnering with local ministries to build community-based rehab centers and train peer support workers, fueling nascent demand for evidence-based interventions.

Regulatory Landscape
In the United States, parity enforcement and Medicare coverage rules remain key levers for how behavioral rehabilitation services are reimbursed and delivered. Amendments to the Mental Health Parity and Addiction Equity Act (MHPAEA) were finalized in September 2024 by federal agencies (HHS, DOL, and Treasury), and the new nonquantitative treatment limitation (NQTL) comparative-analysis requirements moved into mandatory compliance beginning January 2026. This increases scrutiny of network adequacy and utilization management practices for behavioral health.
Payment and delivery rules around virtual care, documentation, and quality continue to tighten. CMS updated behavioral health coverage guidance for Medicare in March 2026 (MLN1986542), addressing covered mental health services, telehealth, and Digital Mental Health Treatment (DMHT) devices. CMS telehealth supervision policy updates for 2026 clarified that real-time audio-video telecommunications can satisfy certain direct supervision requirements (excluding audio-only). Globally, quality frameworks are still anchored by accreditation and standards bodies such as The Joint Commission and CARF, and by UNODC/WHO international standards for treatment of drug use disorders that emphasize national quality and accreditation mechanisms.
Competitive Landscape
The competitive arena is moderately concentrated. Universal Health Services reported a 10.71% revenue uptick in its behavioral segment during 2024 and invested USD 286 million in facility upgrades to expand bed capacity. Acadia Healthcare accelerated de-novo clinic openings in secondary U.S. metros, coupling CBT programs with measurement-based care dashboards. Magellan Health emphasizes integrated care, leveraging its managed-behavioral-health carve-out contracts to channel referrals into proprietary outpatient centers.
Technology-enabled entrants such as Teladoc Health and Lyra Health differentiate through AI triage, asynchronous messaging, and outcomes-linked employer contracts. Their asset-light models scale faster than brick-and-mortar hospitals and lower marginal costs per session. Traditional chains respond by adding digital front doors, launching hybrid intensive-outpatient programs, and partnering with virtual-care start-ups to retain share in the behavioral rehabilitation market.
Mergers and acquisitions revolve around geographic expansion and vertical integration. Hospital groups purchase crisis-stabilization units to secure referral pipelines, while specialty clinics acquire lab services to internalize drug-testing revenue. Growing scrutiny from state attorneys general on quality metrics and billing practices is prompting operators to publish patient-reported outcome measures and invest in workforce well-being programs, thereby sustaining competitiveness.
Behavioral Rehabilitation Industry Leaders
Aurora Behavioral Health System
Promises Behavioral Health
American Addiction Centers Holdings Inc.
Acadia Healthcare Co. Inc.
Behavioral Health Group LLC
- *Disclaimer: Major Players sorted in no particular order

Behavioral Rehabilitation Market Companies Covered in this Report
- Acadia Healthcare Co. Inc.
- Universal Health Services
- Magellan Health
- Springstone
- American Addiction Centers Holdings Inc.
- Aurora Behavioral Health System
- Behavioral Health Group LLC
- Haven Behavioral Healthcare
- Promises Behavioral Health
- Niznik Behavioral Health
- Teladoc Health
- Lyra Health
- Ginger
- Brightline Inc.
- Talkspace Inc.
- MindPath Health
- Cigna Behavioral Health

Market Opportunities and Future Outlook
Workflow automation and enterprise standardization across multi-site behavioral health networks are creating a practical operating-model opportunity, especially for organizations facing administrative overhead and workforce constraints. In March 2026, Pyramid Healthcare expanded its collaboration with Netsmart to implement the myAvatar EHR and the Bells AI-powered clinical documentation coach across its multistate organization, pointing to provider demand for unified clinical and revenue-cycle infrastructure that can support measurement-based care, compliance, and scalable outpatient operations.
Beyond facility expansion, new care modalities are broadening the solutions vendors can offer. In April 2026, a White House directive called for HHS to allocate at least USD 50 million via ARPA-H to support state-led programs researching psychedelic drugs for serious mental illness, indicating continued policy-backed experimentation that can feed into new care pathways and adjunct services where permitted. Providers and enabling vendors are also pushing for faster-to-deploy capacity and community-based options, illustrated by Mentis Health Solutions launching a community-based turnkey model in July 2026 that combines staffing with rapidly deployed residences, and by platform moves such as Alleva introducing Alleva Intelligence in July 2026 to strengthen analytics and operational visibility for behavioral health organizations.
Recent Industry Developments in Behavioral Rehabilitation Market
- February 2026: American Addiction Centers launched AAC Together, an alumni-focused mobile application aimed at strengthening post-discharge engagement and recovery support. The app extends the care continuum beyond facility-based treatment and gives providers a structured channel to reduce relapse risk while sustaining long-term patient relationships.
- August 2025: Recovery.com acquired American Addiction Centers' Recovery Brands care navigation platform and associated sites in an eight-figure deal. The divestiture sharpened American Addiction Centers' focus on core clinical delivery while moving a well-known digital navigation asset to a specialized care-matching operator with incentives to broaden top-of-funnel access.
- January 2024: Acadia Healthcare entered a joint venture partnership with Ascension Seton to expand behavioral health services in Austin, Texas, including plans tied to a 106-bed acute behavioral hospital expansion. This structure leverages a health-system footprint to scale inpatient capacity and strengthen local referral pathways feeding outpatient and specialty treatment programs.


Behavioral Rehabilitation Market Report Scope and Research Methodology
Market Definition and Coverage
This market covers paid services and programs that help people recover, manage, or improve behavioral and mental health conditions through structured care delivered across inpatient, residential, and outpatient settings.
Scope exclusions: It excludes informal self-help support with no billed service, general wellness coaching not tied to clinical rehabilitation, and non-behavioral physical rehabilitation services.
Segments Covered in This Report
- By Type of Behavioral Disorder
- Anxiety Disorder
- Mood Disorder
- Substance Abuse Disorder
- Personality Disorder
- Attention Deficit Disorder
- Autism Spectrum Disorder
- By Healthcare Setting
- Outpatient Programs
- Inpatient Programs
- Residential Programs
- By Treatment Method
- Counselling
- Medication
- Support Services
- Other Treatment Methods
- By Delivery Mode
- In-Person Facility-based
- Virtual / Tele-rehabilitation
- Hybrid
- By Age Group
- Children & Adolescents (≤17 yrs)
- Adults (18–64 yrs)
- Geriatric (≥65 yrs)
- Geography
- North America
- United States
- Canada
- Mexico
- Europe
- Germany
- United Kingdom
- France
- Italy
- Spain
- Rest of Europe
- Asia-Pacific
- China
- Japan
- India
- Australia
- South Korea
- Rest of Asia-Pacific
- Middle East & Africa
- GCC
- South Africa
- Rest of Middle East & Africa
- South America
- Brazil
- Argentina
- Rest of South America
- North America
Data Sources, Market Sizing, and Validation
Desk Research
Desk research started by mapping how behavioral rehabilitation services are delivered and reimbursed in major countries, then linking those patterns to observable demand and capacity signals. We used public sources such as the World Health Organization, OECD health statistics, the US CDC, and the US SAMHSA datasets to understand condition prevalence, treatment participation, and care access trends.
To ground the economics, we also reviewed government health expenditure releases, national health ministry updates, peer-reviewed clinical and health economics journals, and selected provider annual reports and investor presentations. In parallel, paid subscriptions for company financials and intelligence, and for patent databases, were used to cross-check revenue exposure and therapy technology direction. The sources named here are illustrative, and we also used other public documents and datasets for data collection, validation, and research clarification.
Primary Interviews and Surveys
Fieldwork focused on validating what drives volumes and pricing in live care delivery, including referral flow, payer mix, and the share of services moving to outpatient care and tele-rehabilitation. We spoke with leaders from provider organizations, clinical networks, payers, and service enablers across APAC, EMEA, and the Americas, and their input helped us close gaps left by public datasets and test assumptions before finalizing results.
Distribution of primary research fieldwork respondents
| Company type | Respondent position | Region |
|---|---|---|
| Top tier: 36% | CXOs: 14% | APAC: 43% |
| Mid tier: 49% | Functional/Unit leaders: 31% | EMEA: 34% |
| Smaller Players: 15% | Managers: 55% | Americas: 23% |
Market-Sizing & Forecasting
Sizing used a top-down approach where prevalence, diagnosis rates, and treated patient pools were built by country and then converted into service demand using setting mix and utilization assumptions. Once that demand pool was established, average spend per treated patient was applied, with adjustments for outpatient share, length of program, and the portion delivered through tele-rehabilitation.
To keep the totals realistic, we corroborated outcomes with selective bottom-up approximations, such as roll-ups of sampled provider revenues, capacity checks for beds and outpatient programs, and channel checks on typical price points. Key inputs that shaped the model included mental health and substance use prevalence trends, treatment penetration and referral patterns, outpatient versus inpatient split, telehealth adoption, and policy or reimbursement changes that affect access and billing.
For forecasting, we ran scenario analysis and then guided annual growth by how those variables are expected to move in each region, using interview feedback to confirm direction. Where bottom-up samples were thin in a country, we used proxy ratios from similar healthcare systems and then revisited the result with regional experts before locking the final number.
Data Validation & Update Cycle
Outputs were checked against independent signals, including health spending trends, provider expansion activity, and shifts in outpatient utilization and tele-rehabilitation usage, and then variances were investigated before sign-off. When a number looked off, we re-ran the model with refreshed assumptions, and triggered targeted follow-ups with respondents to confirm what had changed.
A multi-step internal review is followed, where logic, inputs, and currency treatment are rechecked so the final series is consistent across countries and years. The report is refreshed annually, and interim updates are made when material events occur, such as major policy changes or step-changes in care delivery patterns. Before delivery, one last analyst pass is completed to ensure clients receive the latest updated view.
Mordor Intelligence's Behavioral Rehabilitation Market Size Compared With Other Published Estimates
Published market sizes can differ even when they describe the same service area, because the boundaries of what counts as rehabilitation are not always aligned. Differences also show up when studies use different base years, convert currencies at different points in time, or apply different assumptions for outpatient growth and tele-rehabilitation adoption.
By tracking treated-patient demand by care setting and refreshing the outpatient and tele-rehabilitation mix assumptions each cycle, Mordor Intelligence keeps the total tied to observable utilization instead of broader mental health spend that can include adjacent services.
Benchmark comparison
| Source | Market Size | Gaps in Research Methodology |
|---|---|---|
| Mordor Intelligence | USD 621.93 B (2026) | |
| Global Consultancy A | USD 582.00 B (2024) | Uses a different base year and may bundle a wider set of mental health services, which can pull in spend not directly tied to structured rehabilitation programs. Currency timing and inflation handling can also shift the reported USD total versus a setting-led utilization build. |
| Trade Journal B | USD 548.70 B (2023) | Leans on a narrower definition of behavioral rehabilitation services and can apply more conservative treatment penetration, which can understate outpatient volumes in higher-access systems. Limited clarity on how residential and tele-rehabilitation revenues are counted can also compress the total. |
In practice, the spread mainly comes from scope boundaries, base year choice, and how setting mix is translated into annual spend. When inputs are anchored to treated cohorts, utilization, and realistic program economics, the resulting market size stays easier to trace and to update as conditions change.


Key Questions Answered in the Report
What is the projected size of the behavioral rehabilitation market by 2031?
The behavioral rehabilitation market size is forecast to reach USD 848.47 billion by 2031, growing at a 6.44% CAGR.
Which segment is expanding fastest within the behavioral rehabilitation market?
The virtual/tele-rehabilitation segment is advancing at the highest 12.04% CAGR due to permanent telehealth reimbursement and technology adoption.
Why do outpatient programs dominate the behavioral rehabilitation market?
Outpatient programs hold 36.68% revenue because community-based models are cost-effective, reduce stigma, and align with value-based payment incentives.
How are new parity rules expected to influence market growth?
MHPAEA final rules effective 2025 mandate equal coverage for behavioral and medical services, broadening insured access and stimulating provider demand.
What is driving Asia-Pacific’s rapid behavioral rehabilitation market growth?
Growing mental-health awareness, government insurance inclusion, and telehealth innovations are propelling a 6.88% CAGR across Asia-Pacific.
Page last updated on:





