Beam Expander Market Size and Share
Market Overview
| Study Period | 2019 - 2030 |
|---|---|
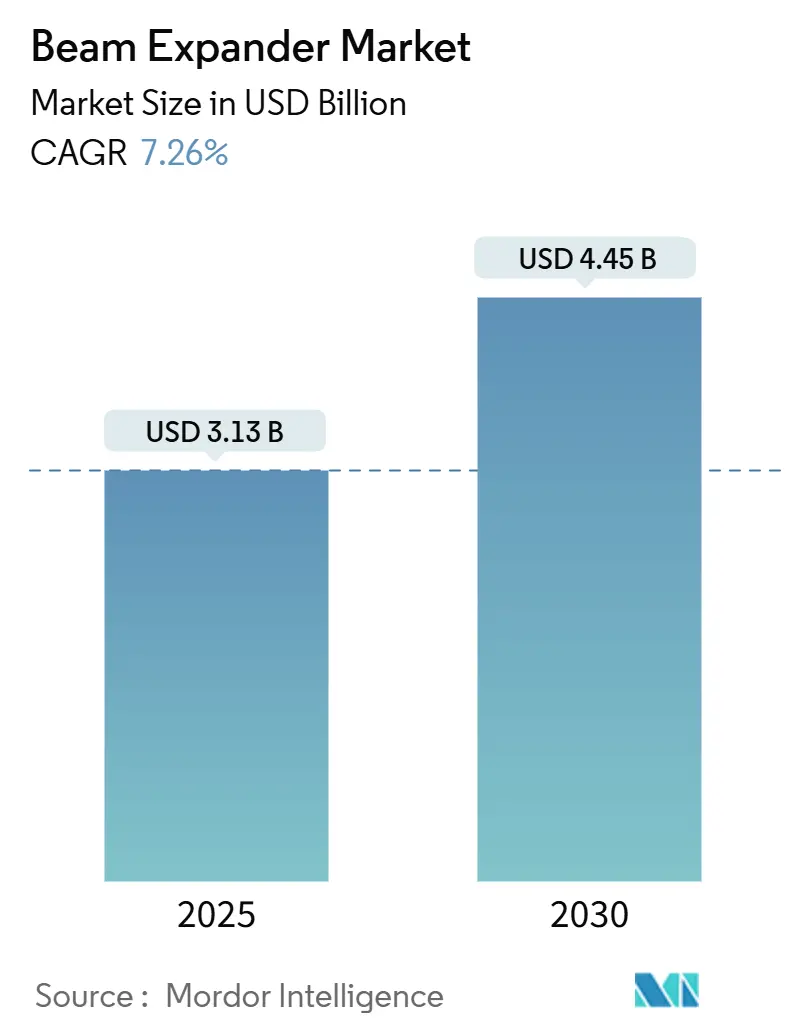
| Market Size (2025) | USD 3.13 Billion |
| Market Size (2030) | USD 4.45 Billion |
| Growth Rate (2025 - 2030) | 7.26% CAGR |
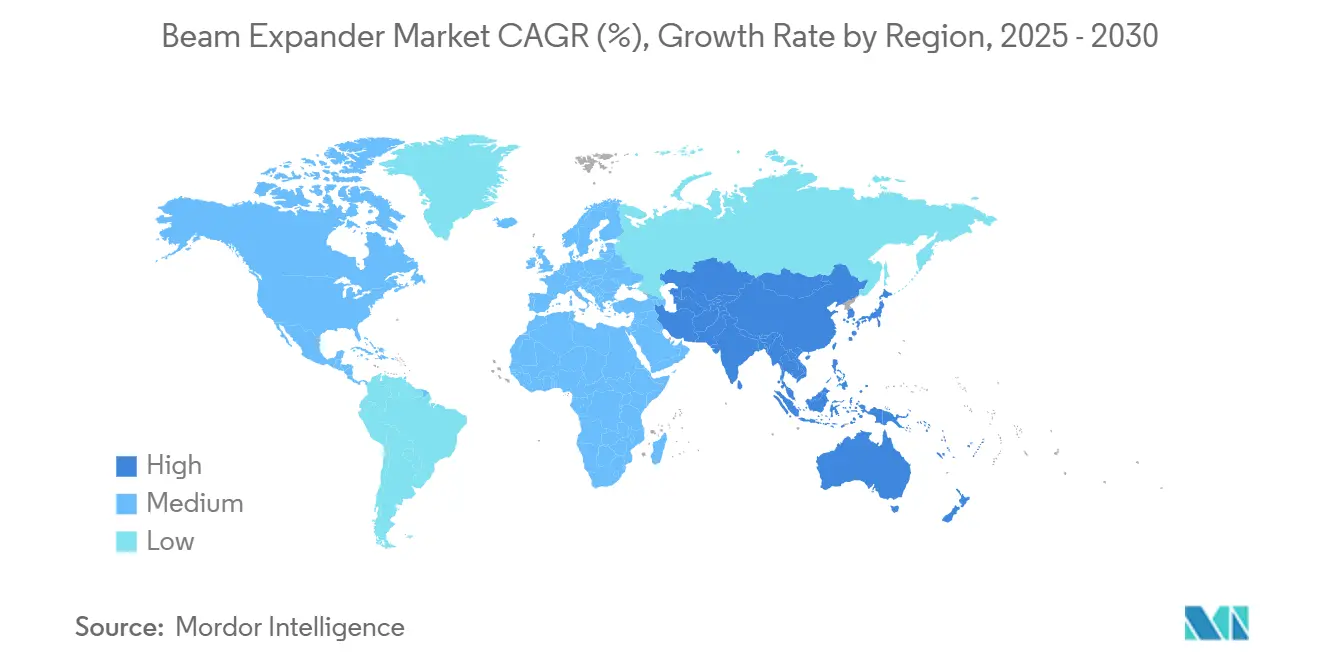
| Fastest Growing Market | Asia Pacific |
| Largest Market | North America |
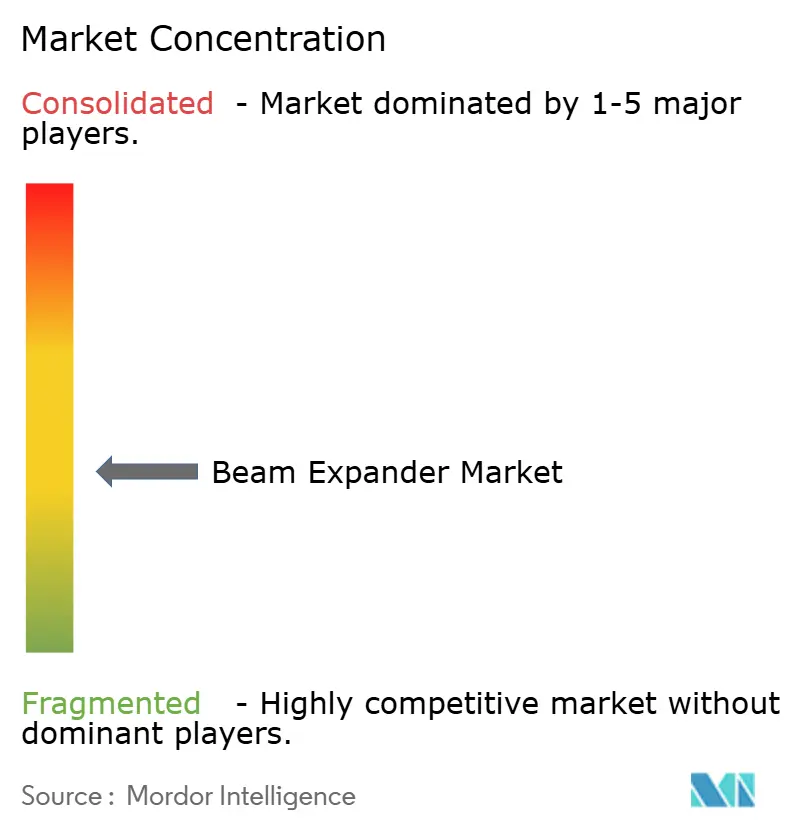
| Market Concentration | Medium |
Major Players *Disclaimer: Major Players sorted in no particular order Image © Mordor Intelligence. Reuse requires attribution under CC BY 4.0. | |
Beam Expander Market Analysis by Mordor Intelligence
The beam expander market size was USD 3.13 billion in 2025 and is projected to reach USD 4.45 billion by 2030, growing at a 7.26% CAGR. Steady growth rests on four structural pillars: the continuous expansion of fiber-optic infrastructure, wider adoption of industrial lasers across precision manufacturing, faster uptake of medical and life-science lasers, and increasing defense spending on optical weapon systems. Suppliers are also benefiting from sustained R&D in quantum and space photonics, where designers demand thermally stable, chromatically robust expansion optics. Competitive intensity is rising as general-purpose optics vendors integrate adaptive beam control functions, while niche specialists target unmet needs in harsh-environment and high-power segments.
Key Report Takeaways
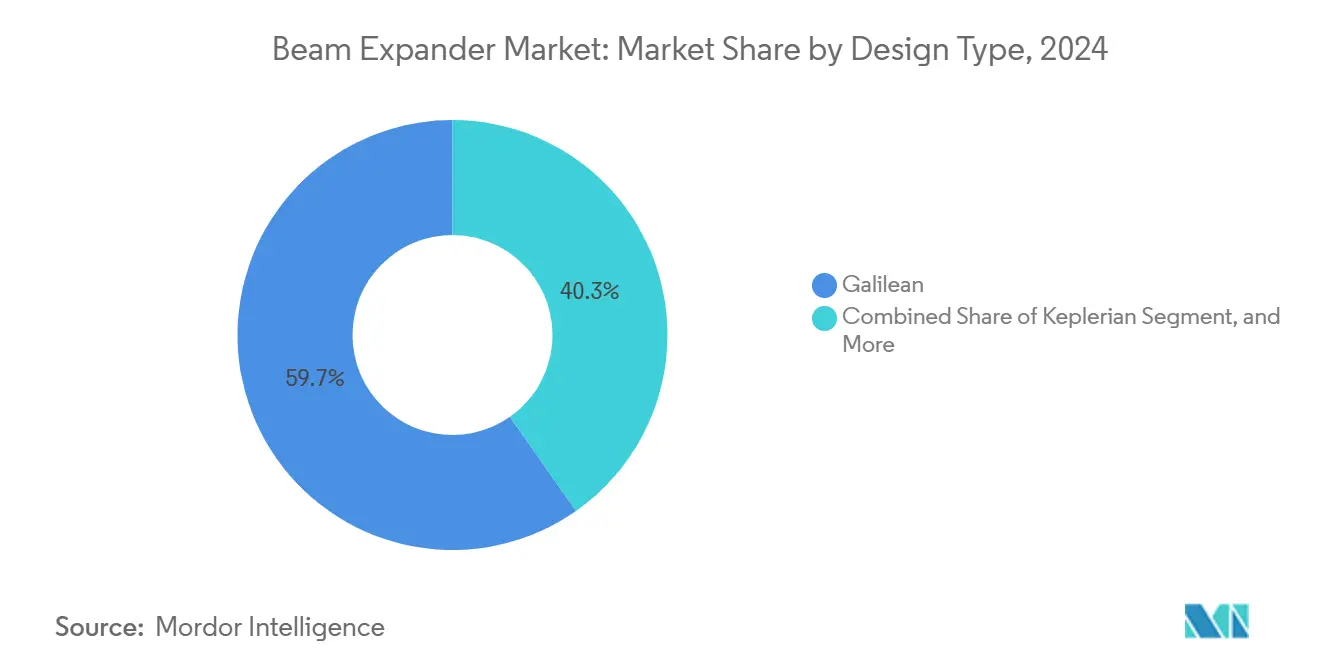
- By design type, Galilean systems led with 59.74% revenue share in 2024, while reflective designs posted the fastest 7.89% CAGR through 2030.
- By magnification range, 1X-5X commanded 48.67% of the beam expander market share in 2024; systems with magnification above 10X are projected to achieve a 7.67% CAGR through 2030.
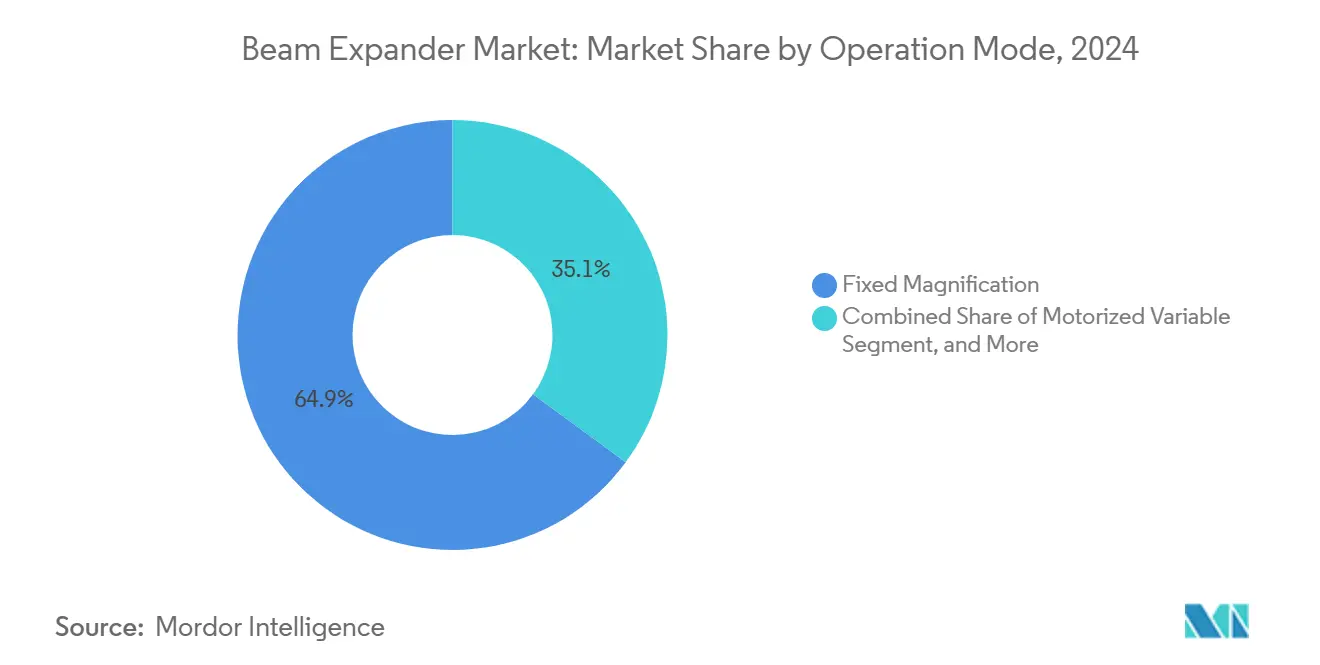
- By operation mode, fixed configurations held 64.92% of the beam expander market size in 2024, whereas motorized variable units are expected to grow at a 7.78% CAGR through 2030.
- By application, industrial manufacturing accounted for a 37.79% revenue share in 2024, and telecommunications is expected to expand at an 8.12% CAGR to 2030.
- By geography, North America captured a 41.67% share in 2024, and the Asia-Pacific region is advancing at a 7.91% CAGR through 2030.
Note: Market size and forecast figures in this report are generated using Mordor Intelligence’s proprietary estimation framework, updated with the latest available data and insights as of January 2026.
Global Beam Expander Market Trends and Insights
Drivers Impact Analysis*
| Driver | (~) % Impact on CAGR Forecast | Geographic Relevance | Impact Timeline |
|---|---|---|---|
| Rapid Expansion of Fiber-Optic Telecommunication Networks | +1.8% | Global, with Asia-Pacific leading deployment | Medium term (2-4 years) |
| Surge in High-Precision Industrial Laser Processing | +1.5% | North America and Europe core, expanding to Asia-Pacific | Short term (≤ 2 years) |
| Rising Demand for Compact Medical and Life-Science Lasers | +1.2% | Global, with North America and Europe leading adoption | Medium term (2-4 years) |
| Military Adoption of Ruggedized Optical Systems | +1.0% | North America, Europe, select Asia-Pacific markets | Long term (≥ 4 years) |
| Growth of Quantum and Space Photonics Programs | +0.9% | North America, Europe, China, Japan | Long term (≥ 4 years) |
| Shift Toward Adaptive and Smart Beam Control Modules | +0.8% | Global, with technology centers leading | Medium term (2-4 years) |
| Source: Mordor Intelligence | |||
Rapid Expansion of Fiber-Optic Telecommunication Networks
Global operators are racing to densify 5G and data-center interconnect footprints, scaling coherent optical links that require ultra-low loss beam shaping. Beam expanders increase coupling efficiency, cut insertion loss, and stabilize mode fields over kilometers of fiber runs.[1]European Commission, “Gigabit Society Targets,” digital-strategy.ec.europa.eu China’s pledge to exceed 3 million 5G base stations by 2025, along with the European Union’s Gigabit Society vision, is creating sustained demand for precision expansion optics. Coherent modulation formats above 400 Gbit/s heighten tolerances, prompting procurement of high-NA adjustable expanders capable of sub-micron repeatability. Vendors integrating AI-assisted beam alignment now win a greater share of upgrade projects, especially in Asia-Pacific metro networks.
Surge in High-Precision Industrial Laser Processing
Manufacturers employ ultrafast lasers for battery tab welding, heterogenous material cutting, and additive manufacturing, all of which need uniform energy distribution across widened apertures.[2]Elsevier, “Advances in Ultrafast Laser Processing,” Journal of Manufacturing Processes, sciencedirect.com Beam expanders eliminate hot spots, protect downstream optics, and enlarge processing fields without sacrificing M² value, thereby raising cap-ex return on high-power laser lines. Automotive electrification programs in the United States and Europe stimulated double-digit growth in 10 kW laser installations during 2024, directly lifting demand for ruggedized, water-cooled expansion modules. Semiconductor fabs moving toward 2 nm processes employ more than 20X magnification optics to achieve sub-10 nm linewidths. As Industry 4.0 platforms close the loop between machine learning algorithms and process optics, motorized expanders that self-adjust for sheet thickness variations gain traction.
Rising Demand for Compact Medical and Life-Science Lasers
Minimally invasive therapeutic procedures, such as ophthalmic refractive surgery and dermatological resurfacing, require finely tuned beam profiles to minimize collateral tissue damage.[3]Nature Publishing Group, “Compact Medical Lasers,” Nature Biomedical Engineering, nature.com Portable phototherapy devices for home and point-of-care use now integrate miniaturized Galilean expanders that weigh under 50 grams yet support 1 J/cm² fluence delivery. Flow cytometers, fluorescence microscopes, and confocal endoscopes rely on diffraction-limited expansion optics to ensure uniform cell excitation, boosting adoption within clinical laboratories. Photodynamic therapy is expanding beyond oncology into antimicrobial regimes, extending the use cases for compact, high-transmission expanders. Rising reimbursement rates for laser-based interventions in the United States and Japan are expected to further enhance equipment renewal cycles through 2030.
Military Adoption of Ruggedized Optical Systems
Defense agencies finance high-energy laser demonstrators that require thermally stable reflective expanders able to withstand megawatt-class fluence. The U.S. Department of Defense allocated USD 1.1 billion to directed-energy research for fiscal 2025, channeling sizeable orders toward low-scatter, low-stress mirror assemblies. Target designation pods, range finders, and counter-UAV systems employ sealed, shock-hardened expanders that preserve boresight alignment under 20 g accelerations. NATO standardization on optical interfaces is fostering multilateral procurement, simplifying qualification pathways for vendors offering laser damage thresholds exceeding 50 J/cm². Space-qualified variants, coated for atomic oxygen resistance, support emerging military satellite laser communication networks in geostationary and low-Earth orbits.
Restraints Impact Analysis*
| Restraint | (~) % Impact on CAGR Forecast | Geographic Relevance | Impact Timeline |
|---|---|---|---|
| High Cost of Precision Optical Coatings | -0.8% | Global, with higher impact in price-sensitive markets | Short term (≤ 2 years) |
| Supply-Chain Bottlenecks for Specialty Glass | -0.6% | Global, with Asia-Pacific manufacturing concentration | Medium term (2-4 years) |
| Laser Safety Regulatory Compliance Burden | -0.5% | Global, with stricter enforcement in North America and Europe | Medium term (2-4 years) |
| Competition from Alternative Beam-Shaping Technologies | -0.4% | Global, with technology centers leading adoption | Long term (≥ 4 years) |
| Source: Mordor Intelligence | |||
High Cost of Precision Optical Coatings
Multi-layer ion-beam sputtered coatings based on hafnium and tantalum oxides push unit costs above USD 1,500 per lens pair, curbing uptake in budget-constrained applications. Limited clean-room capacity at qualified coaters elongates lead times beyond 14 weeks, compelling OEMs to carry larger inventories. Semiconductor lithography demand for extreme-ultraviolet optics monopolizes high-grade coating slots, driving up commercial prices by 18% in 2024. Quality-assurance regimes involving 10-million-shot laser damage testing add further expense. While volume scaling could temper costs by 2027, current price sensitivity chills adoption in entry-level industrial laser systems.
Supply-Chain Bottlenecks for Specialty Glass
Only a handful of global furnaces produce low-dispersion N-BK7 and fused silica blanks needed for high-precision expanders. Geopolitical frictions disrupted deliveries from Eastern Europe in late 2024, forcing optics shops to qualify alternative blends with marginally higher stripe counts. Environmental regulations are driving furnace upgrades, which are limiting effective capacity and increasing melt costs by 12% year-over-year. Defense and aerospace programs receive priority allocations, which squeezes the supply for commercial laser OEMs and stretches lead times beyond six months. These bottlenecks compel some integrators to redesign systems around lower-grade glass, sacrificing performance to maintain production schedules.
*Our forecasts treat driver/restraint impacts as directional, not additive. The impact forecasts reflect baseline growth, mix effects, and variable interactions.
Segment Analysis
By Design Type: Galilean Dominance Persists as Reflective Designs Accelerate
Galilean units secured 59.74% of 2024 revenue, reflecting their cost-efficient architecture and ease of alignment, particularly in portable industrial lasers where footprint and weight are constrained. Refractive simplicity yields high throughput and lower maintenance, positioning them as the default choice in telecom test systems and laboratory benches. Keplerian designs cater to beam diagnostics by offering an intermediate focus for spatial filtering, supporting semiconductor mask repair and high-resolution spectroscopy. Multi-prism and other niche variants address wavelength-specific or ultra-broadband tasks in research institutions.
Reflective expanders, unaffected by chromatic dispersion, are posting a 7.89% CAGR as the beam expander market embraces kilowatt-class fiber and disk lasers for e-mobility welding lines. Thermal neutrality, coupled with damage thresholds above 30 J/cm², makes mirror-based expanders a preferred solution in EUV photolithography and emerging quantum-photonics platforms. Aerospace prime contractors are adopting lightweight SiC mirrors with nanometer surface quality for space laser links, affirming long-term momentum.


By Magnification Range: Moderate Ratios Lead While Ultra-High Ratios Gain Ground
The 1X-5X band, representing a 48.67% share in 2024, covers most industrial cutting, marking, and FTTx coupling lines where moderate divergence control is sufficient. These units strike a balance between affordability and beam quality, facilitating widespread adoption across contract manufacturing facilities in Germany, Japan, and the United States. Intermediate 5X-10X optics serve micro-machining, medical photo-coagulation, and scientific spectroscopy, leveraging enhanced spot homogeneity.
Systems exceeding 10X are advancing at a 7.67% CAGR, propelled by lithography steppers and astronomical interferometers that require expanded, flat-wavefront beams for sub-nanometer resolution. Semiconductor roadmaps targeting 1.8 nm nodes, alongside satellite-borne hyperspectral imagers, necessitate variable, high-ratio expanders with on-orbit calibration capability. Although unit volumes remain modest, premium pricing raises their revenue contribution within the overall beam expander market size.
By Operation Mode: Automation Spurs Motorized Variable Growth
Fixed magnification products captured 64.92% of 2024 sales, thanks to mechanical stability that meets the continuous-duty demands of automotive and electronics lines. Their sealed housings withstand oil mist, vibration, and 24-hour operation, driving large reorder volumes among contract manufacturers. Manually variable optics populate research facilities that value flexibility over cycle time, although their share is trending downward.
Motorized variable expanders are charting a 7.78% CAGR as factories digitalize inspection feedback loops. Embedded encoders and servos enable production software to adjust spot diameter in milliseconds, allowing single-station lines to process multiple alloys or polymer substrates. Semiconductor fabs deploy closed-loop algorithms that adjust the beam diameter every wafer pass, thereby curbing across-die critical dimension drift. As predictive maintenance platforms mature, integrators specify smart expanders with self-diagnostics and on-board temperature sensors.
By Application: Telecommunications Emerges as Fastest-Growing End Use
Industrial manufacturing remained the largest user, accounting for a 37.79% share in 2024, with operations spanning laser cutting, drilling, surface texturing, and additive manufacturing lines across three continents. Equipment retrofits to handle novel battery chemistries continue to generate multi-year orders. Scientific research consumes a steady flow of high-stability expanders for spectroscopy, metrology, and atomic trapping experiments. Medical and life-science demand is reinforced by hospital spending on minimally invasive tools and in-lab analytic platforms. Defense and aerospace procurement cycles support the development of ruggedized variants, albeit with longer qualification timelines.
Telecommunications, however, is the fastest-growing domain with an 8.12% CAGR, driven by 400G and 800G coherent optics for hyperscale data centers and metro backbones. Beam shaping reduces modal dispersion and lowers bit-error rates, which are crucial for meeting carrier-class availability targets. Satellite constellations deploying free-space optical crosslinks procure compact, radiation-tolerant expanders that maintain wavefront integrity across temperature swings from -40 °C to 60 °C.
Geography Analysis
The Asia-Pacific region generated USD 1.30 billion of the beam expander market size in 2025, representing 41% of the global revenue and expanding at a forecasted 7.91% CAGR through 2030. China’s dominance rests on strong photonics supply chains clustered in the Yangtze River Delta, where contract optics houses scale mirror-based designs for both telecom and manufacturing systems. National investments in quantum networks and space exploration foster domestic demand for adaptive expansion optics that withstand thermal shock and radiation. Japan, leveraging decades of precision metrology expertise, continues to absorb high-purity fused silica units for semiconductor steppers and medical endoscopy devices.
North America, valued at USD 1.25 billion in 2025, retains leadership in defense and aerospace, thanks to consistent Pentagon funding of high-energy laser prototypes and satellite laser communication payloads. Silicon Valley data centers deploy coherent optics featuring embedded beam expanders to reduce power consumption per bit, thereby maintaining robust regional demand. Canada’s photonics clusters in Ontario and British Columbia contribute niche adaptive optics for astronomy, further lifting regional sales.
Europe, worth USD 0.90 billion in 2025, is expected to maintain a solid performance, driven by Germany’s automotive laser welding lines and the Netherlands’ lithography supply chain. EU sustainability directives promoting renewable energy generation are driving the adoption of laser-based solar-cell texturing equipment, which incorporates variable expanders for multi-pattern processing. The region also benefits from Horizon Europe research funding that supports quantum photonics labs, thereby sustaining demand for high-precision expansion optics.

Competitive Landscape
The beam expander market exhibits moderate fragmentation, with the top five suppliers accounting for approximately 48% of the global revenue. Thorlabs, Edmund Optics, and Jenoptik anchor the high-volume catalog segment, leveraging global distribution to serve both OEMs and research labs. Excelitas Technologies and Sill Optics complement the leaders with specialized high-power and large-aperture solutions. Competitive differentiation now centers on smart capabilities: vendors integrate real-time wavefront sensing, motorized zoom, and predictive maintenance analytics into formerly passive optics.
Intellectual property activity accelerated in 2024, with more than 150 patent filings covering deformable mirror integration, ultra-hard dielectric coatings, and AI-driven alignment algorithms. Acquisitions also reshaped the field: Jenoptik purchased an adaptive optics specialist to strengthen its position in scientific instrumentation, while Edmund Optics secured aerospace contracts that demand space-rated variable expanders. New entrants from the quantum photonics sphere are developing metamaterial-based designs that promise ultra-thin form factors, potentially disrupting incumbents in refractive and reflective technologies.
Partnerships between optics manufacturers and laser-system integrators expand access to turnkey solutions, particularly in the Asia-Pacific region, where customers prefer single-supplier accountability. Supply-chain resilience has become a competitive parameter as firms invest in localized glass melting and coating capacity to mitigate geopolitical risks. Vendors who are transparent about their carbon footprints gain preference in EU tenders driven by sustainability mandates, adding another layer of differentiation.
Beam Expander Industry Leaders
Thorlabs Inc.
Edmund Optics Inc.
Jenoptik AG
Excelitas Technologies Corp.
Sill Optics GmbH & Co. KG
- *Disclaimer: Major Players sorted in no particular order

Recent Industry Developments
- May 2025: Thorlabs completed a USD 45 million advanced manufacturing facility in Germany, doubling its European production capacity for high-precision beam expanders.
- February 2025: Edmund Optics secured a USD 25 million contract to supply ruggedized beam expanders for next-generation satellite constellations.
- January 2025: Jenoptik AG acquired an adaptive optics company for USD 85 million, adding proprietary deformable-mirror technology to its smart beam-control portfolio.
- December 2024: Excelitas Technologies launched a motorized expander series offering sub-micron positioning accuracy aimed at semiconductor lithography tools.


Global Beam Expander Market Report Scope
| Galilean |
| Keplerian |
| Reflective |
| Multi-Prism and Other Design Type |
| 1X-5X |
| 5X-10X |
| greater than 10X |
| Fixed Magnification |
| Variable Manual |
| Motorized Variable |
| Industrial Manufacturing |
| Scientific and Research |
| Medical and Life Sciences |
| Defense and Aerospace |
| Telecommunications |
| North America | United States | |
| Canada | ||
| Mexico | ||
| Europe | Germany | |
| United Kingdom | ||
| France | ||
| Russia | ||
| Rest of Europe | ||
| Asia-Pacific | China | |
| Japan | ||
| India | ||
| South Korea | ||
| Australia | ||
| Rest of Asia-Pacific | ||
| Middle East and Africa | Middle East | Saudi Arabia |
| United Arab Emirates | ||
| Rest of Middle East | ||
| Africa | South Africa | |
| Egypt | ||
| Rest of Africa | ||
| South America | Brazil | |
| Argentina | ||
| Rest of South America | ||
| By Design Type | Galilean | ||
| Keplerian | |||
| Reflective | |||
| Multi-Prism and Other Design Type | |||
| By Magnification Range | 1X-5X | ||
| 5X-10X | |||
| greater than 10X | |||
| By Operation Mode | Fixed Magnification | ||
| Variable Manual | |||
| Motorized Variable | |||
| By Application | Industrial Manufacturing | ||
| Scientific and Research | |||
| Medical and Life Sciences | |||
| Defense and Aerospace | |||
| Telecommunications | |||
| By Geography | North America | United States | |
| Canada | |||
| Mexico | |||
| Europe | Germany | ||
| United Kingdom | |||
| France | |||
| Russia | |||
| Rest of Europe | |||
| Asia-Pacific | China | ||
| Japan | |||
| India | |||
| South Korea | |||
| Australia | |||
| Rest of Asia-Pacific | |||
| Middle East and Africa | Middle East | Saudi Arabia | |
| United Arab Emirates | |||
| Rest of Middle East | |||
| Africa | South Africa | ||
| Egypt | |||
| Rest of Africa | |||
| South America | Brazil | ||
| Argentina | |||
| Rest of South America | |||


Key Questions Answered in the Report
How fast is the beam expander market expected to grow to 2030?
The beam expander market is forecast to expand at a 7.26% CAGR, rising from USD 3.13 billion in 2025 to USD 4.45 billion by 2030.
Which design type currently holds the largest revenue share?
Galilean beam expanders led with 59.74% of 2024 revenue because of their compact, cost-effective design.
Why are reflective beam expanders gaining popularity?
Reflective designs withstand higher power densities and eliminate chromatic dispersion, supporting kilowatt-class industrial lasers and EUV lithography.
What is driving the rapid growth in telecommunications applications?
Massive 5G roll-outs and data-center interconnect upgrades require precision beam shaping to enhance coupling efficiency and minimize signal loss.
Which region is expected to grow the fastest through 2030?
Asia-Pacific will register the highest regional CAGR at 7.91%, propelled by Chinese quantum programs and widespread 5G deployments.
What are the main barriers to wider adoption?
High coating costs and limited specialty glass supply extend lead times and inflate prices, deterring uptake in price-sensitive segments.
Page last updated on:


