
Backbone Network Services Market Size and Share
Market Overview
| Study Period | 2020 - 2031 |
|---|---|
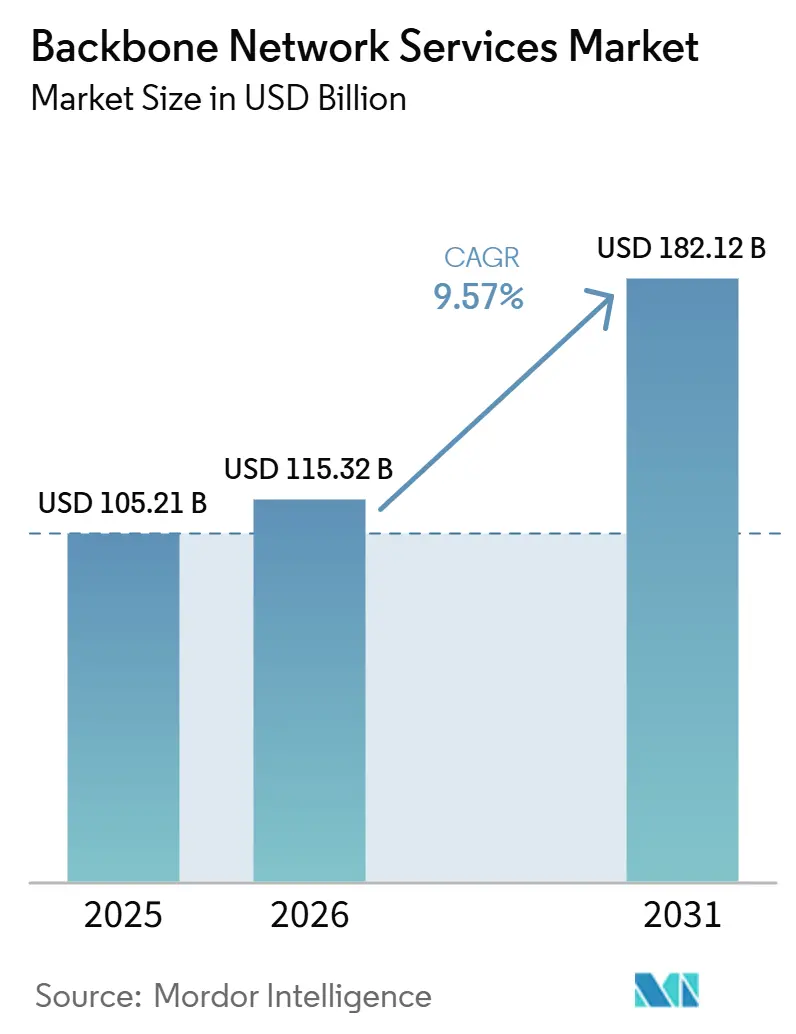
| Market Size (2026) | USD 115.32 Billion |
| Market Size (2031) | USD 182.12 Billion |
| Growth Rate (2026 - 2031) | 9.57 % |
| Fastest Growing Market | Asia-Pacific |
| Largest Market | North America |
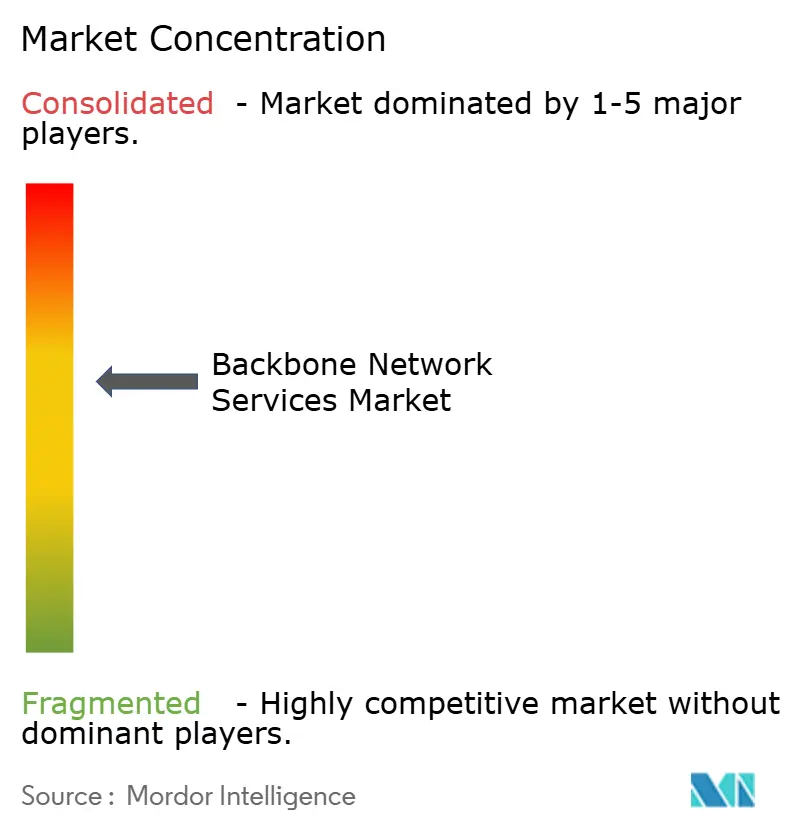
| Market Concentration | Medium |
Major Players *Disclaimer: Major Players sorted in no particular order Image © Mordor Intelligence. Reuse requires attribution under CC BY 4.0. | |
Backbone Network Services Market Analysis by Mordor Intelligence
The backbone network services market size stood at USD 105.21 billion in 2025 and is forecast to reach USD 182.12 billion by 2031 at a CAGR of 9.57% over 2026-2031. Growth is being supported by rising inter-data-center traffic, broader multi-cloud adoption, and stronger demand for private connectivity fabrics that offer tighter control over performance and service quality. The backbone network services market is also benefiting from a shift in spending toward managed wavelength, dedicated point-to-point, and VPN-based backbone services, where buyers value reliability and predictable service levels more than basic price competition. At the same time, commodity transit remains under pressure because self-provisioning by large cloud and content operators continues to reduce wholesale buying on core routes. Competitive behavior is changing as carriers invest in open routing, software-led network control, and deeper service bundling to defend enterprise and hyperscaler accounts. Expansion still faces limits from heavy upgrade costs, tight supply of high-speed optical and routing equipment, and more complex cross-border compliance rules that increase route planning and operating costs.
Key Report Takeaways
- By network type, wired backbone network services held 71.23% share of the backbone network services market in 2025, while wireless backbone network services are projected to expand at an 11.32% CAGR through 2031.
- By service type, internet backbone services accounted for 49.12% revenue share in 2025, while VPN backbone services are expected to grow at a 10.87% CAGR through 2031.
- By connectivity model, Carrier-to-Carrier Wholesale Connectivity accounted for 30.12% share of the backbone network services market in 2025, while Managed Wavelength Services is projected to expand at a 11.65% CAGR through 2031.
- By end use, telecommunications accounted for 29.88% of revenue share in 2025, while cloud service providers are projected to record the highest CAGR at 10.75% through 2031.
- By geography, North America accounted for 28.95% of revenue share of the backbone network services market in 2025, while Asia-Pacific is projected to record the highest CAGR at 11.33% through 2031.
Note: Market size and forecast figures in this report are generated using Mordor Intelligence’s proprietary estimation framework, updated with the latest available data and insights as of January 2026.
Market Trends and Insights
Drivers Impact Analysis of Backbone Network Services Market*
| DRIVER | (~) % IMPACT ON CAGR FORECAST | GEOGRAPHIC RELEVANCE | IMPACT TIMELINE |
|---|---|---|---|
| Rising Cross-Cloud and Data Center Interconnect Traffic | +2.8% | Global, concentrated in North America, Asia Pacific, and Europe data center corridors | Medium term (2-4 years) |
| 5G, IoT, and Low-Latency Backhaul Expansion | +2.2% | Asia Pacific, the Middle East and Africa, and North America, with spillover into South America and Eastern Europe | Short term (≤ 2 years) |
| SDN, NFV, and Automated Traffic Engineering Adoption | +1.5% | North America and Europe leaders, with rapid adoption in the Asia Pacific | Medium term (2-4 years) |
| Secure Inter-Regional Transport Demand, Including DDoS Resilience | +0.9% | Global, acute in Europe, North America, and Southeast Asia hubs | Short term (≤ 2 years) |
| Subsea Cable Buildouts and Route Diversity Requirements | +0.8% | Trans-Pacific, Asia-Africa-Europe corridors, and Red Sea bypass routes | Long term (≥ 4 years) |
| AI-Driven Network Optimization and Predictive Capacity Planning | +0.6% | Global, with early deployment leadership in North America and Europe | Medium term (2-4 years) |
| Source: Mordor Intelligence | |||
Rising Cross-Cloud and Data Center Interconnect Traffic
Cross-cloud traffic is replacing traditional enterprise WAN demand as the primary driver of new core capacity in the backbone network services market. Global internet bandwidth grew significantly in 2025, and a larger share of that traffic came from inter-data-center and cloud-to-cloud flows tied to distributed AI workloads and broader multi-cloud use. That shift is pushing operators to shorten refresh cycles for backbone design because older core layouts were built for different traffic patterns. In March 2026, China Mobile presented its GSE-DCI solution, featuring a router prototype with 115.2T switching capacity and 144 long-haul 800GE ports, demonstrating how quickly AI transport needs are moving into commercial backbone planning.[1] The practical result is that carriers with routes centered on data center clusters are better placed than operators still relying on older city-to-city hub patterns. That routing shift is giving the backbone network services market a clearer premium layer built around capacity density, low latency, and faster scaling.
5G, IoT, And Low-Latency Backhaul Expansion
The backbone network services market is also being lifted by the spread of 5G backhaul, machine connectivity, and services that require tighter latency control. Each new 5G small-cell cluster needs a dependable path to regional or national backbone nodes, which is forcing fiber deeper into areas that previously relied solely on microwave.[2] Nokia’s 2025 deployment for Vodafone Idea demonstrated how operators are modernizing transport networks to build a stronger IP/MPLS backbone to support denser 4G and 5G traffic. IoT traffic adds another layer, as industrial, agricultural, and smart-city use cases generate asymmetric flows that require stricter traffic handling than ordinary consumer traffic. That operating reality is pushing carriers to engineer service quality more carefully across backbone routes, especially when they target enterprise contracts with private 5G elements. In effect, the backbone network services market is gaining from mobile densification today and from enterprise transport bundling that carriers are positioning for next.
SDN, NFV, And Automated Traffic Engineering Adoption
Software-led routing is changing the cost structure and control across the backbone network services market. Microsoft Research showed in 2025 that its OnlineTE system could rebalance multi-layer network utilization within seconds after a demand change in a 750-node WAN environment.[3] That matters because faster traffic engineering improves route use and helps operators delay some capacity additions without lowering service quality. KDDI deployed this approach commercially in 2026, using cluster-based, distributed, disaggregated backbone routers built with DriveNets software and UfiSpace hardware.[4] The company said the model cut equipment deployment costs by 50% compared with conventional chassis-based routers, materially changing upgrade economics for carriers beyond the largest incumbents. As these tools spread, the backbone network services market is likely to reward operators that pair open hardware choices with automated path control rather than those that only add raw capacity. That also raises the bar for carriers that still depend on manual engineering and tightly bundled proprietary systems.
Secure Inter-Regional Transport Demand, Including DDoS Resilience
Security is becoming part of the core buying decision in the backbone network services market, not an added service purchased later. Cloudflare reported mitigating a 31.4Tbps DDoS attack in 2025, underscoring how large-scale attacks can now exceed the capacity of many overlay-only defenses. Megaport added built-in DDoS protection to its network fabric in May 2026, reflecting a move toward protection at the transport layer rather than relying on external scrubbing detours. GTT also expanded its DDoS scrubbing capacity to 4Tbps through 2025 and added new locations in São Paulo, Hong Kong, and Miami to support wider clean-pipe demand.[5] Buyers are therefore consolidating transport, security, and policy control with fewer providers that can support all three within one service framework. That bundling trend is increasing switching costs and giving the backbone network services market a stronger managed-services layer around premium routes. It is also reducing the room for providers that sell commodity transport without integrated protection.
Restraints Impact Analysis of Backbone Network Services Market*
| RESTRAINT | (~) % IMPACT ON CAGR FORECAST | GEOGRAPHIC RELEVANCE | IMPACT TIMELINE |
|---|---|---|---|
| High Capital Intensity of Core Transport and Fiber Assets | -1.8% | Global, most acute in North America, Europe, and East Asia, where 400G-to-800G upgrades overlap with new route builds | Medium term (2-4 years) |
| Cross-Border Regulatory Fragmentation and Data Sovereignty Constraints | -1.2% | Europe, Asia Pacific, South America, and emerging Middle East and Africa regimes | Long term (≥ 4 years) |
| Scarcity Of Specialized Optical and Routing Equipment Supply | -0.9% | Global, with the strongest pressure in hyperscaler-heavy North America and Asia Pacific markets | Short term (≤ 2 years) |
| Satellite And Alternative Path Substitution for Certain Traffic Classes | -0.5% | Rural markets, the Middle East and Africa, South America, and island or remote geographies | Medium term (2-4 years) |
| Source: Mordor Intelligence | |||
High Capital Intensity of Core Transport and Fiber Assets
High upgrade spending remains the largest structural brake on the backbone network services market. AT&T reported USD 22 billion in capital investment in 2025 and guided to USD 23 billion to USD 24 billion annually through 2028, underscoring how expensive concurrent fiber and core transport buildouts have become, even for the biggest operators. Those spending levels are harder for smaller regional carriers to match because optical components, routing platforms, and long lead times increasingly favor buyers with scale. The result is a wider gap between large carriers that can refresh routes quickly and smaller operators that must stretch asset life or delay upgrades. Some operators are responding by extending equipment life cycles and turning to secondary hardware channels when new-build pricing is least favorable. Even so, the backbone network services market remains exposed when route expansion, optical migration, and customer service commitments all demand capital simultaneously. This pressure is especially evident where 400G and 800G migrations overlap with new corridor builds.
Cross-Border Regulatory Fragmentation and Data Sovereignty Constraints
Regulatory fragmentation is making route design more complex across the backbone network services market. Rules linked to data sovereignty are forcing carriers to keep certain traffic classes within national or regional boundaries, even when a wider route would be more efficient. Equinix expanded its Fabric Geo Zones platform in 2026 to help customers enforce geographic routing constraints within the network fabric itself, which reflects growing demand for sovereignty-aware transport services. These requirements also affect peering and interconnection choices, as some markets are pushing traffic exchanges toward domestic locations rather than toward technically optimal external nodes. That reduces some of the flexibility that global carriers rely on when they balance latency, cost, and utilization across a mesh network. Over time, the backbone network services market may need more localized service architectures to satisfy compliance expectations without sacrificing premium service quality.
*Our forecasts treat driver/restraint impacts as directional, not additive. The impact forecasts reflect baseline growth, mix effects, and variable interactions.
Backbone Network Services Market Segment Analysis
By Network Type:
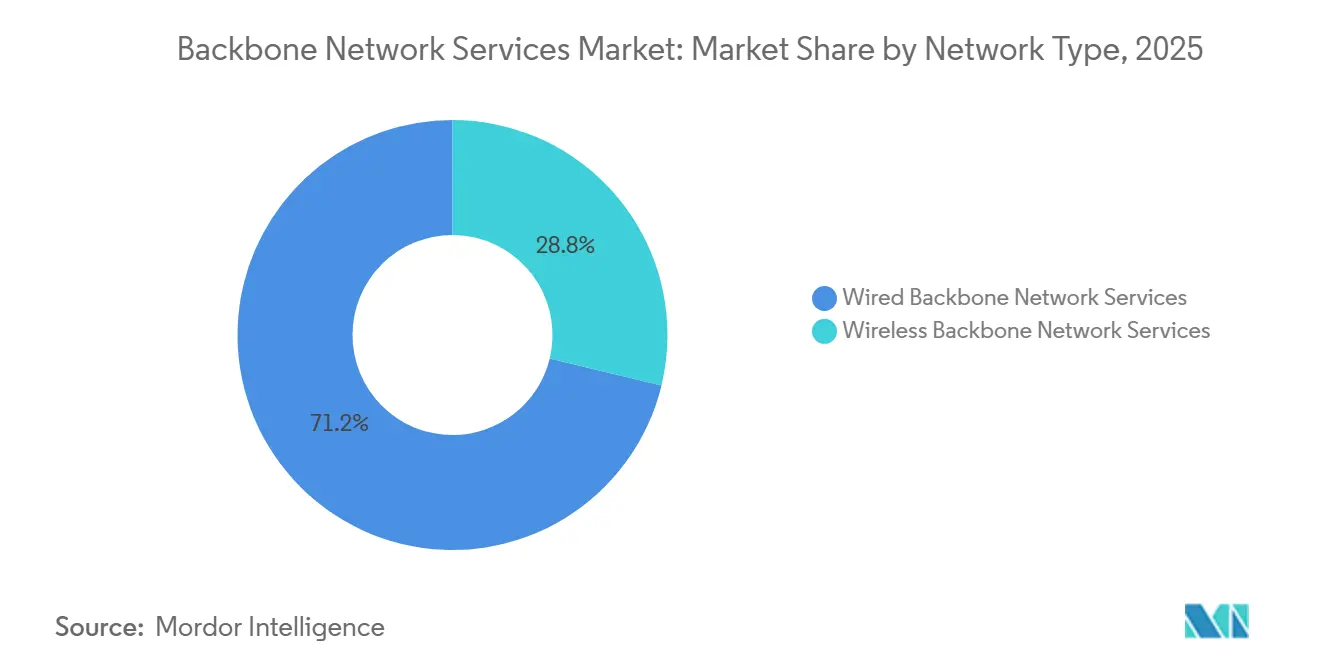
Fiber-Led Scale with Faster Wireless ExpansionWired backbone network services commanded 71.23% of revenue in 2025, which kept this segment as the clear base of the backbone network services market. Fiber still offers the best fit for high-capacity, low-latency inter-city transport where traffic density and signal stability matter most. The segment also benefits from the continued deployment of 400G and 800G wavelengths on national and cross-border routes. Nokia’s 2025 upgrade of KPN’s Dutch backbone to more than 216Tbps showed how operators are using new optical systems to expand scale without changing the core role of fiber. Within wired services, VPN backbone, intranet backbone, and dedicated wavelength offerings remain the main revenue pillars, while dark fiber leasing is gaining traction among buyers seeking greater route control.
That said, wireless backbone network services are forecast to grow at a 11.32% CAGR through 2031, making it the fastest-growing segment of this market. Its momentum comes from 5G small-cell backhaul, fixed wireless access corridors, and secondary inter-city links where full fiber deployment is slower or less economical. Ceragon’s IP-50EXP launch in 2025 demonstrated how millimeter-wave systems are closing part of the performance gap, reaching up to 20Gbps in a 2+0 configuration over routes that previously required exclusive E-band use. That strengthens the case for a mixed backbone design, especially in emerging markets where carriers want to lower deployment costs without sacrificing service quality. As a result, the backbone network services market is moving toward a more balanced model in which fiber remains central, while wireless backhaul becomes a stronger co-primary option on selected routes.
By Service Type:
Internet Transit Holds Scale While VPN Services Gain StrengthInternet backbone services held a 49.12% share in 2025, making this segment the largest service layer in the backbone network services market. That position reflects the continuing role of Tier 1 IP transit in carrying global internet traffic for carriers, enterprises, and digital platforms. GTT’s recognition in 2025 as the world’s third-largest global backbone by Tier 1 capacity, with more than 700 terabits across its network, showed that scale competition remains active despite pressure on price per bit. Intranet backbone services continue to serve enterprise and government buyers that need traffic separation, managed operations, and stronger service guarantees than commodity transit can provide. That keeps premium demand present even when standard transit margins remain tight.
VPN backbone services are expected to grow at a 10.87% CAGR through 2031, making it the fastest-growing service type in this review. The segment is benefiting from software-defined WAN adoption because many enterprises still need managed backbone transport beneath their policy and application layers. Lumen said in January 2026 that its Network-as-a-Service customer base had grown to more than 2,000 businesses since the third quarter of 2025, driven by programmable connectivity for AI-driven and multi-cloud workloads. That shift is pushing the backbone network services industry to treat VPN backbone less as a legacy substitute for leased lines and more as a software-orchestrated transport fabric. It also broadens the role of VPN services into AI training interconnect, real-time inference support, and other workloads where latency and traffic predictability remain critical.
By Connectivity Model:
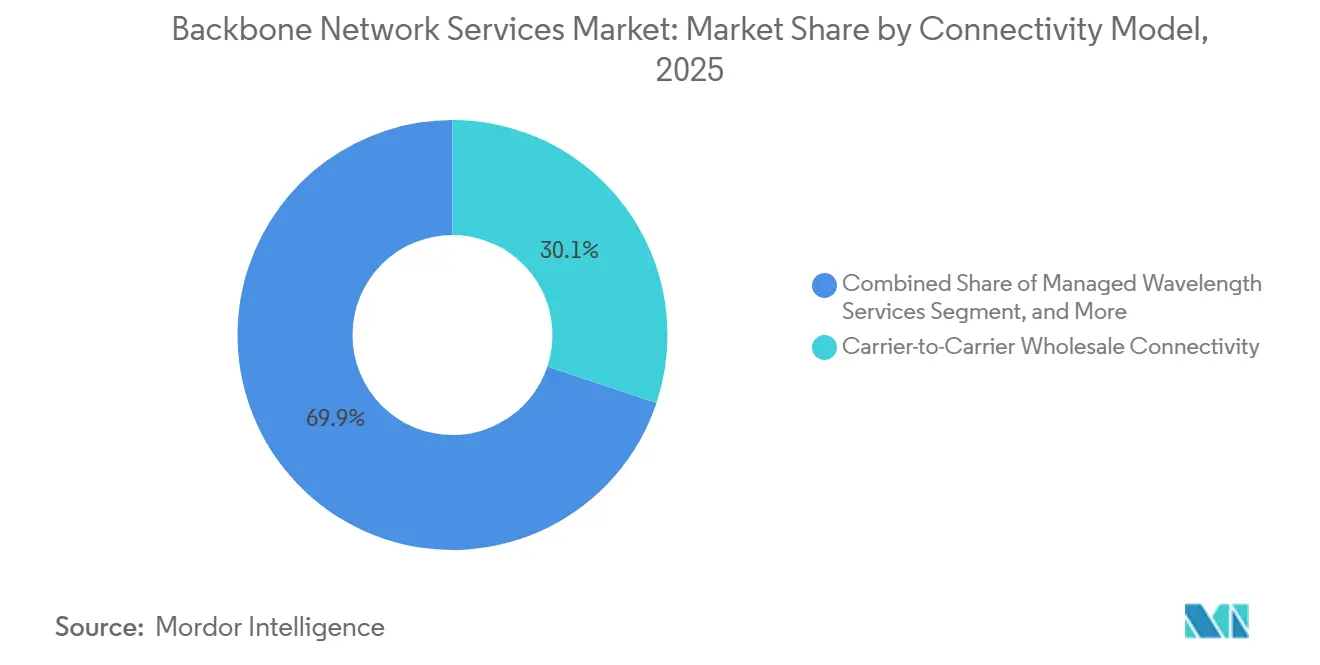
Wholesale Connectivity Provides The Base While Wavelength Services AccelerateCarrier-to-Carrier Wholesale Connectivity held a 30.12% share in 2025, making it the largest connectivity model in the backbone network services market mix. This segment remains important because inter-operator agreements still form the base layer for routing traffic across large national and international backbone meshes. It benefits from long-standing peering relationships and transit contracts between Tier 1 and Tier 2 carriers, even as the price per bit continues to decline. Dedicated point-to-point services and other models continue to grow alongside enterprise private line demand and hyperscaler route expansion. That means wholesale remains foundational, but it no longer captures the full value of premium capacity on the most strategic corridors.
Managed wavelength services are projected to grow at a 11.65% CAGR through 2031, giving it the strongest outlook in this segmentation. Demand is driven by buyers who want scalable capacity with strong performance control, but without the operational burden of owning the full physical layer. Lumen reported nearly USD 13 billion in total Private Connectivity Fabric deals at its 2026 Investor Day and said it planned to expand intercity fiber miles from 17 million at the end of 2025 to 58 million by 2031. That model lets carriers keep control of route planning and optical management while still giving customers on-demand access to high-performance capacity. In the backbone network services market, this is creating a stronger middle ground between commodity transit and full dark fiber ownership.

By End Use:
Telecom Keeps Revenue Leadership While Cloud Providers Shape DemandTelecommunications accounted for 29.88% of revenue in 2025, keeping carriers as the largest end-use segment in the backbone network services market. Mobile and fixed-line operators still purchase large volumes of transit, backhaul, and inter-exchange capacity to support broad national coverage. Enterprise, government, healthcare, and education users also contribute meaningful demand because they often require dedicated paths for compliance, latency, and security. GÉANT’s February 2026 completion of its upgraded 800G IP backbone, serving more than 10,000 research institutions with over 216Tbps capacity, showed how large-scale non-commercial procurement is also rising in absolute terms. Content and digital platforms add further load through traffic-heavy applications that need geographically resilient paths.
Cloud service providers are projected to grow at a 10.75% CAGR through 2031, making it the fastest-growing end-use segment. Hyperscalers are increasing spending on AI training interconnect and are mixing owned, co-invested, and purchased capacity more actively than before. China Mobile’s commitment of HKD 10 billion (USD 1.28 billion) over 5 years in Hong Kong to connect the city with its national computing network showed how cloud and AI routing needs are shaping new backbone decisions in the Asia Pacific. This behavior is setting new benchmarks for speed, density, and route control across the backbone network services industry. As those expectations spread, the backbone network services market is likely to see faster migration toward higher-capacity services across other buyer groups as well.
Geography Analysis
North America Backbone Network Services Market
North America held 28.95% of the backbone network services market share in 2025, which kept the region as the anchor of global demand. The backbone network services market in North America continues to benefit from a dense base of hyperscaler campuses, Tier 1 carrier networks, and enterprise connectivity spending. AT&T announced a USD 250 billion five-year infrastructure commitment in 2026, with annual capital expenditure guidance of USD 23 billion to USD 24 billion through 2028 and a fiber deployment run rate targeting 4 million new locations per year by the end of 2026. Lumen also advanced its NorthLine route in 2026 to connect Seattle and Minneapolis along northern data center corridors built for AI data movement. These investments show that regional growth is moving toward AI-linked long-haul corridors and private connectivity fabrics rather than solely toward standard wholesale expansion.
Europe Backbone Network Services Market
Europe remains strategically important because the region combines heavy enterprise traffic, sovereign infrastructure priorities, and rising compliance demands. The backbone network services market in Europe is being reshaped by route realignment, stronger domestic resilience planning, and faster migration toward high-capacity optical systems. Nokia’s 2025 upgrade of KPN’s transport and core network to an 800G-ready architecture, with more than 216Tbps of capacity, reflected this move toward denser, more automated infrastructure. GÉANT’s 800G IP backbone migration in February 2026 pointed in the same direction, as research and education traffic also required a much larger capacity base across Europe. This combination of commercial demand and policy-led resilience is supporting a more disciplined upgrade cycle across the region.
APAC, MEA and South America Backbone Network Services Market
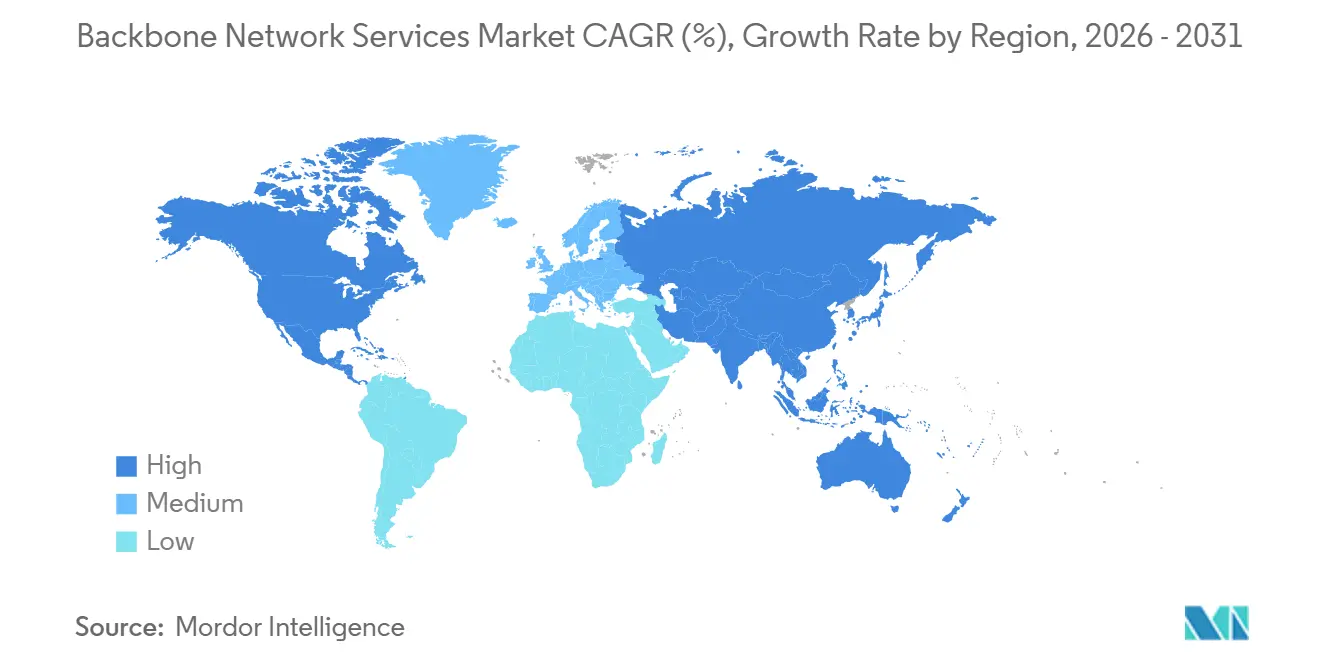
The Asia Pacific backbone network services market is projected to expand at a 11.33% CAGR through 2031, making it the fastest-growing geographic segment. The region’s pace reflects major buildouts across China, India, and Southeast Asia, where AI clusters, cloud growth, and 5G expansion are increasing demand for stronger national and regional backbones. China Mobile’s Hong Kong investment and computing-network integration plans signaled the scale at which cloud-linked routing demand is now being planned in the region. In India, Nokia’s deployment for Vodafone Idea showed how large operators are strengthening IP/MPLS transport to support denser 4G and 5G traffic. The Middle East and Africa are also gaining importance through route diversification and new east-west cable projects, while South America is attracting attention from long-haul fiber projects tied to AI, cloud, and nearshoring demand. Together, these patterns keep the backbone network services market tilted toward Asia Pacific for the fastest expansion, while other emerging regions build selective corridors around resilience and data center growth.
Competitive Landscape
The backbone network services market remains moderately concentrated, with a small group of Tier 1 carriers controlling the broadest international reach while many regional and specialist operators compete on selected corridors. The backbone network services market is now shaped by two competitive tracks: established carriers defending wholesale and enterprise relationships, and hyperscalers increasing direct control over routes that matter most to their own workloads. This is pushing incumbents to strengthen scale, automate traffic control, and bundle managed services more closely with core transport offerings. It is also making route quality, security integration, and provisioning speed more important than simple bandwidth price on premium contracts.
Lumen’s repositioning is a clear example of this change in the backbone network services market. The company reported nearly USD 13 billion in Private Connectivity Fabric agreements at its 2026 Investor Day, showing how carrier strategy is moving toward AI-ready, programmable transport rather than legacy voice-era assets. KDDI’s 2026 deployment of cluster-based, distributed, disaggregated backbone routers offered another example, as a 50% reduction in equipment deployment costs can translate into faster route upgrades and greater vendor flexibility. GTT also used network scale and security depth to sharpen its position, building on more than 700 terabits of Tier 1 backbone capacity and 4Tbps of DDoS scrubbing capability. These moves show that leading companies are competing through service depth and operating model, not only through route ownership.
The backbone network services market also leaves room for regional players that specialize in AI corridors, low-latency metro-to-long-haul links, or security-led backbone offers. Zayo’s 2025 completion of its Umatilla-Prineville-Reno long-haul dark fiber route illustrated how targeted route investment can be positioned directly around AI and cloud traffic patterns. Its related IP backbone overhaul with Nokia, starting in New York and New Jersey, also showed how operators are preparing for wider 400G and 800G service expansion across many markets. At the same time, hyperscaler self-build keeps shifting the competitive balance because those firms can be both the largest customers and substitutes for wholesale demand on core routes. That pressure favors carriers that can become preferred build partners or managed service providers on AI-heavy corridors. It is less favorable for operators that depend mainly on standard transit volume without differentiated control, security, or wavelength capabilities.
Backbone Network Services Industry Leaders
-
Verizon Communications Inc.
-
AT&T Inc.
-
China Mobile Limited
-
Lumen Technologies, Inc.
-
Vodafone Group Plc
- *Disclaimer: Major Players sorted in no particular order
Backbone Network Services Market Companies Covered in this Report
- Verizon Communications Inc.
- AT&T Inc.
- China Mobile Limited
- Deutsche Telekom AG
- China Telecom Corporation Limited
- Bharti Airtel Limited
- British Telecommunications plc
- China Unicom (Hong Kong) Limited
- Tata Communications Limited
- Lumen Technologies, Inc.
- Cogent Communications Holdings, Inc.
- Vodafone Group Plc
- Orange S.A.
- NTT Communications Corporation
- Telstra Group Limited
- Arelion
- Equinix, Inc.
- Digital Realty Trust, Inc.
- GTT Communications, Inc.
- Colt Technology Services Group Limited
- KDDI Corporation
Recent Industry Developments in Backbone Network Services Market
- April 2026: AT&T announced a USD 250 billion five-year infrastructure commitment, encompassing fiber, 5G, and satellite network expansion across the United States. The commitment includes plans to reach a fiber deployment run rate of 4 million new locations per year by the end of 2026, growing to 5 million annually thereafter, establishing AT&T as the largest backbone infrastructure investor in North America over the forecast period.
- March 2026: China Mobile unveiled the GSE-DCI (Global Scheduling Ethernet-Data Center Interconnect) solution at MWC Barcelona 2026, featuring a backbone router prototype with 115.2T switching capacity, 144 long-haul 800GE ports, and a target efficiency exceeding 98% for distributed AI training across data centers. The launch signals intent to commercialize AI-optimized backbone interconnect as a standalone product category.
- February 2026: GÉANT completed the migration of its 30,000 km pan-European IP backbone to Nokia 800G infrastructure, raising capacity to more than 216Tbps from 48Tbps previously, and deploying SRv6-based automation across its IP/MPLS layer. The project provides the research and education network backbone for over 10,000 institutions across Europe.
- February 2026: Lumen Technologies reported USD 13 billion in cumulative Private Connectivity Fabric agreements at its 2026 Investor Day, including a purpose-built backbone partnership with Anthropic. The company set plans to expand from 17 million intercity fiber miles at year-end 2025 to 58 million miles by 2031, supported by USD 2.5 billion in recent new PCF agreements.
Global Backbone Network Services Market Report Scope
The Backbone Network Services Market Report is Segmented by Network Type (Wired and Wireless), Service Type (Internet Backbone, Intranet, and VPN Backbone), Connectivity Model (P2P, Carrier-to-Carrier Wholesale, Managed Wavelength, and Other connectivity Model), End Use (Telecom, Enterprise, Government, Education, Healthcare, Content Platforms, and Cloud Providers), and Geography (North America, South America, Europe, Asia-Pacific, and Middle East and Africa. The Market Forecasts are Provided in Terms of Value (USD).
Segmentation Overview
| Wired Backbone Network Services |
| Wireless Backbone Network Services |
| Internet Backbone Services |
| Intranet Backbone Services |
| VPN Backbone Services |
| Dedicated Point-to-Point Connectivity |
| Carrier-to-Carrier Wholesale Connectivity |
| Managed Wavelength Services |
| Other Connectivity Model |
| Telecommunication |
| Enterprise |
| Government |
| Education |
| Healthcare |
| Content and Digital Platforms |
| Cloud Service Providers |
| North America | United States |
| Canada | |
| Mexico | |
| South America | Brazil |
| Argentina | |
| Rest of South America | |
| Europe | Germany |
| United Kingdom | |
| France | |
| Italy | |
| Spain | |
| Russia | |
| Rest of Europe | |
| Asia-Pacific | China |
| India | |
| Japan | |
| South Korea | |
| Australia | |
| Rest of Asia-Pacific | |
| Middle East | Saudi Arabia |
| United Arab Emirates | |
| Israel | |
| Turkey | |
| Rest of Middle East | |
| Africa | South Africa |
| Nigeria | |
| Rest of Africa |
| By Network Type | Wired Backbone Network Services | |
| Wireless Backbone Network Services | ||
| By Service Type | Internet Backbone Services | |
| Intranet Backbone Services | ||
| VPN Backbone Services | ||
| By Connectivity Model | Dedicated Point-to-Point Connectivity | |
| Carrier-to-Carrier Wholesale Connectivity | ||
| Managed Wavelength Services | ||
| Other Connectivity Model | ||
| By End Use | Telecommunication | |
| Enterprise | ||
| Government | ||
| Education | ||
| Healthcare | ||
| Content and Digital Platforms | ||
| Cloud Service Providers | ||
| By Geography | North America | United States |
| Canada | ||
| Mexico | ||
| South America | Brazil | |
| Argentina | ||
| Rest of South America | ||
| Europe | Germany | |
| United Kingdom | ||
| France | ||
| Italy | ||
| Spain | ||
| Russia | ||
| Rest of Europe | ||
| Asia-Pacific | China | |
| India | ||
| Japan | ||
| South Korea | ||
| Australia | ||
| Rest of Asia-Pacific | ||
| Middle East | Saudi Arabia | |
| United Arab Emirates | ||
| Israel | ||
| Turkey | ||
| Rest of Middle East | ||
| Africa | South Africa | |
| Nigeria | ||
| Rest of Africa | ||
Key Questions Answered in the Report
What is the current size of the backbone network services space, and where is it headed by 2031?
The backbone network services market stood at USD 105.21 billion in 2025 and is forecast to reach USD 182.12 billion by 2031 at a 9.57% CAGR over 2026-2031.
Which network type contributes the most revenue today?
Wired backbone network services led with 71.23% revenue share in 2025 because fiber remains the strongest option for high-capacity and low-latency inter-city transport.
Which service area is expanding the fastest through 2031?
Managed Wavelength Services is projected to grow at 11.65% CAGR, while VPN backbone services are also rising quickly at 10.87% as enterprises adopt programmable network models.
Which end users are changing demand patterns the most?
Cloud service providers are the fastest-growing end-use segment, with a 10.75% CAGR, driven by increasing AI training, multi-cloud traffic, and private interconnect needs, which are driving route and capacity requirements.
Which region is expected to grow the fastest over the forecast period?
Asia Pacific is expected to post the fastest growth at a 11.33% CAGR, supported by China's computing network buildout, India's transport upgrades, and broader data center expansion.
What are the biggest challenges for backbone operators right now?
The main constraints are high capital intensity for fiber and transport upgrades, tighter data-sovereignty rules, and continued pressure from the limited supply of high-speed optical and routing equipment.