Autonomous Telecom Networks Market Size and Share
Market Overview
| Study Period | 2020 - 2031 |
|---|---|
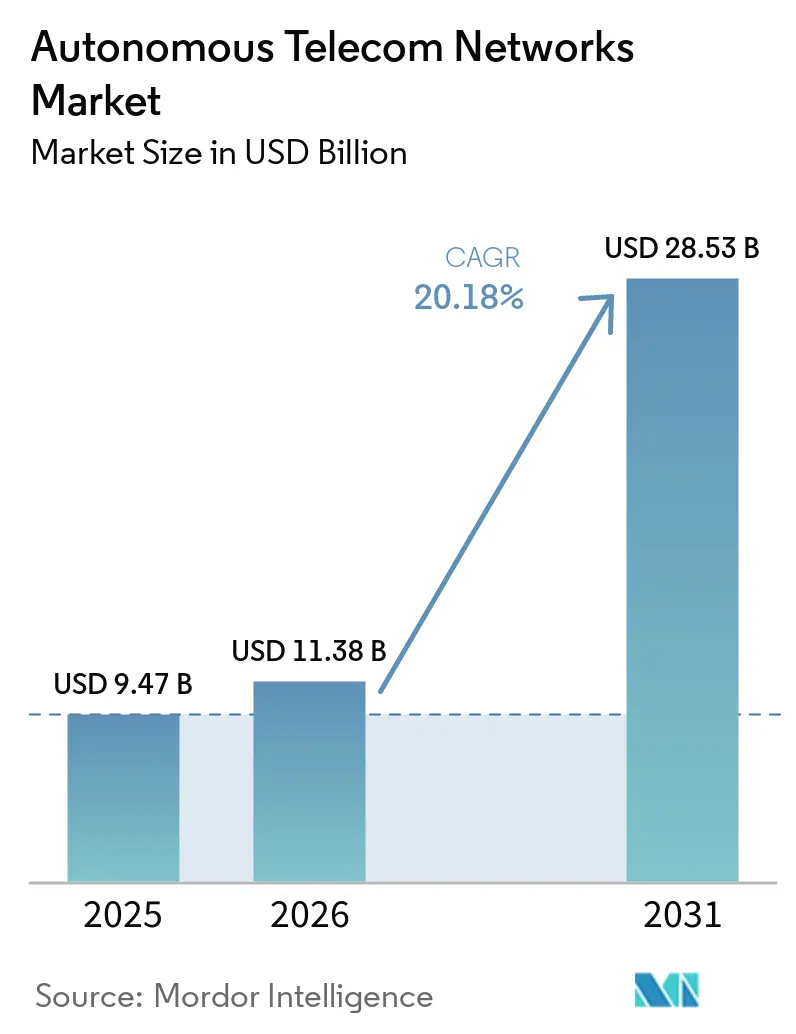
| Market Size (2026) | USD 11.38 Billion |
| Market Size (2031) | USD 28.53 Billion |
| Growth Rate (2026 - 2031) | 20.18% CAGR |
| Fastest Growing Market | North America |
| Largest Market | Asia-Pacific |
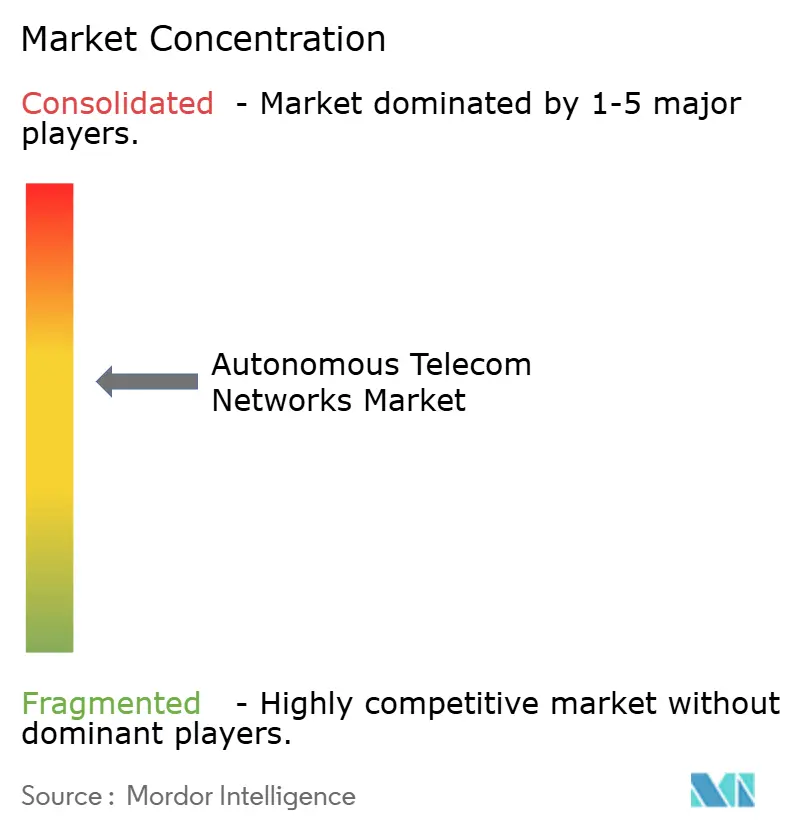
| Market Concentration | Medium |
Major Players *Disclaimer: Major Players sorted in no particular order Image © Mordor Intelligence. Reuse requires attribution under CC BY 4.0. | |
Autonomous Telecom Networks Market Analysis by Mordor Intelligence
The Autonomous Telecom Networks Market size is projected to expand from USD 9.47 billion in 2025 and USD 11.38 billion in 2026 to USD 28.53 billion by 2031, registering a CAGR of 20.18% between 2026 to 2031. Traffic carried over 5G standalone architectures is expanding at double-digit rates, while multivendor Open RAN deployments are multiplying the number of network elements that operators must manage every day. The resulting complexity is pushing carriers toward AI-driven, self-optimizing networks that can predict faults, correct configuration drift, and allocate spectrum without manual intervention. Tier-1 mobile network operators demonstrated the commercial viability of closed-loop automation in 2025, when Telefónica, Orange, and TELUS reported operational cost reductions of 25% to 40% by replacing manual workflows with AI-guided processes. In parallel, enterprises in automotive, logistics, and healthcare are ordering dedicated 5G private networks that embed AI assurance functions at the edge, opening a new revenue channel for vendors that can deliver explainable and auditable automation frameworks.
Key Report Takeaways
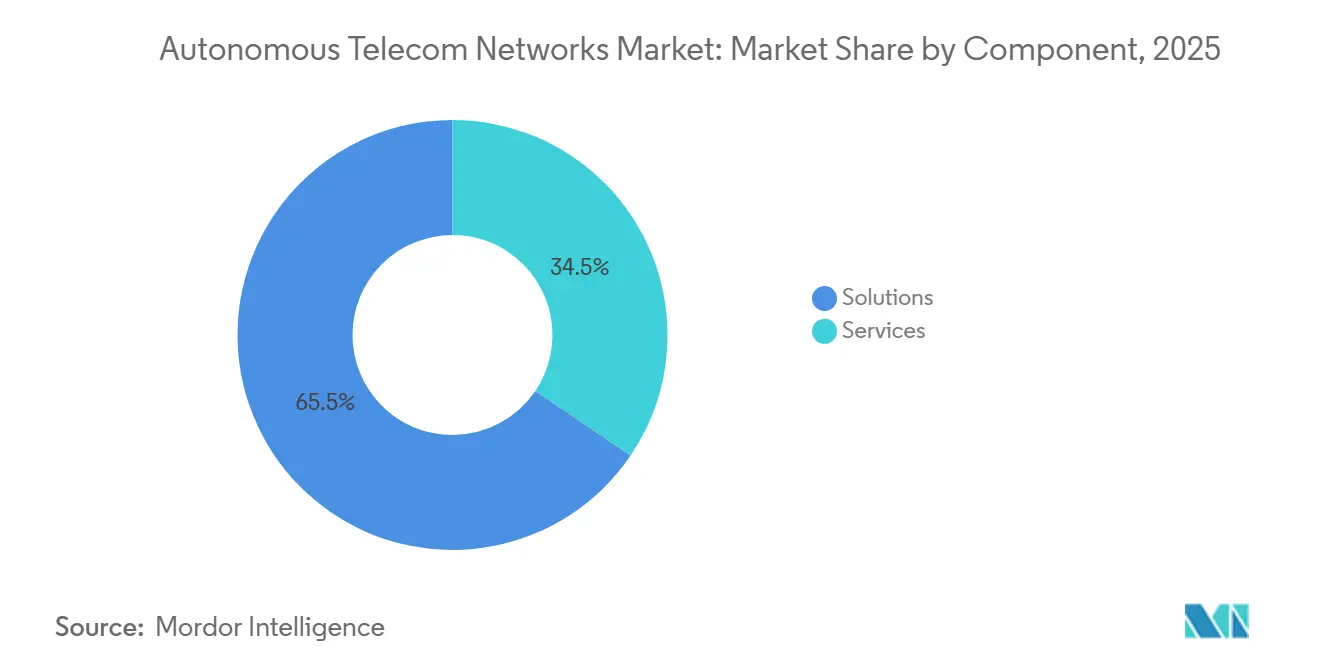
- By component, solutions held 65.53% of the autonomous telecom networks market share in 2025, while services are advancing at a 22.02% CAGR through 2031.
- By network layer, radio access automation led with 38.73% revenue share of the autonomous telecom networks market in 2025, whereas edge orchestration is forecast to post a 23.66% CAGR to 2031.
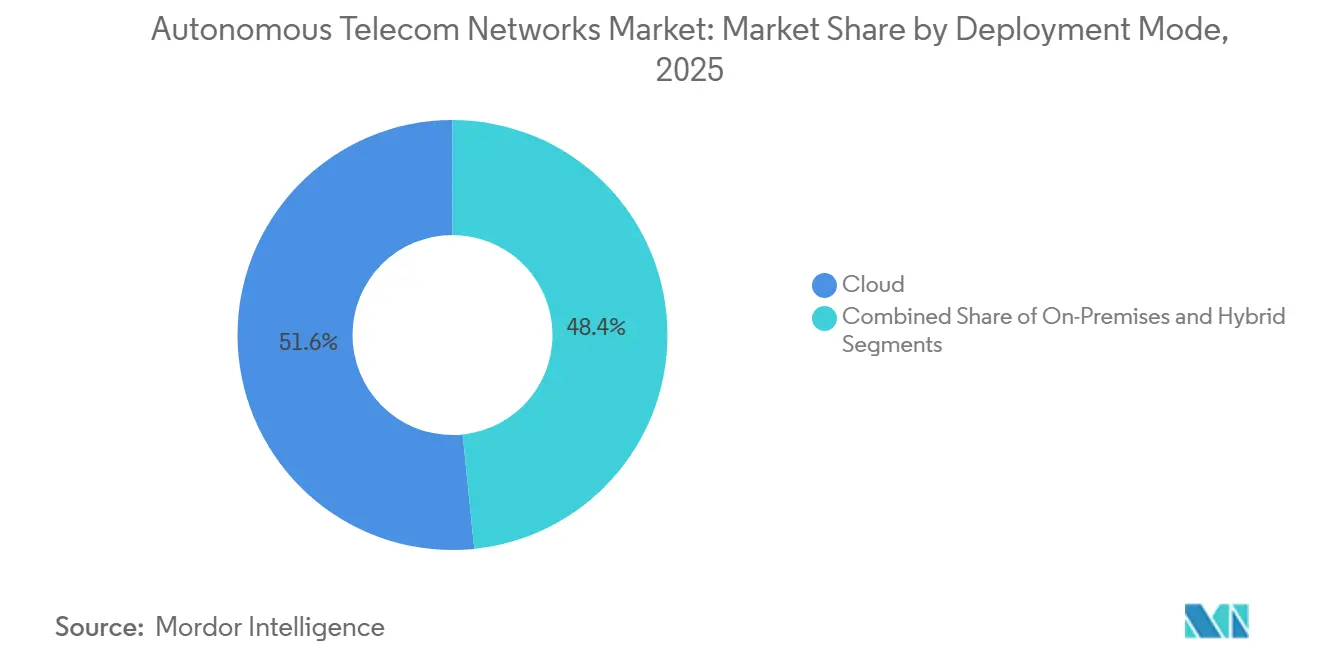
- By deployment mode, cloud installations accounted for 51.62% of the autonomous telecom networks market in 2025, and hybrid architectures have the fastest trajectory, with a 22.48% CAGR.
- By end user, Tier-1 mobile network operators held 42.12% share of the autonomous telecom networks market size in 2025, while private network owners are set to expand at a 24.11% CAGR between 2026 and 2031.
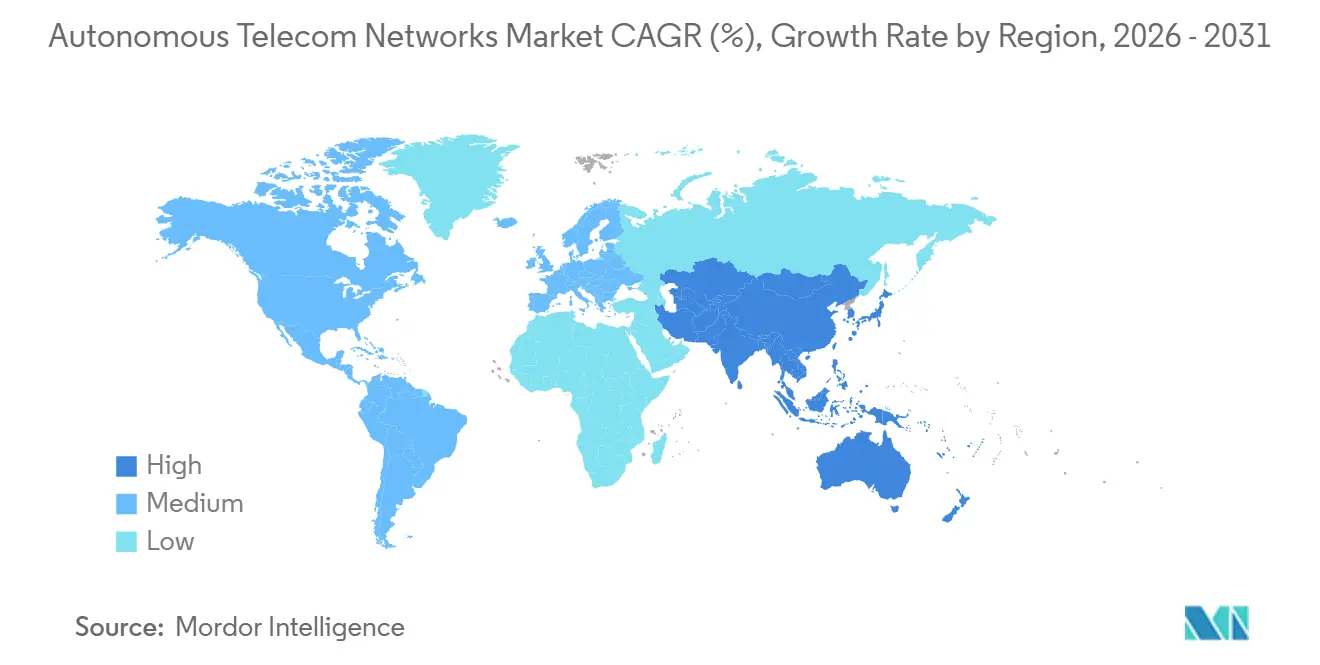
- By geography, North America dominated the autonomous telecom networks market with a 36.21% revenue share in 2025, and Asia-Pacific is projected to deliver the fastest regional growth at a 23.52% CAGR through 2031.
Note: Market size and forecast figures in this report are generated using Mordor Intelligence’s proprietary estimation framework, updated with the latest available data and insights as of January 2026.
Global Autonomous Telecom Networks Market Trends and Insights
Drivers Impact Analysis*
| Driver | ( ~ ) % Impact on CAGR Forecast | Geographic Relevance | Impact Timeline |
|---|---|---|---|
| Rising 5G Network Complexity and Traffic Volume | +4.2% | Global, with peak intensity in North America, China, Japan, South Korea | Medium term (2-4 years) |
| Escalating OPEX Reduction Imperatives | +3.8% | Global, particularly Europe and North America where labor costs are highest | Short term (≤ 2 years) |
| Shortage of Skilled Network Engineers | +2.9% | Global, acute in North America, Europe, and developed Asia Pacific markets | Long term (≥ 4 years) |
| Transition to Cloud-Native Service-Based Architectures | +3.5% | Global, led by North America and Europe, expanding to Asia Pacific | Medium term (2-4 years) |
| Adoption of RAN Intelligent Controller Automation | +3.1% | Global, with early traction in United States, Germany, Japan, South Korea | Medium term (2-4 years) |
| Multi-Vendor Open RAN Interoperability Requirements | +2.7% | Global, driven by regulatory mandates in United States, European Union, India | Long term (≥ 4 years) |
| Source: Mordor Intelligence | |||
Rising 5G Network Complexity and Traffic Volume
Fifth-generation standalone networks layer dynamic spectrum sharing, massive-MIMO beam steering, and multi-slice orchestration on top of existing 4G infrastructure. Verizon deployed RAN intelligent controllers across 15 metropolitan areas in 2025 and cut manual intervention on 40,000 cell sites by 68%. Deutsche Telekom processed 2.3 billion radio measurements per day in 2025, boosting spectral efficiency by 22% in dense urban areas. Release 18 of the 3GPP standard, finalized in 2024, now mandates AI/ML interfaces throughout the 5G core, compelling operators to embed predictive analytics within routine workflows or risk falling behind faster-moving rivals.[1]3GPP, “Release 18 Specifications,” 3gpp.org
Escalating OPEX Reduction Imperatives
Average revenue per user remains flat, yet 5G densification raises electricity, site leasing, and backhaul expenses. Telefónica’s AI fault-prediction program removed 12,000 truck rolls and cut network OPEX by 30% in 2025.[2]Telefónica, “Annual Report 2025,” telefonica.com Orange lifted operational efficiency by 25% after automating parameter tuning in the same year. In early 2026, TELUS reported a 40% reduction in mean-time-to-repair and an 18% drop in energy consumption per gigabyte, equating to USD 89 million in annual savings. These gains illustrate how autonomous workflows decouple network growth from headcount growth.
Shortage of Skilled Network Engineers
Retirement of experienced RF engineers is outpacing the entry of graduates trained in 5G, Open RAN, and AI. The International Telecommunication Union found that 42% of operators ranked the talent gap among their top constraints in 2024. Nokia’s 2025 automation suite performs root-cause analysis that used to require senior engineers, enabling Tier-2 carriers to uphold service-level agreements without expanding staff. Rakuten Mobile operates Japan’s first fully virtualized network with 60% fewer engineers per subscriber than legacy peers, a benchmark smaller carriers now target.
Transition to Cloud-Native Service-Based Architectures
The share of Tier-1 operators running Kubernetes-orchestrated network functions jumped to 67% in 2025, up from 38% two years earlier, according to the Cloud Native Computing Foundation. NVIDIA’s AI-RAN platform couples GPU acceleration with cloud-native RAN software to run inference in shared compute pools rather than custom ASICs. Google Cloud’s Network Operations Assistant, launched in 2025, deploys generative AI that applies configuration changes within hours rather than weeks, while ETSI service-based interface standards oblige vendors to expose APIs consumable by those orchestration layers.
Restraints Impact Analysis*
| Restraint | ( ~ ) % Impact on CAGR Forecast | Geographic Relevance | Impact Timeline |
|---|---|---|---|
| High Upfront Investment in AI Platforms | -2.4% | Global, most acute for Tier-2 and Tier-3 operators in emerging markets | Short term (≤ 2 years) |
| Data Privacy and Cyber-Security Concerns | -1.8% | Global, with heightened scrutiny in European Union, United States, China | Medium term (2-4 years) |
| Legacy Integration Complexity | -1.6% | Global, particularly operators with extensive 2G/3G/4G infrastructure | Medium term (2-4 years) |
| Algorithmic Bias and Explainability Risks | -1.1% | Global, regulatory focus in European Union, United States, United Kingdom | Long term (≥ 4 years) |
| Source: Mordor Intelligence | |||
High Upfront Investment in AI Platforms
Ericsson estimates that a Tier-1 carrier with 50,000 sites spends USD 15 million to USD 30 million to roll out its intelligent automation platform, including GPU servers and professional services.[3]Ericsson, “Intelligent Automation Platform White Paper,” ericsson.com Mavenir’s 2024 Open RAN project at Dish Network exceeded USD 50 million before network traffic even flowed. Tier-2 operators therefore prefer consumption-based contracts, yet the total cost of ownership in the first three years still runs 40% to 60% above that of traditional architectures.
Data Privacy and Cyber-Security Concerns
Autonomous networks collect fine-grained subscriber telemetry that regulators classify as sensitive. NIST’s Cybersecurity Framework 2.0 mandates zero-trust pipelines and auditable AI logs for critical infrastructure, raising compliance costs. ETSI now requires third-party security assessments for AI models before production use, extending release timelines. Huawei mitigates data-residency constraints by training models with federated learning, ensuring raw data never leaves the country of origin.
*Our forecasts treat driver/restraint impacts as directional, not additive. The impact forecasts reflect baseline growth, mix effects, and variable interactions.
Segment Analysis
By Component: Services Surge as Integration Complexity Escalates
Solutions accounted for 65.53% of revenue in 2025, yet services are forecast to expand at a 22.02% CAGR as operators confront multivendor integration challenges and skill shortages. IBM captured contracts worth more than USD 200 million in 2025 by drafting roadmaps that aligned legacy OSS, emerging open APIs, and governance policies.[4]IBM, “Q2 2025 Earnings Call,” ibm.com As a result, recurring service fees now represent 60% of Netcracker’s revenue mix with gross margins above 40%, confirming that bespoke integration and managed operations have become a profit pool equal to platform licenses.
Vendor margins on services benefit from reusable AI models and offshore delivery hubs, letting providers monetize intellectual property several times over while operators shift spend from capex to opex. Accenture saw telecommunications managed-service revenue climb 34% year over year in 2026, tied to five-year engagements that lock in vendor participation across the life of an autonomous network. The autonomous telecom networks market size for managed operations is therefore rising faster than platform revenue, even though solutions remain the largest absolute bucket.


By Network Layer: Edge Automation Outpaces Core as Latency Demands Intensify
Radio access automation accounted for the largest share of 2025 revenue at 38.73%, but edge orchestration is projected to outpace every other layer with a 23.66% CAGR, driven by enterprise demand for sub-10-millisecond latency. Samsung’s AI RAN engine boosted cell-edge throughput by 18% for Verizon and KDDI during 2025. NEC’s edge AI nodes bring inference closer to production lines and have already enabled car manufacturers to meet six-sigma quality targets in real-time video analytics.
While the autonomous telecom networks market share remains highest in the RAN, the market size linked to edge functions is growing rapidly as factories, ports, and stadiums deploy micro data centers. Juniper says its transport automation suite reduced packet loss by 42% by rerouting traffic around congestion hotspots, demonstrating that AI's impact is meaningful even in the less visible backhaul domain.
By Deployment Mode: Hybrid Architectures Gain as Operators Balance Economics and Control
Cloud deployments captured 51.62% of 2025 spending as hyperscalers offered elastic compute and ready-made AI services. Yet a 22.48% CAGR through 2031 for hybrid configurations shows operators do not accept a one-size-fits-all model. Deutsche Telekom runs latency-critical optimization on-premises while sending batch analytics to Google Cloud, saving 35% versus a fully local stack. China Mobile follows a similar pattern, keeping inference within provincial data centers for data sovereignty but training models on Alibaba Cloud.
The 3GPP Release 18 interface definitions ensure workloads can move between private and public clouds without code rewrites, reducing lock-in and giving operators bargaining power over pricing. Consequently, the autonomous telecom networks market size attached to hybrid architectures is growing faster than the on-premises segment, even though the latter remains crucial in high-regulation countries.

By End User: Private Networks Accelerate as Enterprises Demand Dedicated Spectrum and AI-Driven QoS
Tier-1 carriers retained 42.12% revenue share in 2025, yet enterprises are the real growth engine. Private network owners are on track for a 24.11% CAGR to 2031 as manufacturers and logistics hubs secure dedicated spectrum and AI-driven quality guarantees. BMW reported 99.9999% uptime and sub-5-millisecond latency at its Regensburg plant after rolling out an AI-assured 5G network in 2025.
Regional operators with thin balance sheets increasingly buy autonomous functionality as a managed service. TEOCO signed 40 such customers in 2025, charging subscription fees starting at USD 500,000 per year. The autonomous telecom networks industry, therefore, now addresses a broader base than traditional mobile operators alone, extending to automotive OEMs, airlines, and logistics groups.
Geography Analysis
North America, which accounted for 36.21% of 2025 revenue, is forecast to compound at 19.8% annually through 2031. U.S. carriers have already moved 5G standalone traffic onto AI-driven cores, while Canadian operators invested more than CAD 2 billion in automation to extend coverage into sparsely populated provinces. The region also benefits from Open RAN procurement incentives that reduce vendor lock-in and encourage experimentation with cloud-native stacks.
Asia-Pacific is on course to deliver the fastest expansion at 23.52% through 2031. China Mobile applied AI optimization to more than 1 million cell sites in 2025, boosting spectral efficiency by 15%. Japan’s NTT DOCOMO runs an AI network operations center covering 80,000 sites, and South Korea’s SK Telecom earns over USD 112 million annually from AI-enabled network slices. India’s Bharti Airtel and Reliance Jio together invested roughly USD 1.2 billion in 2025 automation projects, highlighting the region’s scale.
Europe held about 22% of 2025 spending and should post an 18.5% CAGR as energy-efficiency mandates and security rules accelerate automation. Deutsche Telekom’s hybrid cloud network achieved 99.99% availability across three countries, while Vodafone cut truck rolls by 35% through predictive maintenance. The Middle East and Africa account for 6% of current revenue, driven by Saudi Arabia’s smart-city initiatives and United Arab Emirates projects, whereas Latin America lags at 4% but is gaining momentum as carriers seek OPEX relief.

Competitive Landscape
Incumbent vendors Ericsson, Nokia, and Huawei still anchor most large-scale rollouts thanks to their installed base relationships and integrated portfolios. However, cloud-native challengers such as Mavenir, Parallel Wireless, and Cellwize exploit containerized functions and Open RAN interfaces to undercut classic hardware economics. IBM, Cisco, and HPE are translating their IT automation expertise into telecom environments, often selling outcome-based managed services rather than perpetual licenses.
Differentiation now rests on model explainability, multivendor interoperability and service delivery. Ericsson leads O-RAN AI specification work, Nokia bought a generative AI specialist in 2025, and Samsung joined forces with AWS to run RAN optimization on edge infrastructure. As 3GPP Release 19 moves toward AI-native air interfaces, vendors with deep standards engagement and long-term R&D budgets should retain an edge over point-solution players.
White-space opportunities remain in neutral-host automation and MVNO cost optimization, segments where incumbent infrastructure makers have limited presence. The autonomous telecom networks market, therefore, supports both scale players and highly focused specialists.
Autonomous Telecom Networks Industry Leaders
Telefonaktiebolaget LM Ericsson
Nokia Corporation
Huawei Technologies Co., Ltd.
ZTE Corporation
Samsung Electronics Co., Ltd.
- *Disclaimer: Major Players sorted in no particular order

Recent Industry Developments
- February 2026: Nokia partnered with Microsoft to embed Azure AI into its network operations platform for generative AI configuration management.
- January 2026: Ericsson announced a USD 250 million expansion of its Stockholm AI R&D center, adding 400 engineers for explainable algorithms.
- December 2025: Huawei introduced Autonomous Driving Network 3.0, which China Mobile deployed across 10 provinces, trimming incident resolution time by 40%.
- November 2025: Mavenir won a USD 180 million cloud-native RAN deal with a Southeast Asian Tier-1 operator covering 20,000 sites.


Global Autonomous Telecom Networks Market Report Scope
Autonomous telecom networks are next‑generation communication networks capable of self‑configuration, self‑optimization, and self‑healing through artificial intelligence, automation frameworks, and cloud‑native architectures. These networks aim to reduce operational complexity, enhance service reliability, improve energy efficiency, and enable dynamic, intent‑based network management across multi‑layer telecom infrastructures. Autonomous network capabilities are increasingly critical for operators deploying 5G, edge computing, private networks, and future 6G‑ready architectures.
The global autonomous telecom networks market is segmented by component (solutions and services), network layer (radio access network, core network, transport network, edge network, and end‑to‑end orchestration), deployment mode (on‑premises, cloud, and hybrid), end user (Tier‑1 mobile network operators, Tier‑2 and Tier‑3 mobile network operators, mobile virtual network operators, private network owners across enterprises and industry verticals, and neutral host providers), and geography (North America, South America, Europe, Asia-Pacific, and Middle East and Africa, with detailed country‑level coverage). The market sizes and forecasts are provided in terms of value (USD) for all the above segments.
| Solutions |
| Services |
| Radio Access Network (RAN) |
| Core Network |
| Transport Network |
| Edge Network |
| End-to-End Orchestration |
| On-Premises |
| Cloud |
| Hybrid |
| Tier-1 Mobile Network Operators |
| Tier-2 and Tier-3 Mobile Network Operators |
| Mobile Virtual Network Operators (MVNOs) |
| Private Network Owners (Enterprises and Verticals) |
| Neutral Host Providers |
| North America | United States | |
| Canada | ||
| Mexico | ||
| South America | Brazil | |
| Argentina | ||
| Rest of South America | ||
| Europe | Germany | |
| United Kingdom | ||
| France | ||
| Italy | ||
| Spain | ||
| Russia | ||
| Rest of Europe | ||
| Asia-Pacific | China | |
| Japan | ||
| India | ||
| South Korea | ||
| Australia | ||
| Rest of Asia-Pacific | ||
| Middle East and Africa | Middle East | United Arab Emirates |
| Saudi Arabia | ||
| Turkey | ||
| Rest of Middle East | ||
| Africa | South Africa | |
| Egypt | ||
| Nigeria | ||
| Rest of Africa | ||
| By Component | Solutions | ||
| Services | |||
| By Network Layer | Radio Access Network (RAN) | ||
| Core Network | |||
| Transport Network | |||
| Edge Network | |||
| End-to-End Orchestration | |||
| By Deployment Mode | On-Premises | ||
| Cloud | |||
| Hybrid | |||
| By End User | Tier-1 Mobile Network Operators | ||
| Tier-2 and Tier-3 Mobile Network Operators | |||
| Mobile Virtual Network Operators (MVNOs) | |||
| Private Network Owners (Enterprises and Verticals) | |||
| Neutral Host Providers | |||
| By Geography | North America | United States | |
| Canada | |||
| Mexico | |||
| South America | Brazil | ||
| Argentina | |||
| Rest of South America | |||
| Europe | Germany | ||
| United Kingdom | |||
| France | |||
| Italy | |||
| Spain | |||
| Russia | |||
| Rest of Europe | |||
| Asia-Pacific | China | ||
| Japan | |||
| India | |||
| South Korea | |||
| Australia | |||
| Rest of Asia-Pacific | |||
| Middle East and Africa | Middle East | United Arab Emirates | |
| Saudi Arabia | |||
| Turkey | |||
| Rest of Middle East | |||
| Africa | South Africa | ||
| Egypt | |||
| Nigeria | |||
| Rest of Africa | |||


Key Questions Answered in the Report
What is the projected value of autonomous telecom networks in 2031?
The market is expected to reach USD 28.53 billion by 2031.
How fast will spending on autonomous telecom networks grow between 2026 and 2031?
Industry revenue is forecast to rise at a 20.18% CAGR over the period.
Which component category is expanding the quickest?
Services, driven by integration and managed-operations contracts, are advancing at a 22.02% CAGR.
Which region shows the strongest growth momentum?
Asia-Pacific is set to grow at a 23.52% CAGR through 2031, making it the fastest expanding region.
Why are enterprises investing in private 5G with AI automation?
Dedicated spectrum and AI-guaranteed quality enable sub-5-millisecond latency and near-perfect uptime for mission-critical workflows.
What main barrier restrains smaller operators from adopting autonomous networks?
High upfront investment for AI platforms and supporting compute infrastructure remains the most significant hurdle.
Page last updated on:


