Automatic Liquid Filling Machine Market Size and Share
Market Overview
| Study Period | 2019 - 2030 |
|---|---|
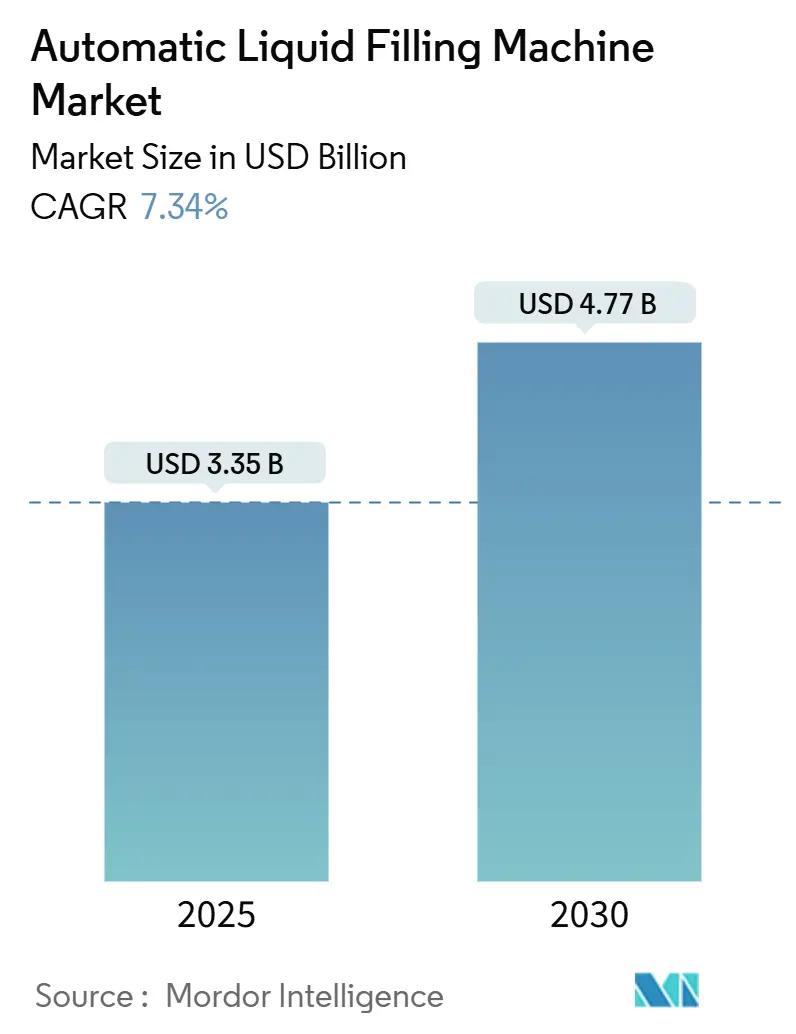
| Market Size (2025) | USD 3.35 Billion |
| Market Size (2030) | USD 4.77 Billion |
| Growth Rate (2025 - 2030) | 7.34% CAGR |
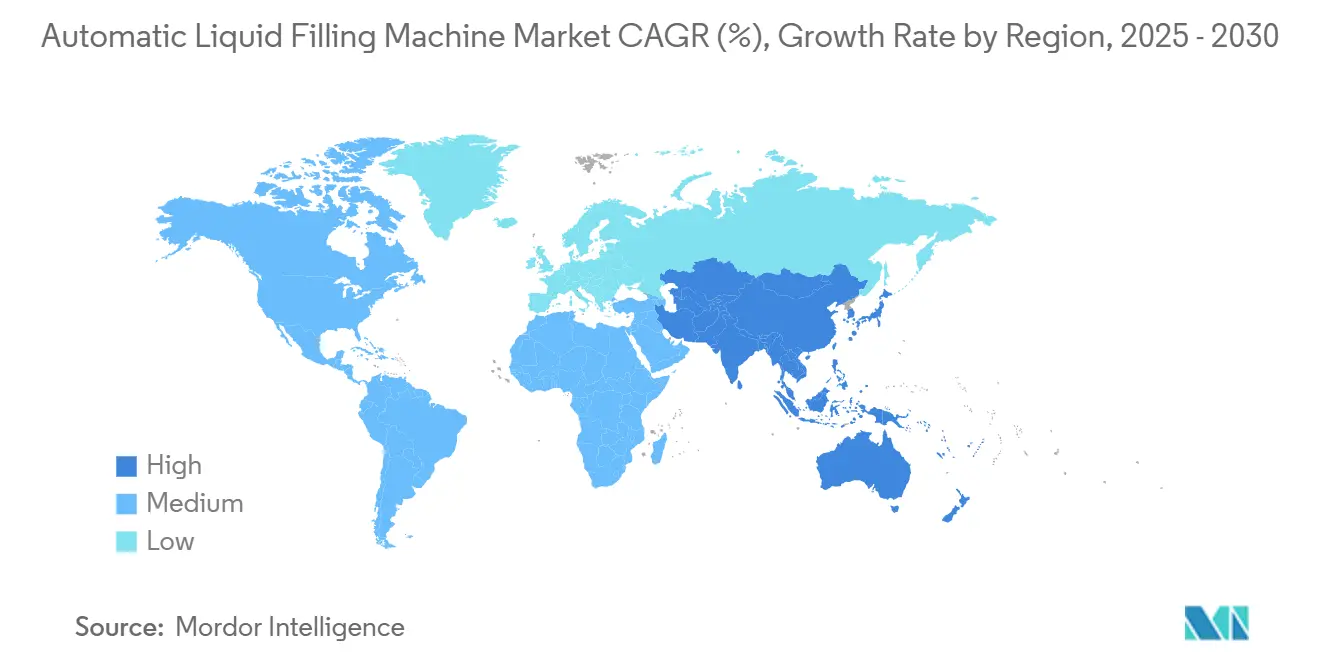
| Fastest Growing Market | Asia Pacific |
| Largest Market | North America |
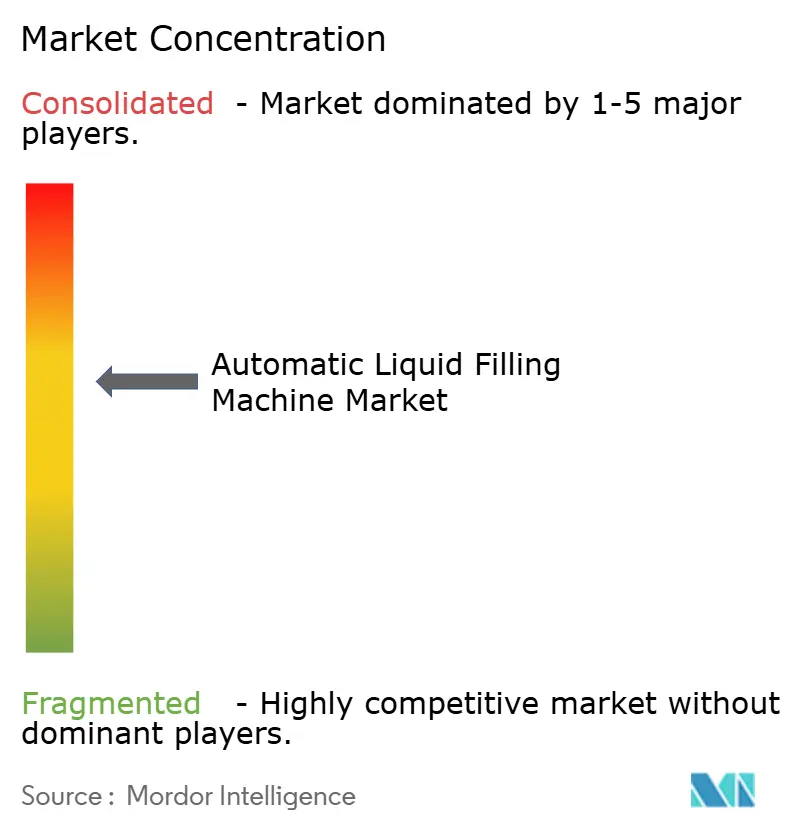
| Market Concentration | Medium |
Major Players *Disclaimer: Major Players sorted in no particular order Image © Mordor Intelligence. Reuse requires attribution under CC BY 4.0. | |
Automatic Liquid Filling Machine Market Analysis by Mordor Intelligence
The automatic liquid filling machine market size stands at USD 3.35 billion in 2025 and is projected to climb to USD 4.77 billion by 2030, delivering a 7.34% CAGR over the forecast period. Strong demand for high-speed, hygienic, and format-flexible filling solutions across beverages, pharmaceuticals, cosmetics, and industrial liquids keeps capital expenditure robust. Accelerated rollout of ready-to-drink products, stricter aseptic processing rules for biologics, and Industry 4.0 retrofits that trim unplanned downtime are the primary engines of revenue. Equipment makers are bundling remote diagnostics, digital twins, and predictive maintenance to reduce total cost of ownership, while sustainability mandates are nudging end users toward energy-efficient, low-waste fillers. Vendor strategies now revolve around modular upgrades that let processors add new SKUs or recycled-content packages without ripping out entire lines, keeping installed-base retention high and aftermarket parts sales healthy.
Key Report Takeaways
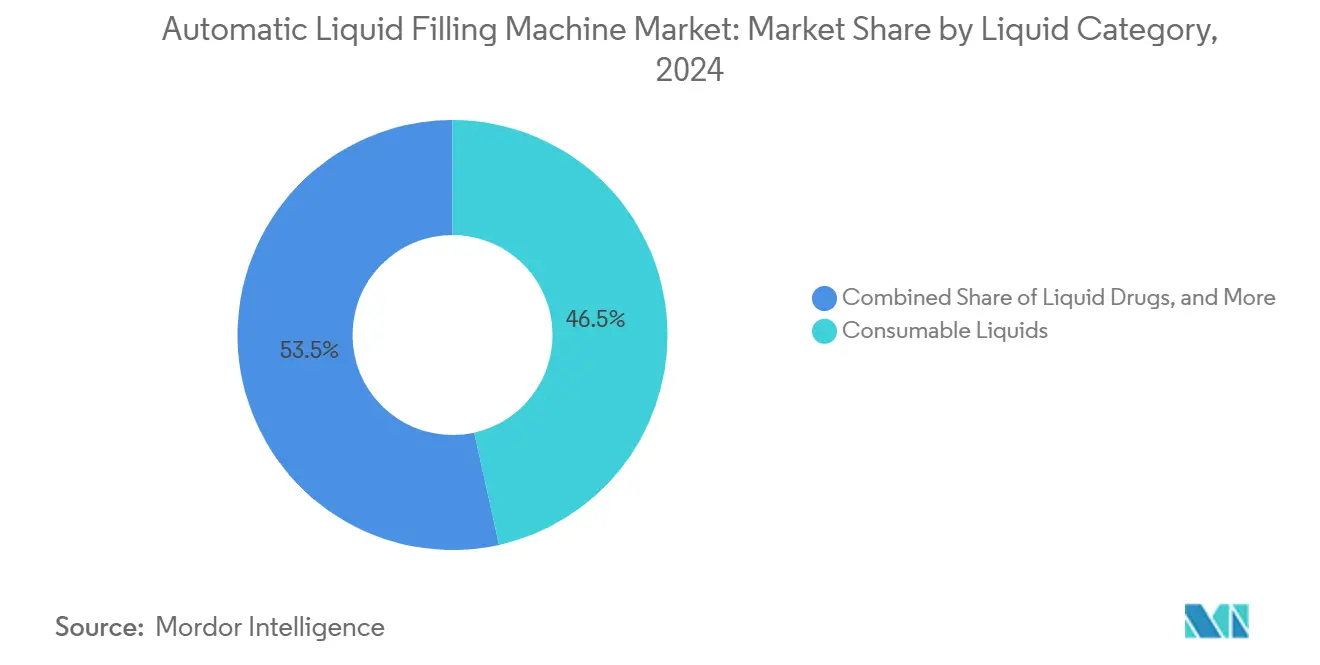
- By liquid category, consumable liquids held 46.53% of the automatic liquid filling machine market share in 2024, while liquid drugs are on track for an 8.32% CAGR through 2030.
- By filling variation, pressure-based systems retained the largest slice at 41.75% in 2024, yet viscosity-adapted fillers are forecast to expand at a 9.32% CAGR.
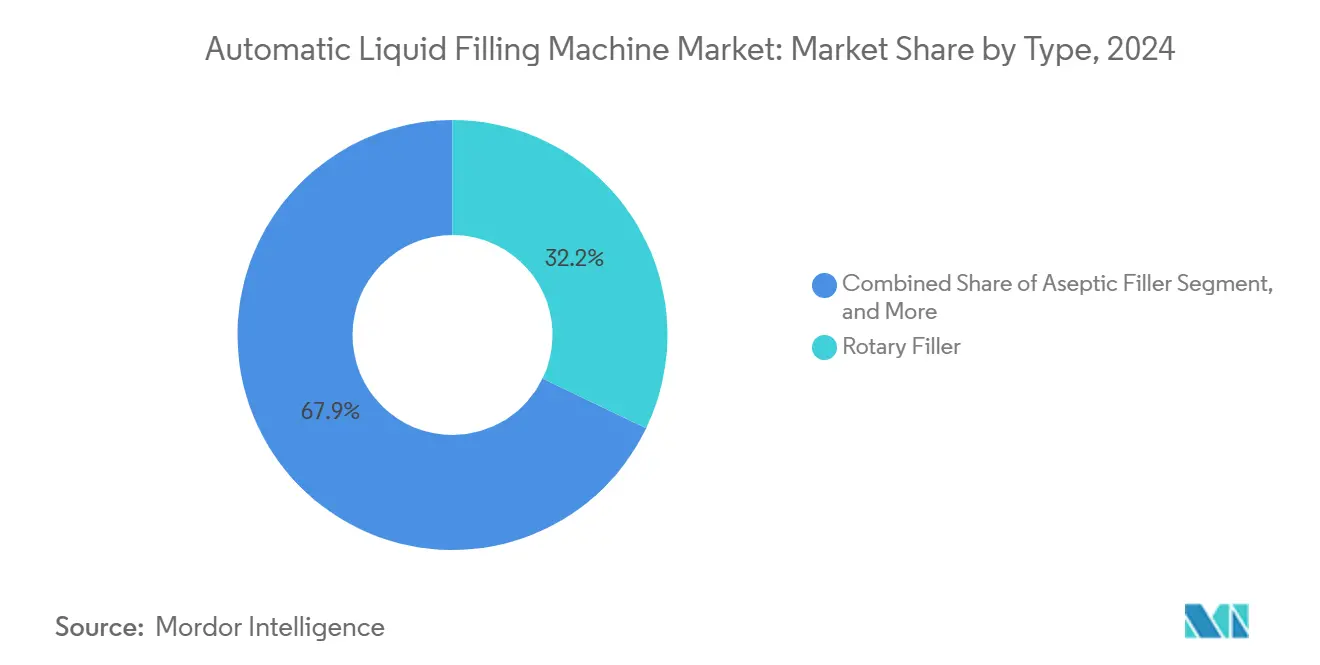
- By type, rotary fillers controlled 32.15% revenue in 2024, whereas aseptic fillers will lead growth at an 8.54% CAGR.
- By end-user industry, food and beverage captured 48.68% of 2024 turnover, but healthcare and pharmaceutical applications are expected to advance at a 9.73% CAGR.
- By geography, North America dominated with a 38.89% share in 2024, while Asia-Pacific is projected to post the fastest 10.15% CAGR through 2030.
Global Automatic Liquid Filling Machine Market Trends and Insights
Drivers Impact Analysis*
| Driver | (~) % Impact on CAGR Forecast | Geographic Relevance | Impact Timeline |
|---|---|---|---|
| Rising Consumption of Ready-To-Drink Beverages | +1.4% | Global, peak in Asia-Pacific and North America | Short term (≤ 2 years) |
| Rapid Expansion of Contract Packaging Services | +1.2% | North America, Europe, India | Medium term (2-4 years) |
| Migration Toward Industry 4.0 Enabled Filling Lines | +1.6% | Europe and North America, expanding to Asia-Pacific | Medium term (2-4 years) |
| Surge in Demand for Pharma-Grade Aseptic Filling | +1.5% | North America, Europe, China, India | Long term (≥ 4 years) |
| Emerging Single-Use Liquid Packaging Formats | +0.9% | North America and Europe pharmaceutical sectors | Medium term (2-4 years) |
| ESG-Driven Investments in Energy-Efficient Fillers | +0.7% | Europe, North America, growing in Asia-Pacific | Long term (≥ 4 years) |
| Source: Mordor Intelligence | |||
Rising Consumption of Ready-To-Drink Beverages
Single-serve juices, teas, and functional drinks require fillers that combine speed with exact dosing. Magnetic flow-meter rotary machines now top 1,200 bottles per minute with ±0.3% accuracy, shortening production cycles and reducing giveaway. Cold-fill aseptic technology enables ambient distribution while securing a microbial kill rate of 10⁻⁶, a performance that underpins equipment such as the A3 speed line, which completes 24,000 packs per hour. [1]Tetrapak, “A3/Speed High-Performance Line,” tetrapak.com Urbanization in the Asia-Pacific and health-driven product innovation in North America reinforce this shift in demand. Beverage brands use the automatic liquid filling machine market to introduce plant-based and low-sugar variants without sacrificing throughput.
Migration Toward Industry 4.0 Enabled Filling Lines
Connected sensors turn fillers into data hubs that feed predictive algorithms. A cloud-native platform streams cycle-time and torque metrics, enabling processors to preempt failures and increase overall equipment effectiveness above 85%. .[2]Syntegon, “Synexio Cloud Suite,” syntegon.comAI-aided capping systems spot skewed closures with 99.9% accuracy, trimming waste by nearly 15%. The initial wave took hold in Europe and the United States, where labor shortages sharpen the focus on uptime, but subsidized smart-factory programs in China and India are accelerating catch-up adoption.
Surge in Demand for Pharma-Grade Aseptic Filling
Biologics, monoclonal antibodies, and single-dose prefilled syringes require Grade A environments with barrier isolation. New aseptic monoblocks integrate robotic vial loading, hydrogen-peroxide vapor decontamination, and in-line particle inspection to meet EU GMP Annex 1 expectations. Large-volume fill-finish sites in the United States and Germany are adding parallel isolator cells to hedge against downtime, while vaccine producers in India secure export licenses by investing in compliant turnkey lines. This long-term driver steers the automatic liquid filling machine market toward higher average selling prices.
Rapid Expansion of Contract Packaging Services
Brand owners outsource fill-finish tasks to defer capex and accelerate new product rollouts. Aseptic co-packers that serve both food and pharma now demand quick-change machines capable of shifting between 10 mL vials and 1 L pouches in under 20 minutes. PCI Pharma Services allocated USD 365 million in 2024 to broaden such flexible capacity, underscoring the scale of outsourced opportunity. The trend is especially pronounced in India, where contract packagers supply multinational generics firms and specialty beverage brands alike.
Restraints Impact Analysis*
| Restraint | (~) % Impact on CAGR Forecast | Geographic Relevance | Impact Timeline |
|---|---|---|---|
| High Initial Capital Outlay | -0.8% | Global, acute in emerging markets and among SMEs | Short term (≤ 2 years) |
| Scarcity of Skilled Mechatronics Technicians | -0.6% | North America, Europe, developed Asia-Pacific | Medium term (2-4 years) |
| Persistent Cleanroom Validation Bottlenecks | -0.4% | North America, Europe, India | Medium term (2-4 years) |
| Volatility in Stainless Steel Prices | -0.3% | Global, supply chains in Asia and Europe | Short term (≤ 2 years) |
| Source: Mordor Intelligence | |||
High Initial Capital Outlay
A fully robotic aseptic line with isolators and electron-beam decontamination can exceed USD 5 million before facility retrofits. Pharmaceutical sites must also budget for HVAC upgrades, environmental monitoring, and validation batches that double the cash requirement. Small beverage start-ups often pivot to contract packers to sidestep these costs, delaying direct investment in the automatic liquid filling machine industry. Leasing and pay-per-fill models are emerging but remain niche outside North America.
Scarcity of Skilled Mechatronics Technicians
Modern fillers integrate PLCs, servo drives, vision inspection, and cybersecurity protocols, yet vocational pipelines remain underdeveloped. Aging workforces in the United States and Germany, coupled with tightening immigration policies, constrain onsite expertise. Equipment builders now bundle augmented-reality service kits and remote diagnostics, but these solutions hinge on reliable connectivity and cyber-hygiene that some plants still lack.[3]PCI Pharma Services, “Global Aseptic Expansion,” pci.comLabor scarcity, therefore, caps utilization rates and slows green-field adoptions, tempering short-term momentum.
*Our forecasts treat driver/restraint impacts as directional, not additive. The impact forecasts reflect baseline growth, mix effects, and variable interactions.
Segment Analysis
By Liquid Category: Liquid Drugs Outpace Consumables
Consumable liquids retained 46.53% of 2024 revenue thanks to beverages, dairy, and edible oils that rely on high-throughput fillers. Liquid drugs, however, are slated for the fastest 8.32% CAGR, driving premium demand in the automatic liquid filling machine market. Pharmaceutical lines require integrated isolators, electronic batch records, and 21 CFR Part 11 compliance, which push average selling prices well above those in beverage applications.
Manufacturers shifting from multi-dose vials to prefilled syringes now specify ±0.5% fill-weight tolerances and complete traceability. In response, suppliers offer servo-driven peristaltic pumps that cut product loss below 1.5%, a significant saving given biologics' values. Industrial liquids remain a steady but less dynamic outlet, while cosmetics gain share through e-commerce brands that demand rapid changeovers and viscosity control. The automatic liquid filling machine market benefits as lotions and serums require heated hoppers and vacuum dosing to eliminate trapped air in small containers.


By Filling Variation: Viscosity Adaptation Drives Innovation
Pressure-based fillers led with 41.75% share in 2024, thanks to water, juice, and beer lines that favor simplicity and speed. Yet viscosity-adapted machines are poised to register a 9.32% CAGR, reflecting rising demand for sauces, dressings, and high-value creams. Servo-controlled piston systems now automatically adjust stroke length to handle liquids from 50 cP to 10,000 cP without requiring mechanical adjustments.
Foam-control technology remains critical for carbonated beverages and certain suspensions. Counter-pressure fillers that limit oxygen ingress extend shelf life and cut product waste. A leading glass line can deliver up to 80,000 bottles per hour with dissolved oxygen levels below 30 ppb. By mastering both viscosity and carbonation challenges, vendors widen their installed base and futureproof equipment against SKU proliferation in the automatic liquid filling machine market.
By Type: Aseptic Fillers Lead Growth Amid Pharma Demand
Rotary fillers contributed 32.15% of the 2024 turnover, as their continuous motion is well-suited for handling large beverage volumes. Aseptic systems, however, are projected to grow at an 8.54% CAGR by 2030. These lines integrate hydrogen-peroxide vapor, HEPA filters, and robotics to maintain sterility while achieving 99.9% container decontamination. One electron-beam cap module reduces chemical use and fits within a 2-meter footprint, thereby lowering operating costs and utilities.
Volumetric and net-weight fillers continue to serve oils and detergents, but face slower growth as food and drug authorities tighten accuracy rules. Meanwhile, gear-pump and peristaltic designs retain a niche for shear-sensitive biologics, showcasing how diversification across filler types secures supplier resilience in the automatic liquid filling machine industry.
By End-User Industry: Healthcare and Pharmaceutical Segment Accelerates
Food and beverage lines accounted for 48.68% of 2024 demand, primarily due to legacy installations and a constant number of SKUs. The healthcare and pharmaceutical segment, although smaller, is forecast to have a 9.73% CAGR. Compliance-driven capital budgets favor isolator-equipped fillers capable of filling 200 vials per minute with in-line optical inspection, which rejects under-fills in milliseconds.
Cosmetic brands contribute incremental volumes by launching travel-size formats and refill systems that need rapid nozzle-height changes and gentle product handling. Household chemicals and lubricants stay flat as concentrated formulations reduce fill volumes, but they still underpin aftermarket parts revenue. Altogether, diverse end-user needs keep innovation pipelines active and sustain pricing power in the automatic liquid filling machine market.
Geography Analysis
North America commanded 38.89% of 2024 revenue, fueled by entrenched beverage bottlers and biologics manufacturers that demand validated, data-rich fillers. Real-time analytics boost overall equipment effectiveness above 80% and help satisfy FDA record-keeping rules. Upgrades focus on digital twins and energy-recapture modules that lower utility bills and support Scope 3 emissions goals.
Europe follows with strong sustainability pull from the EU Packaging and Packaging Waste Regulation, mandating 30% recycled content in plastic bottles by 2030. Machine builders must qualify fillers for containers with higher variability in wall thickness and rigidity, driving demand for adaptive torque control and non-contact vision inspection. Pharmaceutical hubs in Germany and Italy install Annex 1-compliant barrier isolators, reinforcing aseptic sales.
Asia-Pacific is the growth engine, tracking a 10.15% CAGR to 2030. China’s five-year plan incentivizes domestic vaccine capacity, sparking bulk orders for blow-fill-seal equipment. Indian contract packers add multi-format fillers that switch from 10 mL ampoules to 1 L condiment pouches, tying capex to export accreditation. Southeast Asian beverage localizers adopt compact, air-cooled rotary fillers suited for hot-fill teas and isotonic drinks. Collectively, rising capital spending in emerging markets offsets slower unit replacements in developed economies and underpins a broad addressable base for the automatic liquid filling machine market.

Competitive Landscape
The market exhibits moderate concentration. Syntegon’s 2024 acquisition of Telstar added freeze-dryers and vial loaders, enabling one-stop aseptic solutions. Meanwhile, Krones bundles blow-mold, fill, and cap modules to shorten commissioning timelines. GEA and JBT leverage cross-selling from thermal-processing equipment into fill-finish environments, expanding wallet share among existing customers.
Chinese suppliers Tech-Long and Zhongya gain ground by offering lower-priced monoblocks with servo redundancy and open-protocol PLCs. Their rapid customization appeals to mid-tier beverage and dairy firms that require 40,000-60,000 bottles per hour without European price tags. Meanwhile, retrofit specialists market sensor kits and torque-monitoring cappers that extend legacy lines to recycled-PET bottles.
Technology differentiation pivots on software. Cloud analytics platforms log cycle counts, maintenance events, and energy use, meeting EU Machinery Regulation 2023/1230 cybersecurity stipulations. Suppliers that embed encrypted data pipelines and role-based access entice risk-averse pharmaceutical buyers. Overall, rivalry hinges on who can balance capital cost, regulatory compliance, and sustainability in the automatic liquid filling machine market.
Automatic Liquid Filling Machine Industry Leaders
Syntegon Technology GmbH
Krones AG
JBT Corporation
Tetra Laval International SA
E-PAK Machinery Inc
- *Disclaimer: Major Players sorted in no particular order

Recent Industry Developments
- August 2025: Syntegon and Elopak showcased new hygienic and low-waste fillers at international expos, emphasizing automation upgrades and reduced utility consumption.
- March 2025: Zhongya Group presented its hydrogen-peroxide dry-sterilization bottle blow-fill-cap combi at CBST 2025, later selected by China’s Ministry of Industry and Information Technology as an advanced technology.
- January 2025: Scholle IPN installed the first SureFill 100P aseptic pouch filler at Wright Foods in North Carolina after receiving an FDA letter of non-objection, marking the debut of a pre-made sterilized spouted pouch system.
- October 2024: Hefei Zhongchen displayed a PET dry aseptic blow-fill-seal line and a 90,000 cph can filler at CBB 2024, drawing new business from Asia, Europe, and the Americas.


Global Automatic Liquid Filling Machine Market Report Scope
The Automatic Liquid Filling Machine Market encompasses equipment designed to accurately and efficiently fill various liquid products into containers, catering to diverse industries such as food and beverage, healthcare, pharmaceuticals, cosmetics, and chemicals. These machines are crucial in ensuring precision, minimizing waste, and maintaining product integrity during the filling process.
The Automatic Liquid Filling Machine Market Report is Segmented by Liquid Category (Consumable Liquids, Liquid Drugs, Industrial Liquids, Liquid Chemicals, Cosmetics, Other Liquid Categories), Filling Variation (Pressure, Viscosity, Foaming Characteristics), Type (Aseptic Filler, Rotary Filler, Volumetric Filler, Net Weight Filler, Piston Filler, Other Types), End-User Industry (Food and Beverage, Healthcare and Pharmaceutical, Cosmetics, Other End-User Industries), and Geography (North America, South America, Europe, Asia-Pacific, Middle East and Africa). The Market Forecasts are Provided in Terms of Value (USD).
| Consumable Liquids |
| Liquid Drugs |
| Industrial Liquids |
| Liquid Chemicals |
| Cosmetics |
| Other Liquid Catergories |
| Pressure |
| Viscosity |
| Foaming Characteristics |
| Aseptic Filler |
| Rotary Filler |
| Volumetric Filler |
| Net Weight Filler |
| Piston Filler |
| Other Types |
| Food and Beverage |
| Healthcare and Pharmaceutical |
| Cosmetics |
| Other End-User Industries |
| North America | United States | |
| Canada | ||
| Mexico | ||
| South America | Brazil | |
| Argentina | ||
| Chile | ||
| Rest of South America | ||
| Europe | United Kingdom | |
| Germany | ||
| France | ||
| Italy | ||
| Spain | ||
| Rest of Europe | ||
| Asia-Pacific | China | |
| Japan | ||
| India | ||
| South Korea | ||
| Australia and New Zealand | ||
| Rest of Asia-Pacific | ||
| Middle East and Africa | Middle East | United Arab Emirates |
| Saudi Arabia | ||
| Turkey | ||
| Rest of Middle East | ||
| Africa | South Africa | |
| Kenya | ||
| Nigeria | ||
| Rest of Africa | ||
| By Liquid Category | Consumable Liquids | ||
| Liquid Drugs | |||
| Industrial Liquids | |||
| Liquid Chemicals | |||
| Cosmetics | |||
| Other Liquid Catergories | |||
| By Filling Variation | Pressure | ||
| Viscosity | |||
| Foaming Characteristics | |||
| By Type | Aseptic Filler | ||
| Rotary Filler | |||
| Volumetric Filler | |||
| Net Weight Filler | |||
| Piston Filler | |||
| Other Types | |||
| By End-User Industry | Food and Beverage | ||
| Healthcare and Pharmaceutical | |||
| Cosmetics | |||
| Other End-User Industries | |||
| By Geography | North America | United States | |
| Canada | |||
| Mexico | |||
| South America | Brazil | ||
| Argentina | |||
| Chile | |||
| Rest of South America | |||
| Europe | United Kingdom | ||
| Germany | |||
| France | |||
| Italy | |||
| Spain | |||
| Rest of Europe | |||
| Asia-Pacific | China | ||
| Japan | |||
| India | |||
| South Korea | |||
| Australia and New Zealand | |||
| Rest of Asia-Pacific | |||
| Middle East and Africa | Middle East | United Arab Emirates | |
| Saudi Arabia | |||
| Turkey | |||
| Rest of Middle East | |||
| Africa | South Africa | ||
| Kenya | |||
| Nigeria | |||
| Rest of Africa | |||


Key Questions Answered in the Report
What is the projected revenue of the automatic liquid filling machine market by 2030?
The market is forecast to reach USD 4.77 billion by 2030, rising from USD 3.35 billion in 2025.
Which region will record the fastest growth in automatic liquid filling equipment between 2025 and 2030?
Asia-Pacific will post the quickest expansion with a 10.15% CAGR, driven by pharmaceutical and beverage capex.
Why are viscosity-adapted fillers gaining attention among food processors?
They automatically adjust flow parameters to handle thick sauces and creams, supporting SKU variety without manual tweaks.
How are sustainability regulations influencing new filler purchases in Europe?
Rules mandating recycled-content packaging and machinery energy efficiency push buyers toward adaptive torque control and low-waste CIP systems.
What is the main barrier preventing small firms from adopting advanced aseptic fillers?
High initial capital outlay exceeding USD 5 million, coupled with additional facility upgrades, makes ownership challenging for SMEs.
Which end-user sector will show the strongest CAGR in filler demand through 2030?
Healthcare and pharmaceutical applications will advance at 9.73% CAGR as biologics and prefilled syringe volumes expand.
Page last updated on:


