Automated Visual Field Analyzer Market Size and Share
Market Overview
| Study Period | 2020 - 2031 |
|---|---|
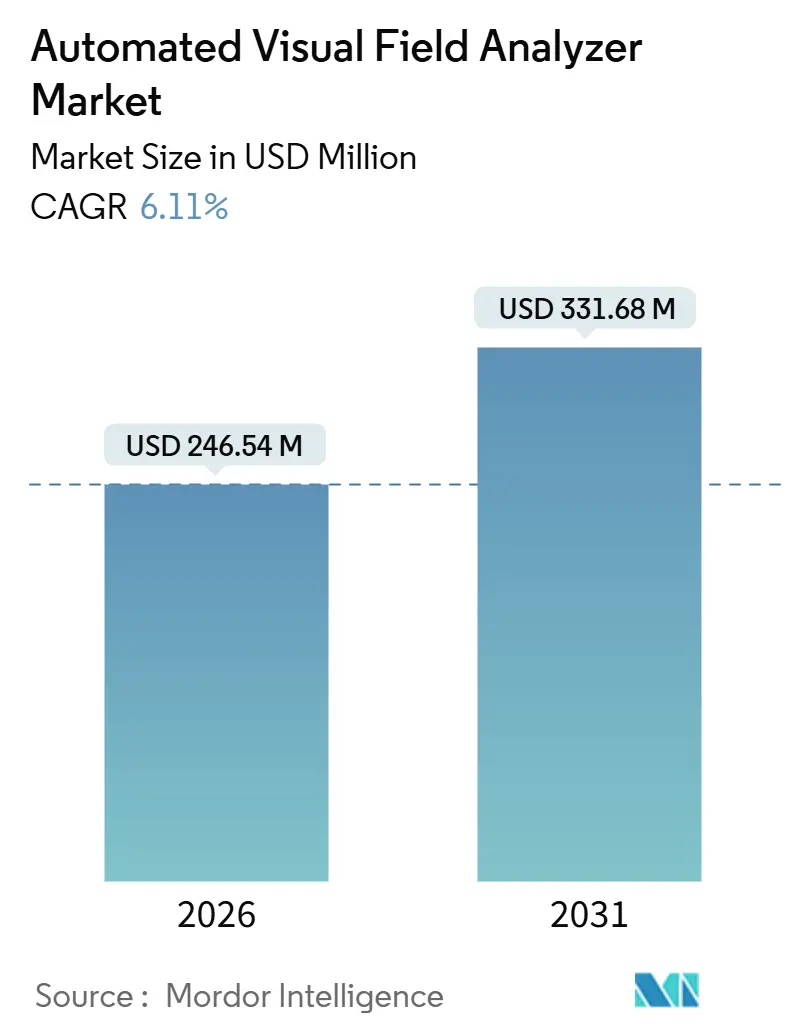
| Market Size (2026) | USD 246.54 Million |
| Market Size (2031) | USD 331.68 Million |
| Growth Rate (2026 - 2031) | 6.11% CAGR |
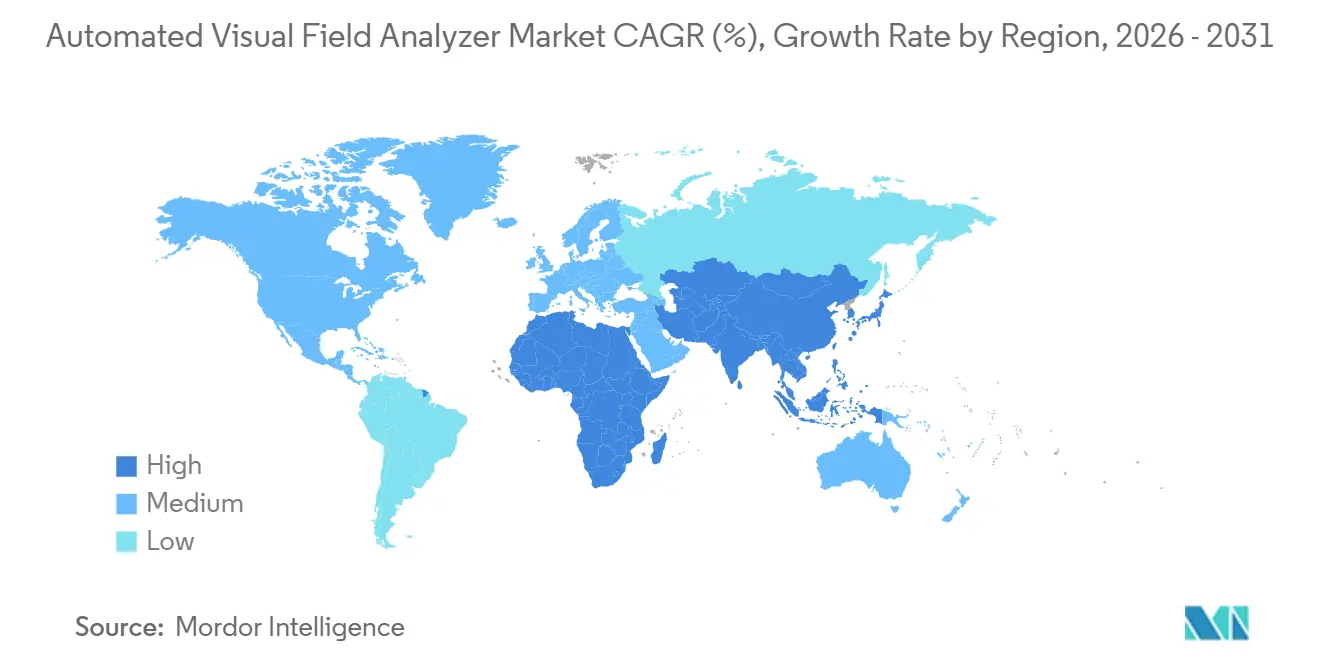
| Fastest Growing Market | Asia Pacific |
| Largest Market | North America |
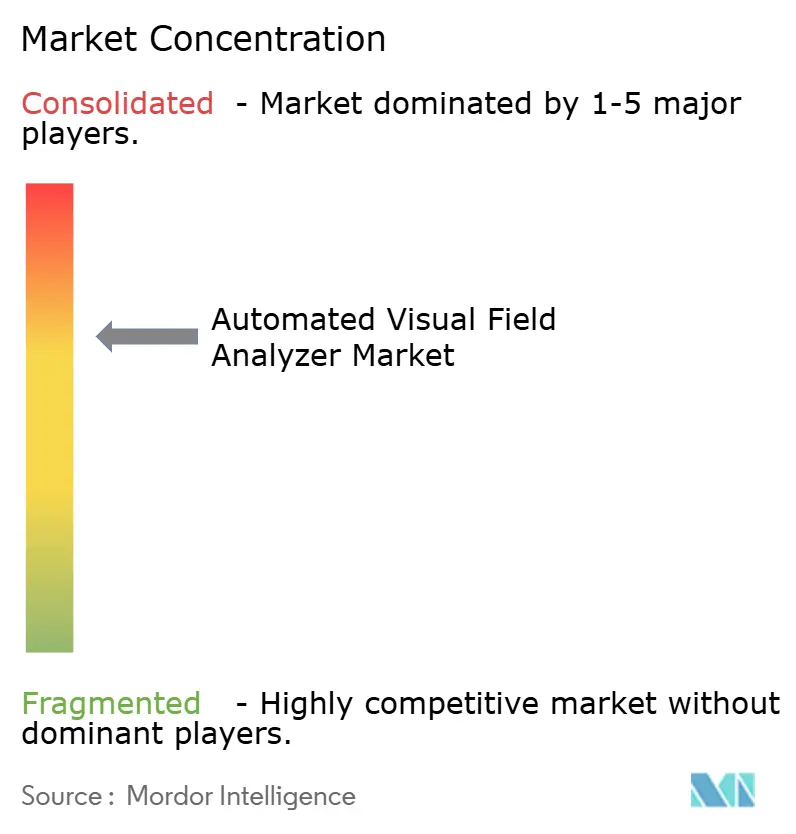
| Market Concentration | Medium |
Major Players *Disclaimer: Major Players sorted in no particular order Image © Mordor Intelligence. Reuse requires attribution under CC BY 4.0. | |
Automated Visual Field Analyzer Market Analysis by Mordor Intelligence
The Automated Visual Field Analyzer Market size is estimated at USD 246.54 million in 2026, and is expected to reach USD 331.68 million by 2031, at a CAGR of 6.11% during the forecast period (2026-2031).
Growth remains steady because reimbursement stability and clinical-validation cycles drive purchasing decisions more than raw unit volumes. Momentum is shifting from traditional tabletop perimeters toward portable, subscription-based VR headsets, enabling clinics to test more patients without building dark rooms. Static analyzers still dominate installed bases, yet neurological protocols that need dynamic isopter mapping are giving kinetic platforms fresh relevance. Vendors that combine AI algorithms with eye-tracking shorten test times by 2–4 minutes, freeing scarce technician hours. North America leads revenue today, but Asia-Pacific is delivering the fastest expansion as China and India embed perimetry into driver-vision and diabetic screening policies.
Key Report Takeaways
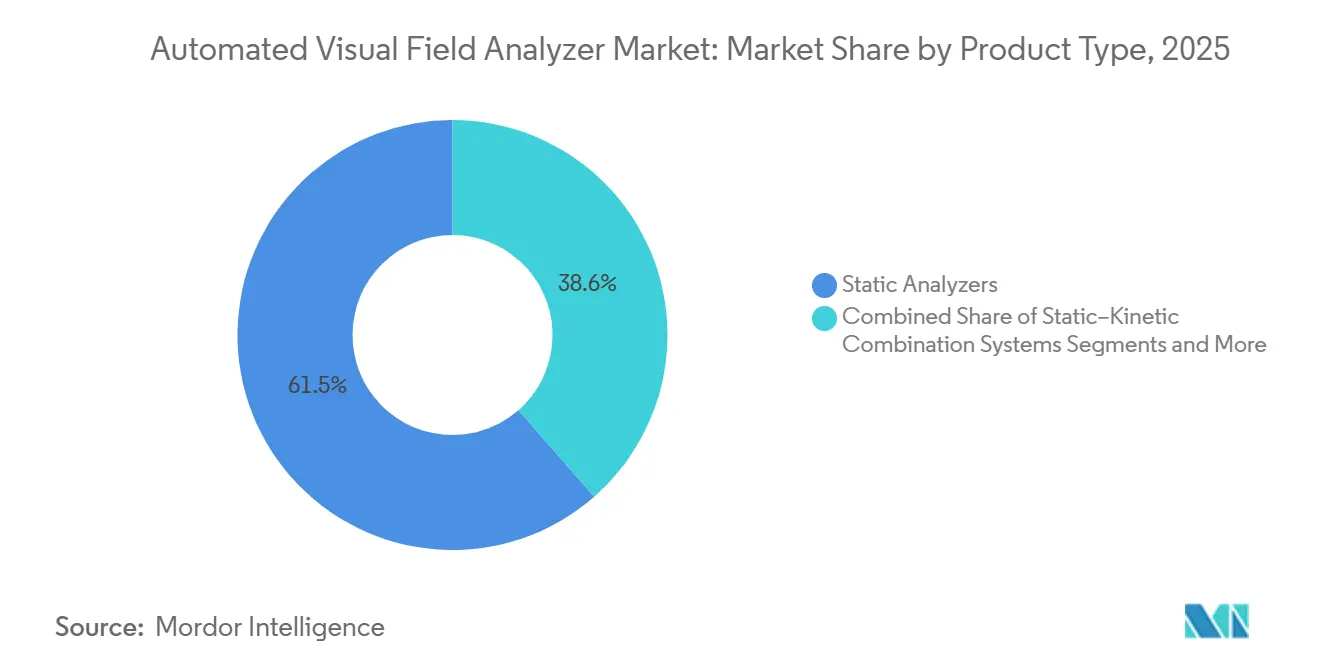
- By Product Type, Static analyzers led with 61.45% revenue share in 2025, while kinetic analyzers are forecast to expand at an 8.36% CAGR through 2031.
- By Application, Glaucoma diagnosis accounted for 69.32% of application revenue in 2025; neurological disorder assessment holds the highest projected CAGR at 8.73% to 2031.
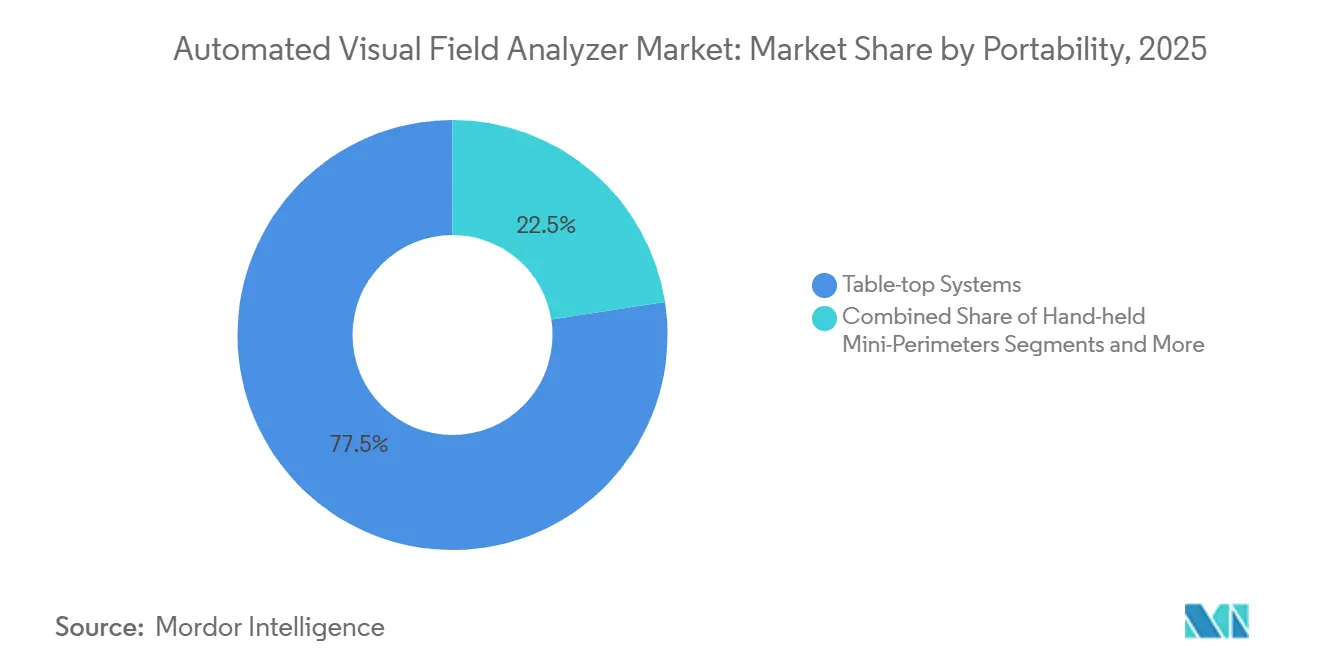
- By Portability, Table-top systems commanded 77.46% of portability revenue in 2025, yet head-mounted and VR perimeters are advancing at a 9.68% CAGR.
- By technology platform, Standard automated perimetry captured 54.26% of 2025 technology-platform share; eye-tracking and objective perimetry are growing at 9.52% CAGR.
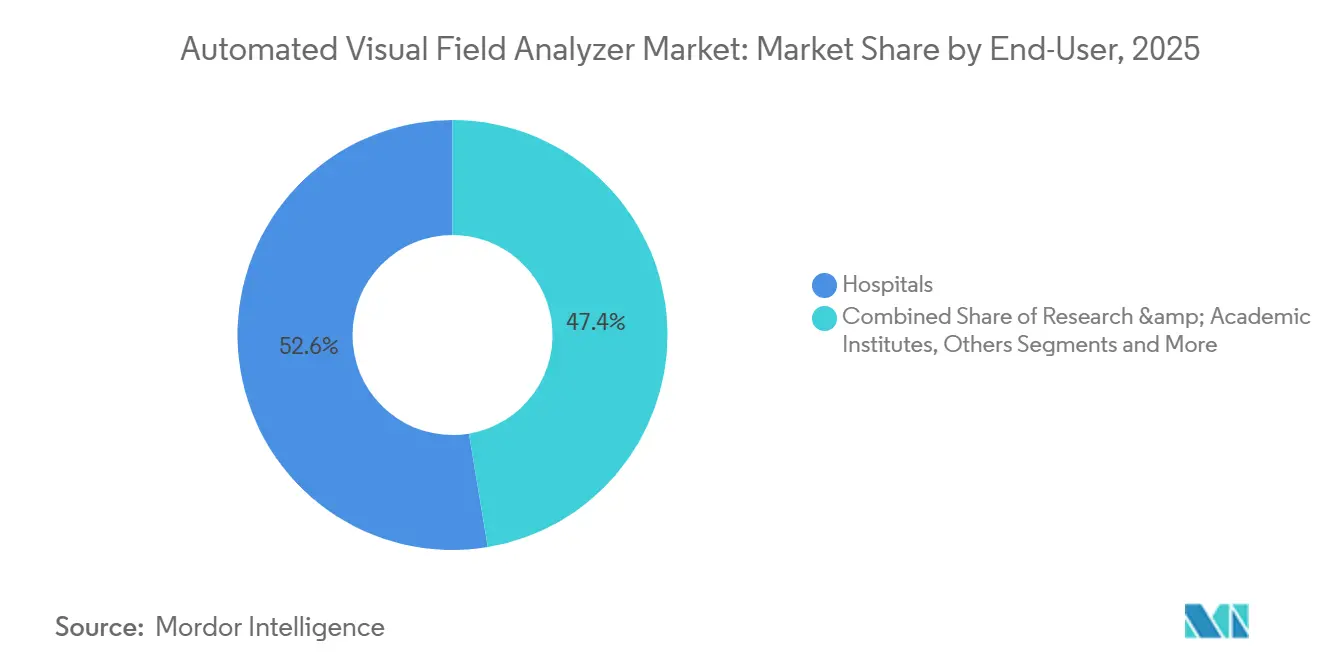
- By end user, hospitals held 52.63% of end-user revenue in 2025, whereas ophthalmic clinics and eye-care chains are rising at an 8.57% CAGR.
- By geography, North America controlled 37.33% of 2025 revenue, but Asia-Pacific is projected to grow at an 8.88% CAGR through 2031.
Note: Market size and forecast figures in this report are generated using Mordor Intelligence’s proprietary estimation framework, updated with the latest available data and insights as of January 2026.
Global Automated Visual Field Analyzer Market Trends and Insights
Drivers Impact Analysis*
| Driver | (~) % Impact on CAGR Forecast | Geographic Relevance | Impact Timeline |
|---|---|---|---|
| Rising Prevalence of Glaucoma & Ocular Diseases | +0.8% | Global, strong in North America, Europe, urban Asia-Pacific | Long term (≥ 4 years) |
| Aging Population Spurring Routine Eye Exams | +0.9% | Europe, Japan, North America, emerging in China, South Korea | Long term (≥ 4 years) |
| AI-Enabled Automated Perimetry Accuracy Gains | +0.7% | North America, Europe, early APAC pilots | Medium term (2–4 years) |
| VR-Based Portable Perimeters for Mass Screening | +0.6% | Global, early uptake in North America, select APAC | Medium term (2–4 years) |
| Subscription-Based Device-as-a-Service Models | +0.5% | North America, Europe, gradual in Latin America, MEA | Short term (≤ 2 years) |
| Stricter Driver-Vision Regulations | +0.4% | India, China, ASEAN, Latin America, MEA | Medium term (2–4 years) |
| Source: Mordor Intelligence | |||
Rising Prevalence of Glaucoma & Ocular Diseases
Glaucoma remains the leading irreversible cause of blindness, so automated perimetry is essential to detect field loss before optic-nerve damage sets in. Updated screening guidelines now recommend baseline tests for at-risk adults starting at age 40, increasing the number of exams performed in primary-care settings. As a result, clinics want faster, easier-to-use perimeters that fit smaller rooms and can be operated by general ophthalmic staff. The dominance of glaucoma in perimetry workflows explains why 69.32% of 2025 application revenue came from this indication. Vendors therefore bundle glaucoma-specific protocols and progression analysis software to lock in device loyalty.[1]ZEISS Medical Technology, “Humphrey Perimeters,” zeiss.com
Aging Population Spurring Routine Eye Exams
One of every four residents in Europe and Japan is at least 65 years old, and this group needs regular visual-field checks to manage age-related diseases. The United Kingdom’s national health service added visual-field assessments to its diabetic retinopathy program in 2024, raising device demand in community clinics.[2]National Health Service, “NHS Diabetic Eye Screening Programme,” nhs.uk China’s Healthy China 2030 initiative calls for routine eye exams for seniors, but the country faces technician shortages, which favors perimeters with self-guided workflows. South Korea now reimburses visual-field testing for adults over 60 who have a family history of glaucoma, a policy introduced in 2025 that is lifting system installations across major cities.
AI-Enabled Automated Perimetry Accuracy Gains
Artificial-intelligence software now adapts stimulus intensity on the fly and flags unreliable tests before staff must repeat them. A 2025 ARVO study showed that Virtual Field’s BOLT algorithm achieved correlation coefficients of 0.65–0.74 against Humphrey SITA-Standard and cut test time by 2.4 minutes on average. Eye-tracking platforms that monitor fixation in real time are eliminating operator-dependent variability. Reduced retest rates translate into 15–20% more billable exams per technician hour, which is compelling for busy clinics facing labor shortages. Regulatory bodies still require large validation datasets, yet early adopters report smoother reimbursement audits because AI reduces false positives.
VR-Based Portable Perimeters for Mass Screening
Head-mounted perimeters remove the need for dedicated dark rooms and can be taken into mobile vans or even patient homes. Virtual Field’s VF3 Pro supports 14 test patterns and rents for USD 359 per month, replacing several tabletop instruments and accelerating return on investment. iCare’s COMPASS unit integrates retinal tracking, making it easier for elderly or neurologically impaired patients to complete exams. India’s national blindness program is piloting VR headsets in 50 rural districts, proving that portability can expand access where transport to urban tertiary centers is difficult.
Restraints Impact Analysis*
| Restraint | (~) % Impact on CAGR Forecast | Geographic Relevance | Impact Timeline |
|---|---|---|---|
| High Capital & Maintenance Costs | −0.6% | Global, most acute in price-sensitive APAC, Latin America, MEA | Short term (≤ 2 years) |
| Shortage of Skilled Perimetry Technicians | −0.5% | Global, severe in rural APAC, MEA, Latin America | Long term (≥ 4 years) |
| OCT Devices Cannibalizing Budgets | −0.7% | North America, Europe, emerging urban APAC | Medium term (2–4 years) |
| Data-Privacy & Cybersecurity Hurdles | −0.4% | Europe, North America, rising in APAC | Medium term (2–4 years) |
| Source: Mordor Intelligence | |||
High Capital & Maintenance Costs
Humphrey Field Analyzer 3 systems cost up to USD 35,000, and five-year ownership can exceed USD 50,000 when service contracts are included. Community clinics with tight budgets often choose used devices, but these carry risks such as calibration drift and outdated software. Low-cost Chinese perimeters are entering the market, yet concerns about build quality and liability slow adoption in regulated regions.
Shortage of Skilled Perimetry Technicians
The U.S. Department of Veterans Affairs requires certified personnel for visual-field testing, and similar credential gaps exist worldwide.[3]U.S. Department of Veterans Affairs, “Health Technician Qualification Standard,” va.gov In India and China, formal technician programs are scarce and turnover is high. Self-guided perimeters ease the burden, but complex neurological or pediatric cases still need human expertise. Integrating perimetry modules into nursing and optometry curricula could help, though professional turf issues delay progress.
*Our forecasts treat driver/restraint impacts as directional, not additive. The impact forecasts reflect baseline growth, mix effects, and variable interactions.
Segment Analysis
By Product Type: Kinetic Gains on Static's Goldmann Legacy
Static analyzers held 61.45% of 2025 revenue, reflecting decades of normative data that anchor glaucoma management within the automated visual field analyzer market share. Kinetic analyzers are climbing at an 8.36% CAGR because neurologists need wide-field isopter mapping for stroke and multiple-sclerosis cases. The shift is pushing mixed static-kinetic platforms into academic centers that want both modalities without adding devices. VR headsets that merge static, kinetic, and Esterman protocols are also capturing attention because they eliminate floor-space constraints.
VR and head-mounted units, the fastest-growing product category at 9.68% CAGR, reduce installation costs and shorten exams, making them attractive to mobile screening programs. The automated visual field analyzer market size for portable devices is projected to expand quickly as subscription pricing removes upfront barriers. Still, long-term adoption hinges on building validation datasets that match the 35-year evidence base of the Humphrey family, a hurdle that new entrants must clear to win glaucoma specialists’ trust.


By Application: Neurological Assessment Outpaces Glaucoma's Mature Base
Glaucoma diagnosis produced 69.32% of 2025 application revenue, cementing its central role in the automated visual field analyzer market. Yet neurological assessments are projected to grow 8.73% per year because stroke-rehabilitation guidelines require visual-field checks for driving clearance. The U.S. Veterans Affairs standard explicitly lists kinetic perimetry for neurological cases, signaling broader adoption across rehabilitation centers.
Vendors now design perimeters with flexible protocols so clinics can switch between static threshold and Goldmann kinetic exams. This versatility supports occupational-health testing under new driver-vision rules in India and China. As a result, the automated visual field analyzer market size for neurological applications is expected to widen its share, even though glaucoma remains the volume anchor.
By Portability: VR Headsets Chip Away at Tabletop Dominance
Tabletop systems controlled 77.46% of 2025 portability revenue, anchored by hospital procurement norms. Head-mounted and VR units are advancing at 9.68% CAGR because they enable simultaneous testing on multiple chairs and remove the need for dark rooms. Subscription plans starting at USD 179 per month appeal to independent clinics that cannot justify large capital purchases.
Hybrid workflows are emerging where baseline exams stay on legacy tabletop systems, while follow-ups migrate to VR headsets. Interoperability software such as Haag-Streit’s EyeSuite links data across devices, ensuring that clinicians track progression on a single dashboard. Practices adopting this dual-device model report higher throughput without sacrificing diagnostic rigor.
By Technology Platform: Eye-Tracking Disrupts SAP’s Threshold Hegemony
Standard automated perimetry held 54.26% of platform share in 2025, symbolizing its deep roots in glaucoma care. Eye-tracking and objective perimetry are growing at 9.52% CAGR, promising fewer fixation losses and briefer exams. Virtual Field’s BOLT algorithm shaved more than two minutes off test time while matching Humphrey accuracy, winning early adopters in high-volume sites.
Regulators are accelerating AI clearances under the FDA 510(k) pathway, hinting that adaptive stimulus engines will soon be standard. The automated visual field analyzer industry now sees a convergence of static, kinetic, and objective methods, making single-feature differentiation harder and pushing vendors to compete on workflow integration and service support.
By End-User: Clinics Gain on Hospitals via Subscription Economics
Hospitals generated 52.63% of 2025 revenue because they leverage group purchasing and engineering teams to maintain devices. Clinics are expanding at an 8.57% CAGR, aided by payers that reimburse field tests equally regardless of location. The automated visual field analyzer market size among clinics is rising as subscription finance eliminates balance-sheet strain.
Private equity-backed chains that roll out standardized equipment across new sites favor VR headsets with lifetime warranties and cloud sync. Academic institutes seek raw-data export for research, prompting vendors like Haag-Streit to offer customizable protocols. Vendors that tailor sales models to each end-user type—purchase, lease, or subscription—are capturing stronger share.
Geography Analysis
North America accounted for 37.33% of 2025 revenue, driven by the U.S. Veterans Affairs system, stable reimbursement of CPT 92081-83, and a well-trained technician pool. The region favors premium tabletop analyzers but is also piloting AI platforms to cut retests. Canada benefits from provincial insurance expansion, while Mexico sees cross-border patient flows that fill private clinics.
Asia-Pacific is forecast to achieve an 8.88% CAGR, the fastest worldwide. China’s 2025 driver-vision mandate and India’s rural screening pilots are key accelerants. Low-cost kinetic units and VR headsets meet the need for high throughput in resource-constrained settings. Japan’s aging society and South Korea’s reimbursement changes reinforce steady demand for premium devices with objective perimetry modules.
Europe retains stable growth anchored by diabetic eye programs and high ophthalmologist density. Budget pressure pushes public hospitals toward refurbished equipment, though the United Kingdom’s expanded retinopathy screening created fresh orders in 2024. The Middle East and Africa lag due to infrastructure gaps, yet Gulf states invest in tertiary centers. South America remains volatile but gains incremental volume from Brazil’s 2024 driver-vision rule.

Competitive Landscape
The automated visual field analyzer market shows moderate concentration. Carl Zeiss Meditec’s Humphrey series sets the gold standard and commands premium pricing of USD 28,000–35,000 per unit plus service contracts. Haag-Streit’s Octopus and OCULUS’s Smartfield hold regional niches, while VR innovators such as Virtual Field, Olleyes, and Heru target portability and subscription economics. Zeiss acquired Dutch Ophthalmic Research Center in 2024 to integrate perimetry with its surgical portfolio.
Incumbents answer the VR threat with faster algorithms and bundled diagnostic suites, though this risks commoditizing perimetry. Chinese manufacturers pursue a low-price, high-volume play in driver-vision testing, reshaping emerging markets. Competitive intensity is highest in North America and Europe due to stable reimbursement, while Asia-Pacific remains fragmented across domestic brands and distributors. Long-term success will hinge on building peer-reviewed validation databases and flexible pricing models that resonate with both hospitals and clinic chains.
Automated Visual Field Analyzer Industry Leaders
Carl Zeiss Meditec AG
NIDEK Co. Ltd.
OCULUS Optikgeräte GmbH
Topcon Corporation
Haag-Streit Group
- *Disclaimer: Major Players sorted in no particular order

Recent Industry Developments
- October 2025: Konan Medical secured CE marking for its objective FIELD Analyzer, enabling European distribution.
- October 2025: Virtual Field announced more than 4 million completed visual-field exams, the largest dataset in VR perimetry history.
- November 2024: Konan Medical began commercial sales of its objective FIELD analyzer in the United States, introducing pupillary-response perimetry to routine practice.


Global Automated Visual Field Analyzer Market Report Scope
An Automated Visual Field Analyzer is a computerized device in ophthalmology that maps a patient’s vision, measures peripheral vision, and detects blind spots to diagnose and monitor eye and neurological conditions.
The Automated Visual Field Analyzer Market Report is segmented by Product Type, Application, Portability, Technology Platform, End User, and Geography. By Product Type, the market is segmented into Static Analyzers, Kinetic Analyzers, Static-Kinetic Combination Systems, and VR/Head-mounted Portable Perimeters. By Application, the market is segmented into Glaucoma Diagnosis, Age-related Macular Degeneration, Neurological Disorder Assessment, Scotoma & Visual Pathway Defects, and Others. By Portability, the market is segmented into Table-top Systems, Head-mounted/VR Perimeters, and Hand-held Mini-Perimeters. By Technology Platform, the market is segmented into Standard Automated Perimetry, Frequency-Doubling Technology, Short-Wavelength Automated Perimetry, and Eye-Tracking/Objective Perimetry. By End User, the market is segmented into Hospitals, Ophthalmic Clinics & Eye-Care Chains, Research & Academic Institutes, and Others. By Geography, the market is segmented into North America, Europe, Asia-Pacific, Middle East & Africa, and South America. The market report also covers the estimated market sizes and trends across major regions globally. Market Forecasts are Provided in Terms of Value (USD).
| Static Analyzers |
| Kinetic Analyzers |
| Static–Kinetic Combination Systems |
| VR / Head-mounted Portable Perimeters |
| Glaucoma Diagnosis |
| Age-related Macular Degeneration |
| Neurological Disorder Assessment |
| Scotoma & Visual Pathway Defects |
| Others |
| Table-top Systems |
| Head-mounted / VR Perimeters |
| Hand-held Mini-Perimeters |
| Standard Automated Perimetry (SAP) |
| Frequency-Doubling Technology (FDT) |
| Short-Wavelength Automated Perimetry (SWAP) |
| Eye-Tracking / Objective Perimetry |
| Hospitals |
| Ophthalmic Clinics & Eye-Care Chains |
| Research & Academic Institutes |
| Others |
| North America | United States |
| Canada | |
| Mexico | |
| Europe | Germany |
| France | |
| United Kingdom | |
| Italy | |
| Spain | |
| Rest of Europe | |
| Asia-Pacific | China |
| Japan | |
| India | |
| South Korea | |
| Australia | |
| Rest of Asia-Pacific | |
| Middle East & Africa | GCC |
| South Africa | |
| Rest of Middle East & Africa | |
| South America | Brazil |
| Argentina | |
| Rest of South America |
| By Product Type | Static Analyzers | |
| Kinetic Analyzers | ||
| Static–Kinetic Combination Systems | ||
| VR / Head-mounted Portable Perimeters | ||
| By Application | Glaucoma Diagnosis | |
| Age-related Macular Degeneration | ||
| Neurological Disorder Assessment | ||
| Scotoma & Visual Pathway Defects | ||
| Others | ||
| By Portability | Table-top Systems | |
| Head-mounted / VR Perimeters | ||
| Hand-held Mini-Perimeters | ||
| By Technology Platform | Standard Automated Perimetry (SAP) | |
| Frequency-Doubling Technology (FDT) | ||
| Short-Wavelength Automated Perimetry (SWAP) | ||
| Eye-Tracking / Objective Perimetry | ||
| By End-User | Hospitals | |
| Ophthalmic Clinics & Eye-Care Chains | ||
| Research & Academic Institutes | ||
| Others | ||
| By Geography | North America | United States |
| Canada | ||
| Mexico | ||
| Europe | Germany | |
| France | ||
| United Kingdom | ||
| Italy | ||
| Spain | ||
| Rest of Europe | ||
| Asia-Pacific | China | |
| Japan | ||
| India | ||
| South Korea | ||
| Australia | ||
| Rest of Asia-Pacific | ||
| Middle East & Africa | GCC | |
| South Africa | ||
| Rest of Middle East & Africa | ||
| South America | Brazil | |
| Argentina | ||
| Rest of South America | ||


Key Questions Answered in the Report
What is the current size of the automated visual field analyzer market?
The market stands at USD 246.54 million in 2026 and is projected to reach USD 331.68 million by 2031.
Which segment is expanding fastest within automated visual field analyzers?
Head-mounted and VR perimeters are growing at a 9.68% CAGR thanks to subscription pricing and portability.
How are driver-vision regulations affecting demand?
New rules in India, China, and Brazil require visual-field tests for many drivers, creating a separate high-throughput market for rugged analyzers.
Why are clinics adopting subscription models?
Monthly payments of USD 179–359 include warranty and updates, removing large upfront costs and allowing flexible scaling.
What competitive edge do AI-enabled perimeters offer?
AI reduces false positives and shortens exam time by up to 2.4 minutes, letting clinics bill more exams per technician hour.
Page last updated on:


