Automated Microscopy Market Size and Share
Market Overview
| Study Period | 2020 - 2031 |
|---|---|
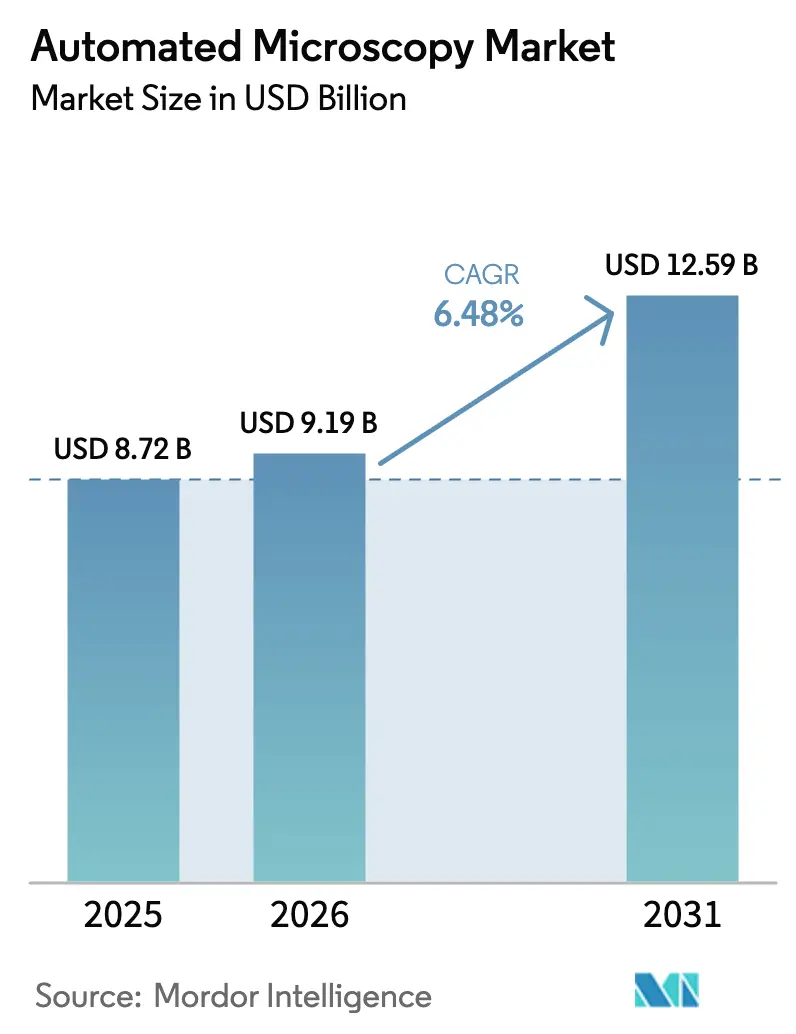
| Market Size (2026) | USD 9.19 Billion |
| Market Size (2031) | USD 12.59 Billion |
| Growth Rate (2026 - 2031) | 6.48% CAGR |
| Fastest Growing Market | Asia Pacific |
| Largest Market | North America |
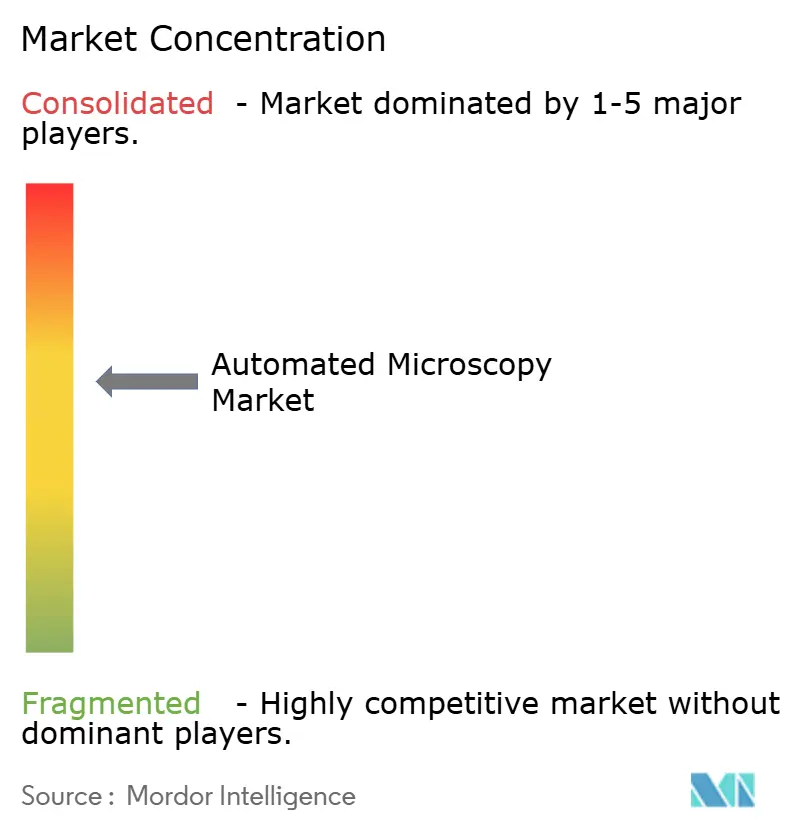
| Market Concentration | Medium |
Major Players *Disclaimer: Major Players sorted in no particular order Image © Mordor Intelligence. Reuse requires attribution under CC BY 4.0. | |
Automated Microscopy Market Analysis by Mordor Intelligence
The Automated Microscopy Market size is projected to be USD 8.72 billion in 2025, USD 9.19 billion in 2026, and reach USD 12.59 billion by 2031, growing at a CAGR of 6.48% from 2026 to 2031.
Momentum comes from pharmaceutical companies folding AI image-classifiers into high-throughput screening, trimming compound-triage cycles from weeks to mere hours. Synthetic images produced by diffusion models are cutting annotation budgets by 70% while sustaining diagnostic accuracies above 95% in oncology and neurodegenerative assays. Near-shoring of optical-component production in North America and Europe now shortens custom objective-lens lead times from 16 weeks to under 6 weeks, shielding laboratories from Asia-Pacific logistics disruptions. Capital expenditure is further justified as live-cell platforms enable continuous organoid monitoring, a capability that fixed-cell workflows cannot match. Together, these forces channel fresh investment toward edge-compute systems that satisfy new data-sovereignty rules in Europe and accelerate semiconductor defect-inspection in Asia.
Key Report Takeaways
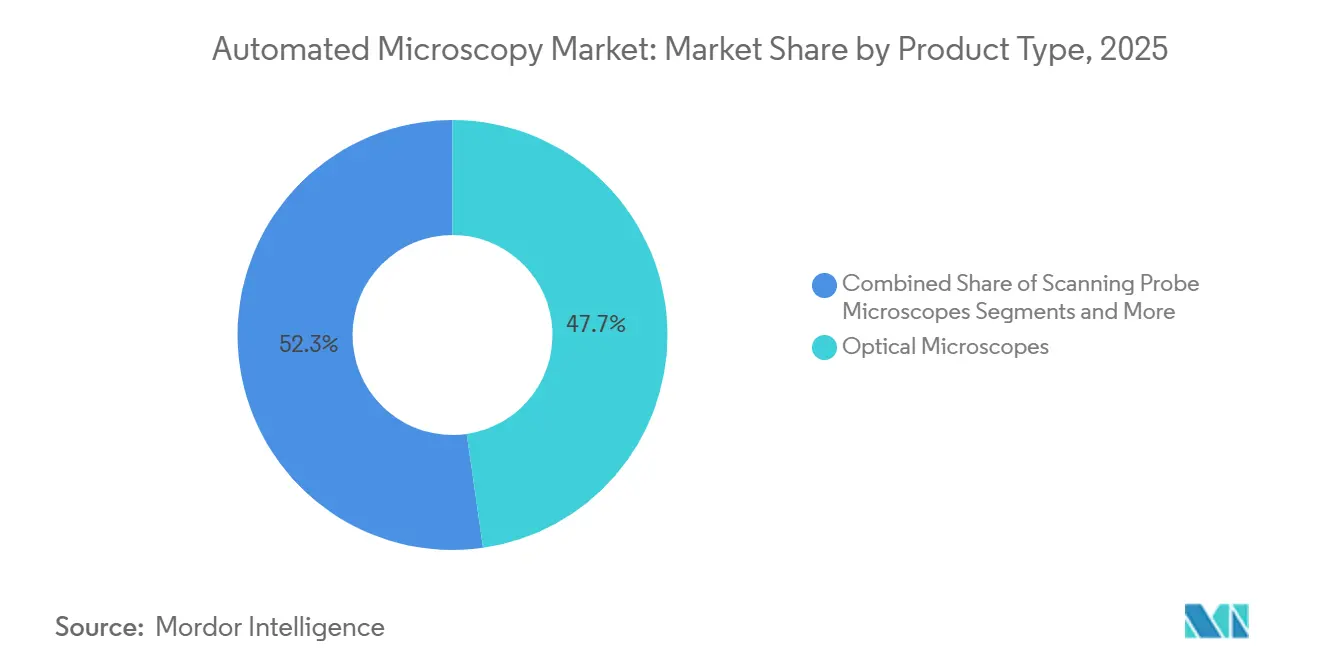
- By product type, optical microscopes led with 47.73% of automated microscopy market share in 2025, while live-cell imaging systems are slated to climb at a 9.57% CAGR through 2031.
- By application, drug discovery and high-content screening held 41.67% of the automated microscopy market size in 2025 and are expanding at a 10.57% CAGR to 2031.
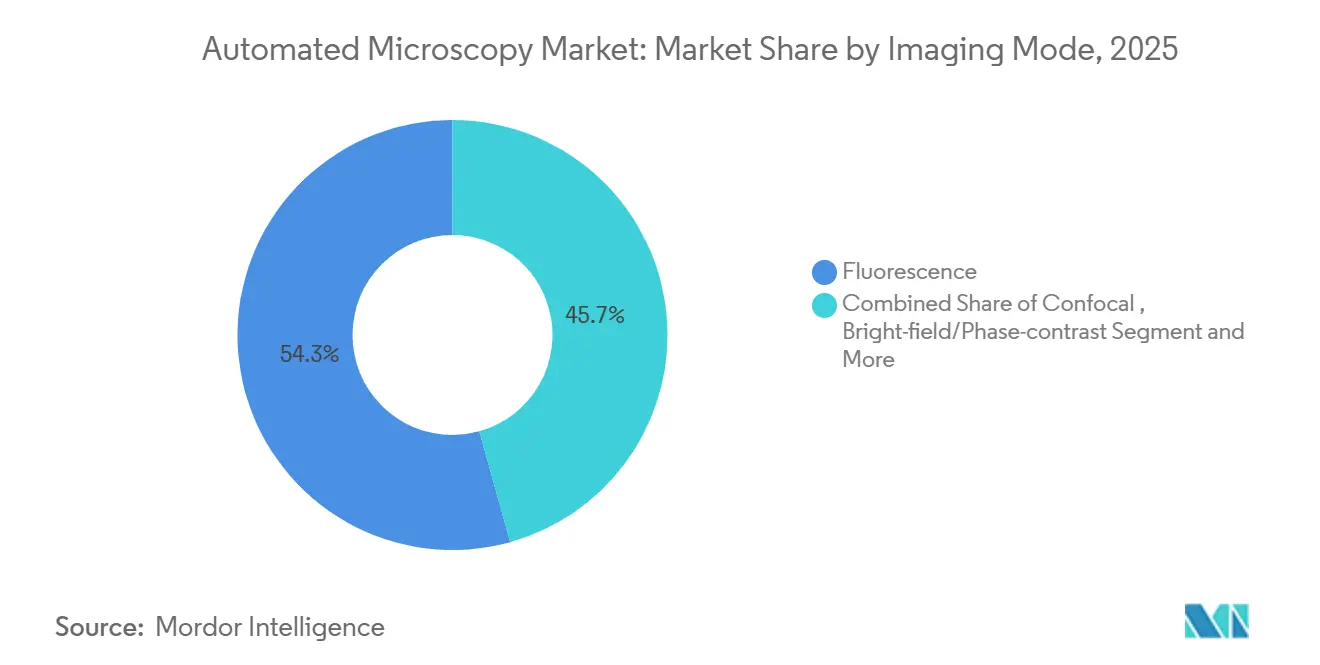
- By imaging mode, fluorescence dominated with 54.32% share in 2025; super-resolution techniques will rise at a 10.85% CAGR through 2031.
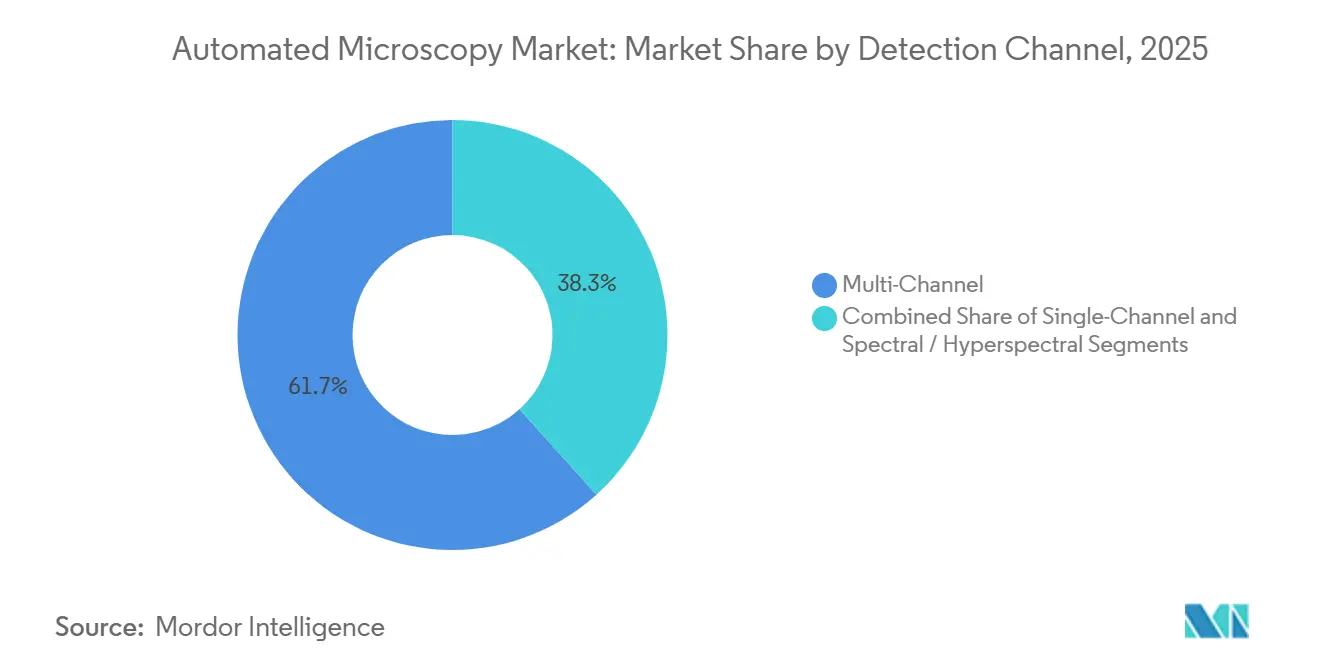
- By detection channel, multi-channel systems captured 61.68% share in 2025, whereas spectral and hyperspectral detection will post a 9.24% CAGR by 2031.
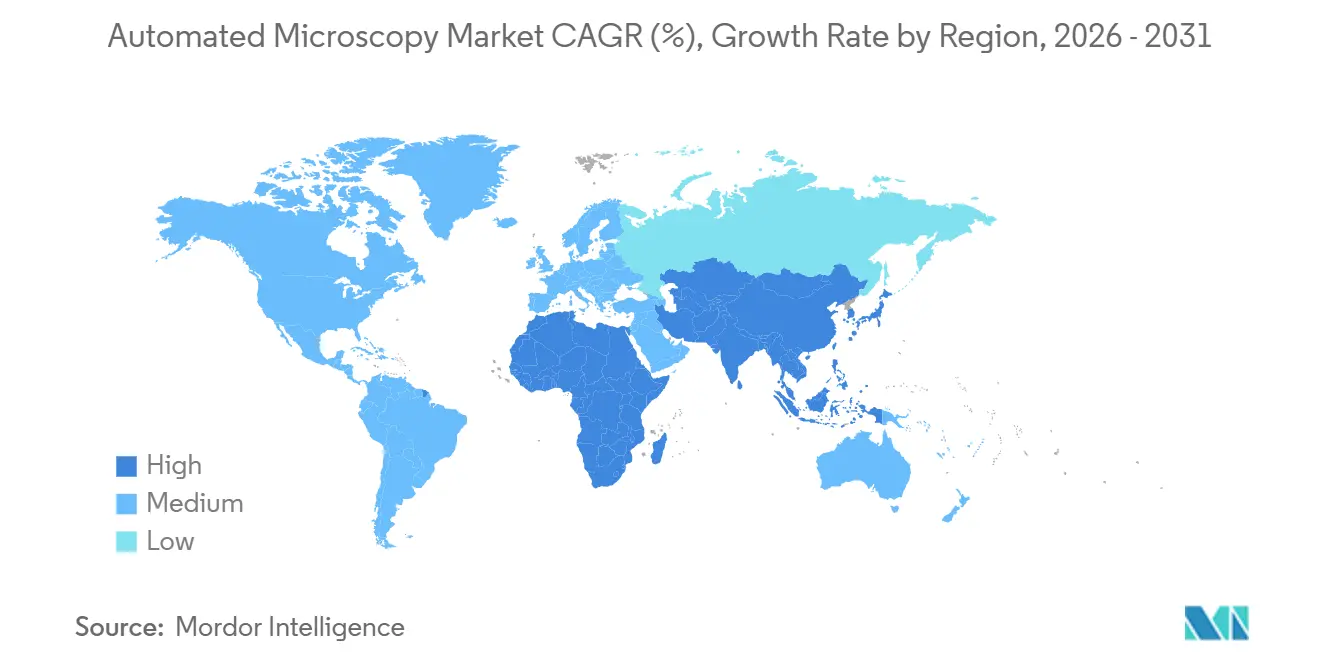
- By geography, North America commanded 33.63% share in 2025, but Asia-Pacific will register the fastest regional CAGR at 8.12% to 2031.
Note: Market size and forecast figures in this report are generated using Mordor Intelligence’s proprietary estimation framework, updated with the latest available data and insights as of January 2026.
Global Automated Microscopy Market Trends and Insights
Drivers Impact Analysis*
| Driver | (~) % Impact on CAGR Forecast | Geographic Relevance | Impact Timeline |
|---|---|---|---|
| Rapid Adoption of AI-Powered Image Analysis | 1.8% | Global, with concentration in North America and Europe | Medium term (2-4 years) |
| Growth of High-Throughput Drug-Discovery Workflows | 1.5% | North America, Europe, APAC pharmaceutical hubs (China, India, South Korea) | Short term (≤ 2 years) |
| Rising Chronic-Disease Diagnostics Demand | 1.2% | Global, particularly North America and Europe aging populations | Long term (≥ 4 years) |
| Near-Shoring of Optical-Component Supply Chains | 0.7% | North America and Europe, with spill-over to select APAC markets | Medium term (2-4 years) |
| Expansion Microscopy Democratizing Super-Resolution | 0.6% | Global, early adoption in academic institutes and biotech startups | Long term (≥ 4 years) |
| Diffusion-Model Data Augmentation Slashing Annotation Costs | 0.5% | North America, Europe, and leading APAC research centers | Short term (≤ 2 years) |
| Source: Mordor Intelligence | |||
Rapid Adoption of AI-Powered Image Analysis
Laboratories are embedding convolutional-network and transformer models to classify phenotypes, quantify protein expression, and predict compound toxicity without manual review. Thermo Fisher released the CellInsight CX7 platform in March 2024 with pretrained models that trim image-analysis time by 60%.[1]Thermo Fisher Scientific, “CellInsight CX7 High-Content Screening Platform,” Thermo Fisher Scientific, thermofisher.com The U.S. FDA issued draft guidance in January 2025 that clarifies validation rules for AI-enabled imaging devices, letting vendors structure trials around predefined endpoints.[2]U.S. Food and Drug Administration, “Artificial Intelligence and Machine Learning in Medical Devices—Draft Guidance,” FDA, fda.gov Contract research organizations (CROs) report 30%–40% cost cuts per compound series, making phenotypic assays affordable for small biotech firms. Shifting from rule-based segmentation to learned models also reduces reliance on scarce imaging specialists, easing workforce constraints in emerging markets.
Growth of High-Throughput Drug-Discovery Workflows
Pharma companies now expect automated microscopes to image 384-well and 1,536-well plates in under two hours. Agilent’s BioTek Lionheart FX, launched June 2024, keeps live cells viable for multi-day time-lapse runs. Pfizer’s 2024 annual report notes that integrating AI-driven microscopes doubled screening throughput and trimmed hit-to-lead timelines by 25%. The ISO 23833 standard, published November 2024, harmonizes automated cell-culture imaging protocols, so sponsors can pool data across CRO sites.[3]International Organization for Standardization, “ISO 23833:2024 Automated Cell-Culture Imaging Protocols,” ISO, iso.org Growth also comes from academic cores such as the Broad Institute, which added 12 automated microscopes in September 2024 to handle terabytes of daily CRISPR-screen images.
Rising Chronic-Disease Diagnostics Demand
Aging populations drive uptake of digital pathology scanners that cut review times and widen access to subspecialty expertise. Roche’s VENTANA DP 600 earned U.S. 510(k) clearance in February 2025, reducing prostate and breast biopsy review time by 35%. Europe’s IVDR, fully enforced since May 2024, raises validation requirements and cements trust in established platforms. Japan and South Korea report double-digit growth in digital pathology to offset pathologist shortages, while liquid-biopsy microscopy gains traction as a less invasive cancer-monitoring tool.
Near-Shoring of Optical-Component Supply Chains
Geopolitical shocks have pushed vendors to build lens and coating lines closer to Western customers. Zeiss invested EUR 50 million to expand its Oberkochen plant in April 2024, and Nikon added a secondary optical-coating line in Tochigi the same year. The U.S. CHIPS and Science Act dedicates USD 200 million to domestic precision-optics capacity. Shorter lead times accelerate prototype imaging systems, though regional production lifts per-unit costs by around 15%–20%.
Restraints Impact Analysis*
| Restraint | (~) % Impact on CAGR Forecast | Geographic Relevance | Impact Timeline |
|---|---|---|---|
| High Capital & Maintenance Costs | -0.9% | Global, acute in price-sensitive APAC and MEA markets | Short term (≤ 2 years) |
| Skilled-Personnel Shortages | -0.6% | Global, particularly acute in Tier 2 cities and emerging economies | Medium term (2-4 years) |
| Obsolescence Risk from Rapid AI / Firmware Cycles | -0.5% | North America and Europe, where regulatory scrutiny is highest | Short term (≤ 2 years) |
| Regulatory Lag on AI Explainability | -0.4% | North America and Europe, with emerging frameworks in APAC | Medium term (2-4 years) |
| Source: Mordor Intelligence | |||
High Capital & Maintenance Costs
Cutting-edge automated microscopes range from USD 150,000 to over USD 1 million, and service contracts add 10%–15% yearly. A European Microscopy Society survey in June 2024 showed 40% of labs delay upgrades beyond seven years due to budget limits. Subscription models are emerging—Evident piloted a EUR 3,000 monthly service in Germany—but lifetime costs can exceed outright purchase by 20%.
Skilled-Personnel Shortages
The American Society for Cell Biology reported in August 2024 that 35% of U.S. imaging cores had vacancies longer than six months. Remote-assist tools such as Zeiss ZEN Connect, launched March 2024, cut on-site visits by half, yet hands-on expertise remains essential for complex live-cell protocols.
*Our forecasts treat driver/restraint impacts as directional, not additive. The impact forecasts reflect baseline growth, mix effects, and variable interactions.
Segment Analysis
By Product Type: Live-Cell Systems Gain Momentum
Live-cell platforms are forecast to post a 9.57% CAGR, reflecting a shift toward dynamic cellular assays. Optical microscopes, while owning 47.73% of automated microscopy market share in 2025, will expand more slowly as labs migrate to integrated incubation, autofocus, and multimodal illumination systems. Electron microscopes retain unmatched resolution for structural biology and semiconductor inspection, yet vacuum requirements and slow sample prep limit life-science uptake. Scanning probe microscopes serve niche nanotechnology workflows, and super-resolution rigs remain expensive despite cost-relief from expansion microscopy. Label-free quantitative-phase imaging is growing in stem-cell and organoid research because it sidesteps phototoxic dyes.
Broader industry patterns reinforce the trend: Danaher’s Molecular Devices unit logged 35% live-cell imager sales growth in 2024. Expansion microscopy enables conventional confocals to emulate super-resolution, eroding the exclusivity of USD 500,000 platforms. Scanning probe microscopes will continue as specialized tools for surface metrology, hampered by serial scanning speeds.


By Application: Drug Discovery Drives Double-Digit Growth
Drug discovery and high-content screening commanded 41.67% of automated microscopy market size in 2025 and will grow at 10.57% CAGR. Clinical diagnostics expand more cautiously due to reimbursement ceilings, and academic research depends on fluctuating grant cycles. Semiconductor inspection is a high-value niche, fueled by sub-10-nanometer node production; ASML reports rising orders for complementary optical microscopes. Environmental and food-testing labs favor lower-cost brightfield systems, capping revenue contribution.
Pharma pipelines now front-load phenotypic screens, imaging hundreds of cellular features per compound. Bruker’s Vutara VXL answers single-molecule localization needs in live cells. CROs such as Charles River have invested USD 25 million to expand imaging fleets, enabling sponsors to externalize phenotypic assays.
By Imaging Mode: Super-Resolution Accelerates
Fluorescence retained 54.32% share in 2025, yet super-resolution modalities will rise at a 10.85% CAGR as expansion microscopy plus computational techniques reduce barriers. Confocal and multiphoton remain staples for thick-tissue imaging; light-sheet methods outpace them for fast, phototoxicity-free acquisition. Label-free quantitative phase imaging is gaining traction for long-term assays where dyes disturb cell physiology.
Leica’s STELLARIS 8 STED, launched January 2024, delivers 20-nanometer resolution via time-gated detection. Hamamatsu’s ORCA-Quest qCMOS camera boosts photon-counting accuracy, enhancing label-free modes. Expansion microscopy widens access to nanoscale detail on standard rigs, a core reason super-resolution adoption is speeding up.
By End User: Pharma and Biotech Lead Spending
Pharma and biotech companies held 38.77% share in 2025 and will grow at 9.45% CAGR thanks to rising R&D outlays. Academic institutes rely on government and philanthropic grants yet face budget volatility. Diagnostic labs adopt digital pathology but confront reimbursement pressure. Semiconductor manufacturers, including Samsung and TSMC, invest heavily in defect-inspection optics, representing a lucrative specialized segment.
Miltenyi’s MACSima platform illustrates modular systems tailored for deep immune-profiling that attract both pharma and academic buyers. Venture-backed biotech startups funnel capital into CRO imaging services when in-house budgets fall short, sustaining outsourced demand.
By Detection Channel: Spectral Imaging Meets Multiplexing Needs
Multi-channel detection captured 61.68% share in 2025, yet spectral and hyperspectral channels are forecast to climb at 9.24% CAGR. Single-channel rigs persist in cost-sensitive and educational settings. Thermo Fisher’s CX7 integrates tunable LEDs and unmixing algorithms for up to eight overlapping fluorophores.
Science Translational Medicine reported that 40-plex spectral imaging predicts checkpoint-inhibitor response, underscoring demand for higher-order multiplexing. Hyperspectral data, while computationally intensive, finds industrial uses; the U.S. Department of Agriculture detects pesticide residues at 10-fold lower limits via hyperspectral microscopy.
Geography Analysis
North America contributed 33.63% of automated microscopy market revenue in 2025, buoyed by USD 47 billion in NIH funding and over USD 20 billion in venture capital for life-science startups. FDA guidance on AI imaging devices, released January 2025, encourages product launches but imposes compliance costs between USD 2 million and USD 5 million per device. Canada is scaling centralized cancer-diagnostic hubs; Ontario’s CAD 30 million program will outfit 15 hospitals with slide scanners. Mexico’s growth is modest, though near-shoring of pharma manufacturing triggers incremental demand for QA microscopes.
Asia-Pacific is poised for the fastest regional expansion at 8.12% CAGR through 2031. China earmarked CNY 5 billion in 2024 to upgrade university imaging infrastructure. South Korea’s semiconductor giants plan more than USD 40 billion in 2024 capital outlays, a slice of which funds advanced defect-inspection microscopes. India’s big-pharma companies are equipping high-content screening labs to support biosimilar pipelines. Japan’s digital-pathology footprint rose to 50% of hospital pathology departments in 2024, reflecting both aging demographics and pathologist shortages.
Europe holds a sizable stake thanks to rigorous regulatory frameworks that prioritize quality. IVDR enforcement stabilizes demand for validated scanners, while EMA explainability rules increase user-interface complexity but protect patient safety. The NHS deployed GBP 20 million to digitize 25 hospital pathology labs in July 2024. Germany’s Max Planck Society and France’s CNRS continue to attract global researchers to world-class imaging cores. Eastern Europe and Southern Europe show mixed momentum, balancing EU funding with local budget constraints.
Middle East and Africa growth concentrates in Gulf Cooperation Council states, where institutions like KAUST opened a USD 15 million cryo-EM facility in March 2024. South Africa’s private labs adopt digital pathology for medical tourism, while much of sub-Saharan Africa remains reliant on manual microscopes.
South America is modest but expanding. Brazil’s FAPESP invested BRL 100 million in imaging upgrades across universities, whereas Argentina’s budget cuts slowed new equipment purchases. Mining in Chile and Colombia uses automated microscopy for ore analysis, yet life-science applications remain limited.

Competitive Landscape
The top five vendors includes Zeiss, Nikon, Thermo Fisher Scientific, Danaher (Leica Microsystems and Molecular Devices), and Olympus underscoring moderate concentration. Their strategy orbits integrated ecosystems that tie hardware, software, and consumables into multi-year service contracts. Upstarts like Keyence, CytoSMART, and Etaluma chip away with modular, lower-priced systems that appeal to budget-sensitive customers.
Semiconductor-focused giants are entering life-science imaging; Hitachi High-Tech’s AFM5500M and JEOL’s JEM-F200 bring industrial metrology credibility to biological workflows. Vendors are shifting toward subscription pricing; Evident’s EUR 3,000-per-month confocal plan lowers entry barriers but raises lifetime spend. Remote-service portals such as Zeiss ZEN Connect reduce downtime by 50%, crucial in regions short on field engineers.
Patent filings hint at future competition. Zeiss lodged 12 patents on adaptive optics for thick-tissue imaging, and Nikon filed eight on AI autofocus that promises 40% faster plate scans. ISO 23833 establishes global benchmarks for automated cell-culture imaging, favoring vendors with compliant platforms while stretching the resources of smaller challengers.
Automated Microscopy Industry Leaders
Leica Microsystems
Carl Zeiss AG
Thermo Fisher Scientific
Nikon Corporation
Olympus
- *Disclaimer: Major Players sorted in no particular order

Recent Industry Developments
- July 2025: Thermo Fisher introduced the Scios 3 FIB-SEM and Talos 12 TEM, targeting broader access to high-end electron microscopy.
- July 2025: Nikon launched the ECLIPSE Ti2-I motorized inverted microscope for IVF, claiming a 75% reduction in procedural steps.
- January 2025: Bruker rolled out the LUMOS II ILIM QCL-based IR imaging microscope, enabling ultrafast, high-resolution imaging for large areas.


Global Automated Microscopy Market Report Scope
Automated microscopy is a computer-assisted, motorized imaging system that automates microscope components to enable high-throughput workflows for capturing, analyzing, and storing high-resolution datasets with minimal human intervention.
The Automated Microscopy Market Report is segmented by Product Type, Application, End User, Imaging Mode, Detection Channel, and Geography. By Product Type, the market is segmented into Optical, Electron, Scanning Probe, Live-Cell Imaging, Super-Resolution, and Quantitative Phase. By Application, the market is segmented into Medical Diagnostics, Life-Science Research, Drug Discovery, Materials, Semiconductor Inspection, and Environmental Testing. By End User, the market is segmented into Pharma/Biotech, Academic Institutes, Diagnostic Labs, Industrial Manufacturers, and CROs. By Imaging Mode, the market is segmented into Brightfield, Fluorescence, Confocal, Light-Sheet, Super-Resolution, and Label-Free. By Detection Channel, the market is segmented into Single, Multi, and Spectral. By Geography, the market is segmented into North America, Europe, Asia-Pacific, Middle East & Africa, and South America. The market report also covers the estimated market sizes and trends for 17 countries across major regions globally. Market Forecasts are Provided in Terms of Value (USD).
| Optical Microscopes |
| Electron Microscopes |
| Scanning Probe Microscopes |
| Live-Cell Imaging Systems |
| Super-Resolution & Single-Molecule Systems |
| Quantitative Phase / Label-Free Systems |
| Medical Diagnostics |
| Life-Science Research |
| Drug Discovery & High-Content Screening |
| Materials & Nanotechnology |
| Semiconductor Inspection & Metrology |
| Environmental & Food Testing |
| Pharmaceutical & Biotechnology Companies |
| Academic & Research Institutes |
| Diagnostic Laboratories & Hospitals |
| Industrial & Semiconductor Manufacturers |
| Contract Research Organizations |
| Bright-field / Phase-contrast |
| Fluorescence |
| Confocal / Multiphoton |
| Light-Sheet / Oblique-Plane |
| Super-Resolution (STED, PALM/STORM, SIM) |
| Quantitative Phase / Label-Free |
| Single-Channel |
| Multi-Channel |
| Spectral / Hyperspectral |
| North America | United States |
| Canada | |
| Mexico | |
| Europe | Germany |
| France | |
| United Kingdom | |
| Italy | |
| Spain | |
| Rest of Europe | |
| Asia-Pacific | China |
| Japan | |
| India | |
| South Korea | |
| Australia | |
| Rest of Asia-Pacific | |
| Middle East & Africa | GCC |
| South Africa | |
| Rest of Middle East & Africa | |
| South America | Brazil |
| Argentina | |
| Rest of South America |
| By Product Type | Optical Microscopes | |
| Electron Microscopes | ||
| Scanning Probe Microscopes | ||
| Live-Cell Imaging Systems | ||
| Super-Resolution & Single-Molecule Systems | ||
| Quantitative Phase / Label-Free Systems | ||
| By Application | Medical Diagnostics | |
| Life-Science Research | ||
| Drug Discovery & High-Content Screening | ||
| Materials & Nanotechnology | ||
| Semiconductor Inspection & Metrology | ||
| Environmental & Food Testing | ||
| By End User | Pharmaceutical & Biotechnology Companies | |
| Academic & Research Institutes | ||
| Diagnostic Laboratories & Hospitals | ||
| Industrial & Semiconductor Manufacturers | ||
| Contract Research Organizations | ||
| By Imaging Mode (Value) | Bright-field / Phase-contrast | |
| Fluorescence | ||
| Confocal / Multiphoton | ||
| Light-Sheet / Oblique-Plane | ||
| Super-Resolution (STED, PALM/STORM, SIM) | ||
| Quantitative Phase / Label-Free | ||
| By Detection Channel | Single-Channel | |
| Multi-Channel | ||
| Spectral / Hyperspectral | ||
| By Geography | North America | United States |
| Canada | ||
| Mexico | ||
| Europe | Germany | |
| France | ||
| United Kingdom | ||
| Italy | ||
| Spain | ||
| Rest of Europe | ||
| Asia-Pacific | China | |
| Japan | ||
| India | ||
| South Korea | ||
| Australia | ||
| Rest of Asia-Pacific | ||
| Middle East & Africa | GCC | |
| South Africa | ||
| Rest of Middle East & Africa | ||
| South America | Brazil | |
| Argentina | ||
| Rest of South America | ||


Key Questions Answered in the Report
How big is the automated microscopy market in 2026?
The automated microscopy market size stands at USD 9.19 billion in 2026.
What is the forecast CAGR for automated microscopy to 2031?
Industry revenues are projected to rise at a 6.48% CAGR through 2031.
Which product category is growing the fastest?
Live-cell imaging systems are expected to advance at a 9.57% CAGR between 2026 and 2031.
Which application segment dominates spending?
Drug discovery and high-content screening captured 41.67% share in 2025 and retain the largest spend through 2031.
Which region will see the quickest growth?
Asia-Pacific leads with an anticipated 8.12% CAGR as China, India, and South Korea scale both life-science and semiconductor demand.
What is the main challenge to wider adoption?
High capital and maintenance costs, especially for smaller institutions, remain the most significant near-term hurdle.
Page last updated on:


