
Australia Wire and Cable Market Size and Share
Market Overview
| Study Period | 2020 - 2031 |
|---|---|
| Forecast Data Period | 2026 - 2031 |
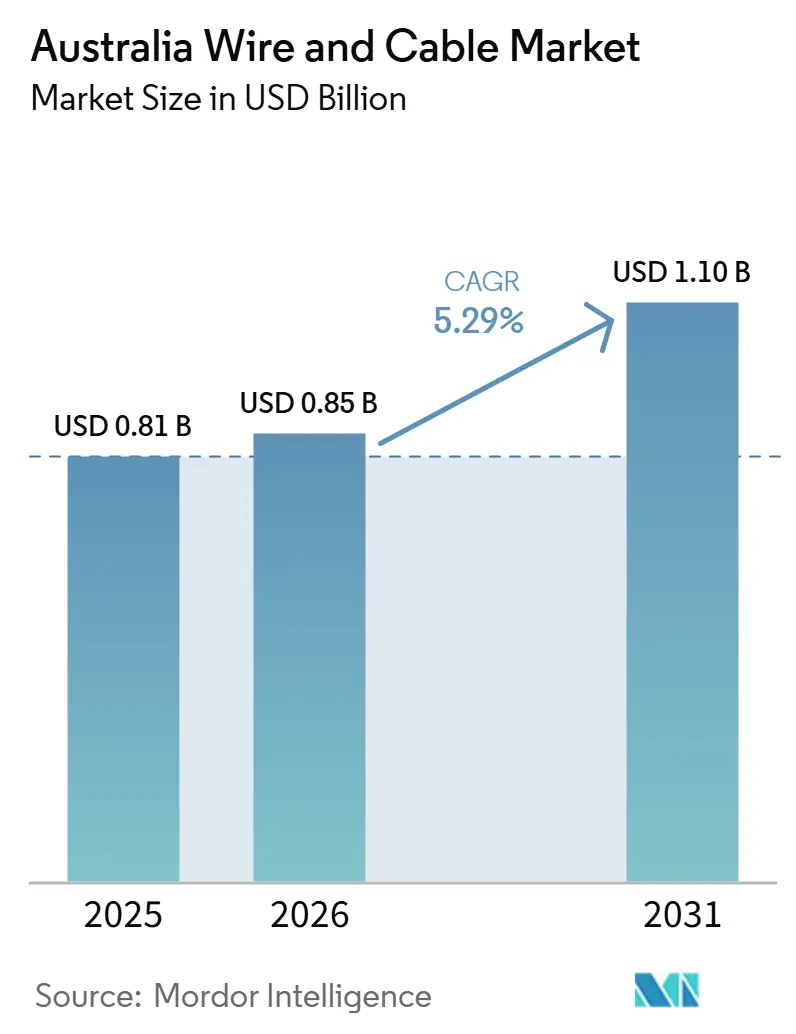
| Base Year Market Size (2025) | USD 0.81 Billion |
| Market Size (2026) | USD 0.85 Billion |
| Market Size (2031) | USD 1.10 Billion |
| Growth Rate (2026 - 2031) | 5.29 % |
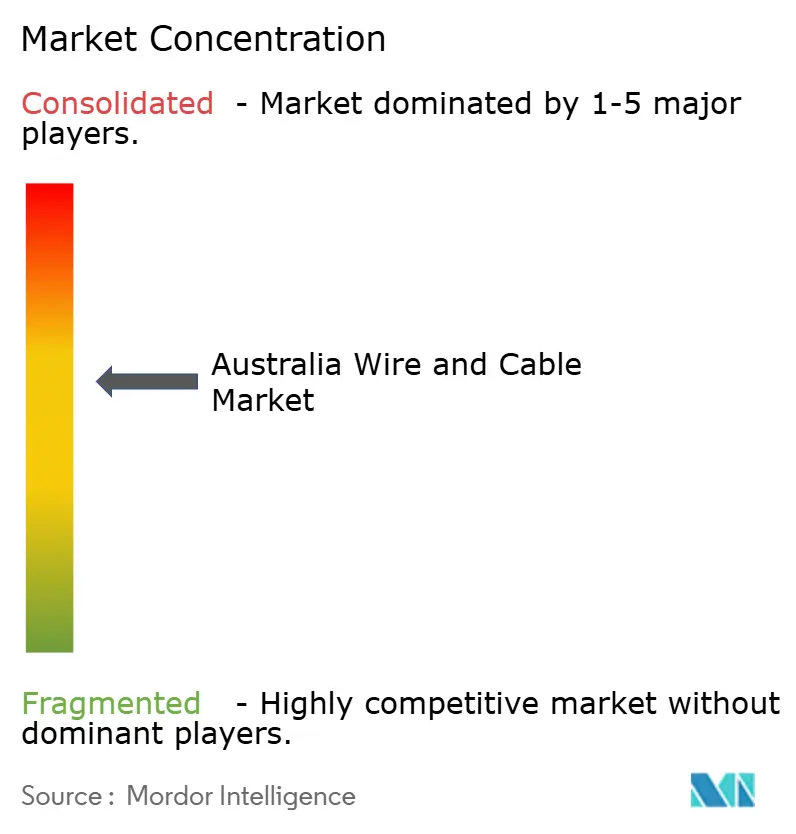
| Market Concentration | Medium |
Major Players *Disclaimer: Major Players sorted in no particular order Image © Mordor Intelligence. Reuse requires attribution under CC BY 4.0. | |
Australia Wire and Cable Market Analysis by Mordor Intelligence
The Australia wire and cable market size was valued at USD 0.81 billion in 2025 and is estimated to grow from USD 0.85 billion in 2026 to reach USD 1.1 billion by 2031, at a CAGR of 5.29% during the forecast period (2026-2031). Grid modernization is the central demand source, as Renewable Energy Zones, interconnectors, and replacement programs require large volumes of transmission and distribution cable. Digital infrastructure is also widening demand, as new fiber routes and data centers require both communications cables and power distribution systems. Procurement conditions remain difficult because high-specification cable relies on global supply chains, while material prices and skilled installation capacity create delivery risks. Suppliers with high-voltage, subsea, and fiber capabilities are positioned for larger project awards, while local specialists continue to serve construction, industrial, and maintenance needs.
Key Report Takeaways
- By voltage, low-voltage cables held 42.31% of the Australia wire and cable market share in 2025, while extra- and high-voltage cables are projected to expand at a 7.11% CAGR through 2031.
- By cable type, power cables held a 33.16% revenue share in 2025, while fiber-optic cables are projected to grow at a 6.12% CAGR through 2031.
- By conductor material, copper held 50.98% revenue share in 2025, while aluminum is projected to expand at a 7.31% CAGR through 2031.
- By installation type, overhead accounted for 39.11% of revenue share in 2025, while submarine cables are projected to grow at a 6.66% CAGR through 2031.
- By end-user vertical, power infrastructure, utilities, and renewables accounted for 30.12% of revenue in 2025, while telecommunications and data centers are projected to expand at a 5.98% CAGR through 2031.
- By insulation, insulated cables held 78.98% revenue share in 2025 and are projected to grow at a 6.99% CAGR through 2031.
Note: Market size and forecast figures in this report are generated using Mordor Intelligence’s proprietary estimation framework, updated with the latest available data and insights as of January 2026.
Australia Wire and Cable Market Trends and Insights
Drivers Impact Analysis*
| DRIVER | (~) % IMPACT ON CAGR FORECAST | GEOGRAPHIC RELEVANCE | IMPACT TIMELINE |
|---|---|---|---|
| Renewable Energy Zone and Interconnector Build-Out | +1.8% | National, with concentrated activity in NSW, VIC, QLD, and TAS | Short term (≤ 2 years) |
| Aging Transmission and Distribution Asset Replacement | +1.2% | National, with early pressure in VIC, SA, and QLD networks | Medium term (2-4 years) |
| Fiber, Data Center, and Network-Densification Demand | +0.8% | Concentrated in NSW and VIC, with secondary gains in ACT and WA | Short term (≤ 2 years) |
| Building, Transport, and Fleet Electrification | +0.5% | National, with density in urban NSW, VIC, and WA | Medium term (2-4 years) |
| Fire-Safe and Energy-Efficient Cable Specification | +0.3% | National, driven by NCC adoption across all jurisdictions | Medium term (2-4 years) |
| Cable Localization for Critical Infrastructure Resilience | +0.2% | National, with early activity in defense and utility corridors | Long term (≥ 4 years) |
| Source: Mordor Intelligence | |||
Renewable Energy Zone and Interconnector Build-Out
Federal transmission support is creating a larger and more concentrated pipeline for the Australia wire and cable market. Rewiring the Nation committed USD 4.6 billion to priority transmission projects in New South Wales, with a further USD 1.4 billion allocated through the Renewable Energy Transformation Agreement.[1]Australian Department of Climate Change, Energy, the Environment and Water, “Rewiring the Nation,” Australian Government, dcceew.gov.au These commitments support cable demand across Renewable Energy Zones, new interconnectors, and backbone grid upgrades. Project EnergyConnect was fully energized across South Australia and New South Wales in 2026 after using 10,385 km of high-voltage conductor cabling during construction.[2]Transgrid, “EnergyConnect Powers Up as Clean Energy Transition Forges Ahead,” Transgrid, transgrid.com.au The project pipeline favors XLPE-insulated AC and HVDC cable because new connections require reliable transmission systems across long distances. This work creates sustained procurement opportunities for suppliers that can meet complex technical specifications and delivery schedules.
Aging Transmission and Distribution Asset Replacement
Replacement spending is adding a separate demand stream alongside new grid construction. AusNet began proactive replacement of Doulton-pattern insulators and GIS switchgear at 500 kV substations, with capital expenditure for its transmission insulator program extending through FY2027.[3]AusNet Services, “Transmission Insulator Replacement 500kV and 220kV, PACR,” AusNet Services, ausnetservices.com.au The Australian Energy Market Operator Integrated System Plan guides USD 142 billion of investment across the National Electricity Market, including USD 16 billion for transmission upgrades.[4]International Energy Agency, “ESAB 2025 Panel I, Challenges in Transmission and New Energy,” International Energy Agency, iea.org Condition-based replacement is less flexible than greenfield investment because failed assets must be replaced regardless of short-term demand conditions. This can make cable purchasing more dependent on equipment condition ratings than on electricity-load forecasts. Powerlink has identified a 10-year replacement pipeline across high-voltage cables, overhead conductors, and substation equipment, adding continuity to the national order base.
Fiber, Data Center, and Network-Densification Demand
Fiber expansion and data center construction are increasing demand for communications and power cable in the Australia wire and cable market. Vocus committed USD 346 million for a ducted long-haul fiber route between Sydney and Melbourne that can accommodate up to 6,912 fiber cores. The project adds a new national route and supports future backbone capacity between the 2 largest data center hubs. Vocus stated that the platform responds to growing requirements from cloud, artificial intelligence, and digital service providers. Data center campuses also need medium-voltage connections, internal distribution systems, and structured cabling, which broadens demand beyond long-haul fiber. This combination supports cable orders from carriers, hyperscale facilities, contractors, and network operators.
Building, Transport, and Fleet Electrification
NCC 2025 entered its adoption phase on May 1, 2026, and it requires provisions for electric vehicle charging infrastructure in new buildings. Commercial car parks need dedicated EV charging distribution boards, while new residential car spaces require a minimum 32-amp single-phase circuit.[5]Australian Building Codes Board, “NCC 2025 Volume One, Part J9 Energy Monitoring and On-Site Distributed Energy Resources,” Australian Building Codes Board, abcb.gov.au These requirements turn EV-ready wiring into a standard part of new building work rather than an optional upgrade. Large fleet depots create an additional demand source because each conversion requires upgrades to the incoming supply and internal distribution networks. ARENA published a design report for Zenobē’s shared electric truck charging facility in Sydney during 2026, showing the scale of switchboard and cable planning needed for heavy-vehicle charging. Repeating depot upgrades can provide steady low- and medium-voltage cable demand across transport fleets.
Restraints Impact Analysis*
| RESTRAINT | (~) % IMPACT ON CAGR FORECAST | GEOGRAPHIC RELEVANCE | IMPACT TIMELINE |
|---|---|---|---|
| Copper and Aluminum Cost Volatility | -0.7% | Global, with margin pressure concentrated in Australian manufacturers and importers | Short term (≤ 2 years) |
| Import Dependence and Long Specialty-Cable Lead Times | -0.5% | National, with acute exposure in TAS, WA, and NT, where port access is constrained | Medium term (2-4 years) |
| Skilled Installation Labor and Testing Bottlenecks | -0.3% | National, with the worst shortfalls in regional NSW, QLD, and WA, the Renewable Energy Zone corridors | Medium term (2-4 years) |
| Project Approvals, Land Access, and Community Consultation Delays | -0.2% | Concentrated in rural NSW, VIC, and TAS, where transmission routes cross Indigenous and farming land | Long term (≥ 4 years) |
| Source: Mordor Intelligence | |||
Copper and Aluminum Cost Volatility
Material cost volatility can affect tender pricing, supplier margins, and cable specifications. Copper reached an intraday record of USD 14,527.50 per tonne on January 29, 2026, before easing. In the same price environment, the copper-to-aluminum price ratio reached 4.3, strengthening the case for aluminum in large cross-section power applications. Prysmian has shifted its product mix to 40% aluminum by weight, reflecting aluminum’s importance in grid and data center demand. Australian importers remain exposed, as global commodity price movements can quickly pass through to landed cable costs. Fixed-price contracts can therefore become difficult to manage when metal prices move after suppliers submit bids. Buyers are likely to assess material substitution, contract mechanisms, and lead-time planning more closely for large transmission awards.
Import Dependence and Long Specialty-Cable Lead Times
Australia relies heavily on imported finished wire and cable products, particularly in specialty categories. This structure remains manageable for building wire, low-voltage power cable, and standard data cable, where multiple suppliers can serve the market. However, HVDC subsea cables, mine-rated trailing cables, and large cross-section XLPE transmission cables face greater constraints and can require lead times of 18 to 36 months. Marinus Link awarded Prysmian a contract for a 345 km cable system, including 255 km of submarine cable and 90 km of underground cable, with manufacturing in Italy and France. The award demonstrates that even nationally important projects depend on global manufacturing capacity. Compliance with AS/NZS 1429.1 and IEC 60840 also narrows the eligible supplier base for high-voltage work. Long lead times can delay delivery planning and strengthen the position of established suppliers with certified production capacity.
*Our forecasts treat driver/restraint impacts as directional, not additive. The impact forecasts reflect baseline growth, mix effects, and variable interactions.
Segment Analysis
By Voltage, High-Voltage Demand Outpaces the Grid Rebuild Pipeline
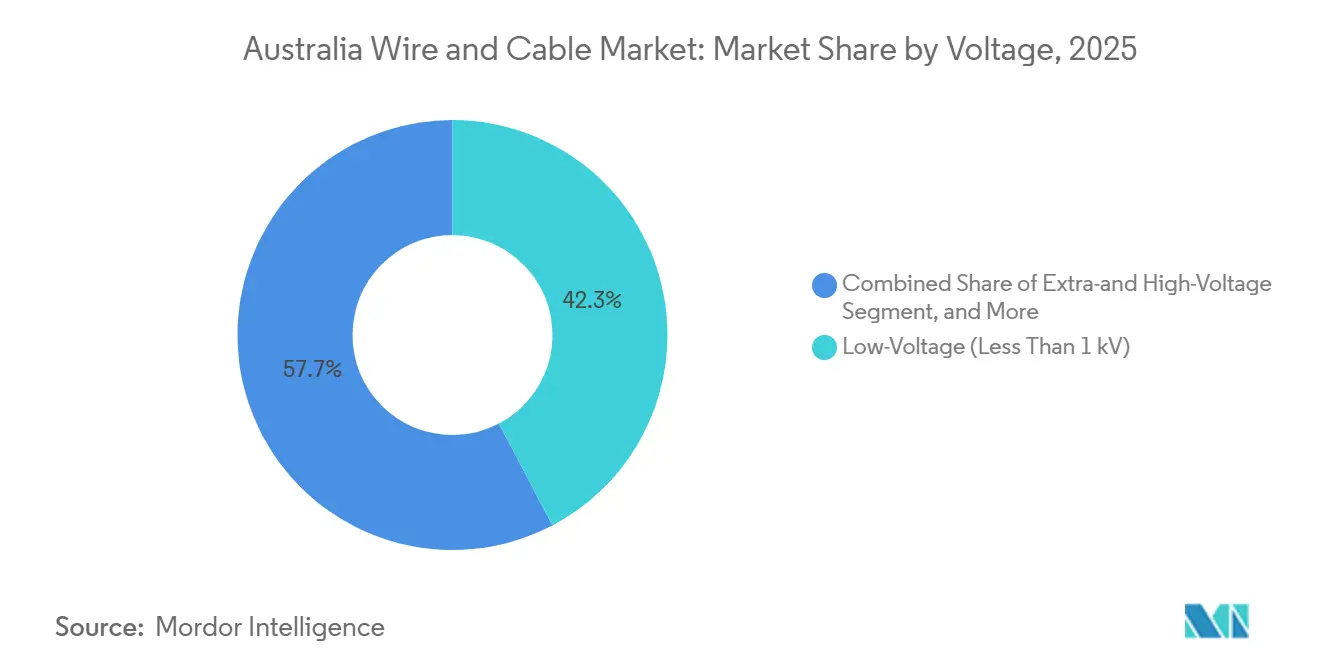
Low-voltage cables are expected to account for 42.31% of revenue in 2025, making them the largest voltage tier in the Australia wire and cable market. Housing, commercial fit-outs, industrial panels, and building services widely use these cables. Extra- and high-voltage cables are projected to register the fastest growth, at a 7.11% CAGR from 2026 to 2031. This growth reflects the larger capital programs now advancing through Renewable Energy Zones and interconnector projects. The Rewiring the Nation plan identifies 4,581 km of new transmission lines by 2030. Many of these routes require overhead or underground conductor systems rated 220 kV to 500 kV. Medium-voltage cables connect bulk transmission systems with local distribution networks. Renewable collector systems, industrial substations, and data center campus feeds use these cables.
Project timing and total project value shape the extra-high-voltage segment. Delays can defer cable orders, but they do not reduce the cable volumes required once construction begins. VNI West has shifted the construction commencement for its Victorian section from 2026 to 2027, while retaining its full system requirement. Therefore, high-voltage demand is supported by a pipeline that creates concentrated procurement windows for the Australian wire and cable market. Certified suppliers can benefit when delayed approvals result in several large orders falling into the same delivery period. This pattern may also increase inventory risk for distributors that plan stock around early schedules. XLPE remains the preferred insulation for underground and subsea high-voltage applications because it supports modern AC and HVDC designs. AS/NZS 1429.1 and IEC 60840 remain important qualification requirements for these projects.



By Cable Type, Fiber-Optic Growth Extends Beyond Telecommunications
The power cable segment is expected to account for 33.16% of revenue in 2025, the largest share among cable types. The category benefits from strong exposure to power networks, renewable connections, building installations, and industrial distribution. Fiber-optic cable is projected to grow at a 6.12% CAGR through 2031. This expansion is linked to backbone routes, data center interconnects, and demand for higher-capacity network connections. SUBCO is expected to bring the 5,000 km SMAP submarine cable system into service in June 2026. The 16-fiber-pair system connects Sydney, Melbourne, Adelaide, and Perth and is expected to add more than 400 Tbit/s of capacity. Fiber demand also rises inside data centers, where high-density computing rooms require extensive structured cabling.
Signal and control cables support industrial automation, process control, and sensing applications. Mining, petrochemicals, and advanced manufacturing continue to require these cables for equipment and plant operations. Fiber substitutes coaxial and data cables in long-haul applications, but these cable types retain roles in last-mile broadband, commercial audiovisual systems, and mobile backhaul. Vocus expects its Sydney-to-Melbourne ducted fiber route to be ready for service in 2029. This indicates that the backbone fiber build cycle will continue beyond current projects. Belden and Corning compete in structured data and fiber segments, where installed ecosystems, certifications, and patch-panel compatibility can influence supplier selection. The Australia wire and cable market remains tied to both power system upgrades and the expansion of digital networks.
By Conductor Material, Aluminum Economics Become Compelling
Copper is expected to account for 50.98% of revenue in 2025 and remain the leading conductor material. Its conductivity, solderability, and established use in building wire, EV circuits, and dense data cabling support its position. Aluminum is projected to be the fastest-growing conductor material, with a 7.31% CAGR through 2031. The copper-to-aluminum price ratio is expected to reach 4.3 in January 2026, increasing aluminum’s cost advantage in large power and transmission applications. Prysmian reported that aluminum represented 40% of its product mix by weight. This supplier shift reflects stronger demand for both grid resilience and data center infrastructure. Copper remains important where compact size and high conductivity are required.
Optical glass and polymer conductors support increased fiber-optic deployment. Hyperscale interconnects and long-distance backbone networks are specifying higher fiber counts. AS/NZS 1660.5 testing standards influence material choices in cables with low-smoke, zero-halogen insulation. This creates demand for halogen-free copper and aluminum cables in enclosed settings such as tunnels, airports, and data halls. Copper is expected to retain a substantial share of the Australia wire and cable market, but material selection increasingly depends on total installation cost. Buyers assess cable diameter, termination equipment, installation labor, and operating requirements alongside metal prices. Aluminum can be attractive for transmission and generation interconnections with cross sections above 35 mm². The shift does not eliminate copper demand, but it changes the material mix used in large projects.
By Installation, Submarine Demand Rises With Interconnectors and Data Cables
Overhead installation is expected to account for 39.11% of revenue in 2025, the largest share across installation methods. It remains the standard approach for long-distance transmission corridors where route economics favor overhead lines. Submarine cable is projected to register the fastest growth, at a 6.66% CAGR through 2031. This growth reflects the parallel build-out of HVDC power interconnectors and high-capacity fiber networks. Marinus Link requires 255 km of submarine HVDC cable across Bass Strait and 90 km of underground cable in Gippsland. The Australian Energy Regulator is expected to approve AUD 3.47 billion (USD 2.22 billion) for the Stage 1 cable construction program in February 2026.
Underground installation is the second-fastest-growing method. It serves dense city networks, data center connections, and the land-based section of Marinus Link. Community concerns over overhead infrastructure and bushfire exposure can also favor underground works in selected urban corridors. Sydney grid reinforcement and Melbourne cable replacement activity support medium- and high-voltage XLPE demand in the 33 kV to 132 kV range. The Firmus and SUBCO partnership announced Bernacchi-1, a subsea fiber connection between Tasmania and the SMAP mainland system. The project shows that marine routes can carry both energy and communications infrastructure. The Australia wire and cable market benefits when power and data projects use the same regional corridors. Installation choices will continue to depend on terrain, route approvals, safety, cost, and network design.
By End-User Vertical, Power Infrastructure Leads While Telecom Accelerates
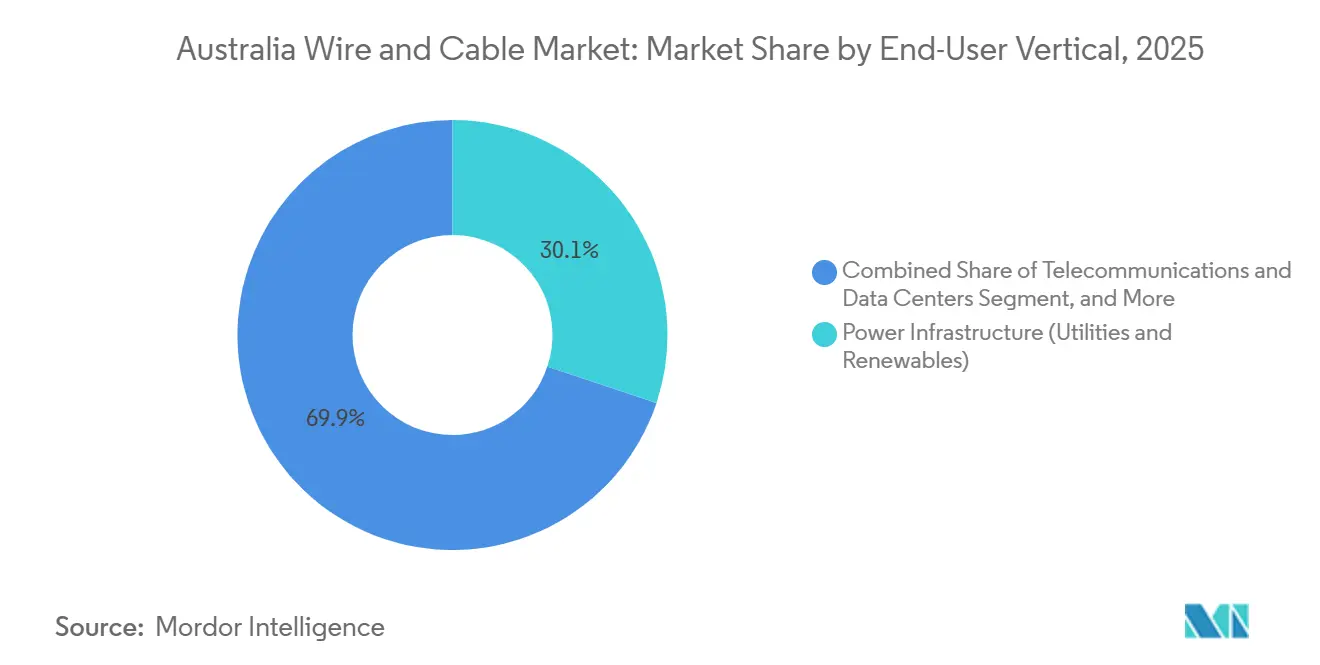
Power infrastructure, utilities, and renewables are expected to account for 30.12% of end-user revenue in 2025. This position reflects the scale of grid rebuilding, renewable generation connections, and network replacement work. Telecommunications and data centers are projected to expand at the highest rate, with a 5.98% CAGR through 2031. The segment gains from new fiber routes and the power systems required by colocated digital facilities. Telstra and Google announced a partnership covering Telstra’s 14,000 km Aura Network and capacity on Google’s Tabua, Proa, and Bulikula subsea systems. This arrangement connects terrestrial and submarine network infrastructure across Australia. Corporate fleet and government transit electrification also support automotive and mobility demand through medium-voltage service upgrades at depot sites.
Residential and commercial construction provide a large volume base for low-voltage building wire and data cable. Housing and commercial projects in New South Wales, Victoria, and Queensland create recurring demand, even when purchases remain price-sensitive. NCC 2025 requires EV charging provisions in new Class 2 to 9 buildings, including dedicated distribution boards and cable runs to car spaces. Oil and gas and petrochemicals maintain demand through replacement cycles and limited LNG expansion activity in Western Australia and Queensland. Industrial manufacturing also requires control and trailing cables for process industries and mining. Znergy Cable and Bambach Wires and Cables serve specialized mining and industrial requirements. Therefore, the Australia wire and cable market has a broad user base, although the largest contracts are concentrated in energy and communications infrastructure.
By Insulation, Insulated Cables Dominate Across Applications
Insulated cables are expected to account for 78.98% of revenue in 2025, reflecting safety requirements across power, data, and control applications. The segment is also projected to grow at a 6.99% CAGR through 2031. This combination shows that insulated systems are expanding from an already large base. The transition from PVC to XLPE and low-smoke, zero-halogen compounds supports the segment in fire-sensitive applications. Tunnels, high-rise buildings, and underground data facilities are key settings where enhanced insulation is specified. AS/NZS 5000.1 and AS/NZS 3013 set requirements for fire-rated cable in Australia. NCC 2025 has reinforced the focus on compliant cable systems in enclosed building environments.
Non-insulated cable is mainly used in overhead transmission, where bare ACSR and AAC conductors provide a lower-cost option for long routes. These conductors remain important for high-voltage systems that do not require underground installation. Their revenue base faces pressure where urban distribution networks replace overhead spans with underground systems. Suppliers make different choices across the insulation split. Low-smoke, zero-halogen fire-rated cable can support premium pricing and longer specification cycles. A bare overhead conductor is more exposed to commodity pricing and import competition. The Australia wire and cable market continues to favor insulated products because their use spans most building, industrial, and digital infrastructure applications. Non-insulated products retain a durable role in long-distance grid corridors.
Geography Analysis
New South Wales holds the largest share of national cable demand, supported by major data center campuses, transmission projects, and dense urban electricity networks. The state includes the Central-West Orana, South West, and New England Renewable Energy Zones. Rewiring the Nation directed AUD 4.7 billion (USD 3.01 billion) in priority transmission investment to New South Wales and an additional AUD 1.4 billion (USD 896 million) through the Renewable Energy Transformation Agreement. This investment supports demand for high-voltage cable, substations, and associated distribution equipment. The eastern seaboard, including New South Wales, Victoria, and Queensland, accounted for more than 70% of national cable consumption, driven by population concentration, industrial activity, and data infrastructure. Victoria represents the second-largest state demand pool. Marinus Link civil works, HumeLink’s 365 km cable route, and related network development programs support the state’s project base.
Queensland adds demand through mining electrification, grid replacement, and data center expansion in Brisbane. Powerlink’s 10-year pipeline includes high-voltage cable, overhead conductor, and substation replacement work across northern and southeastern networks. Western Australia is the fastest-growing state demand center outside the eastern seaboard. The state received a federal allocation of AUD 3 billion (USD 1.92 billion) to upgrade the North West and South West Interconnected Systems. The Karrinyup bus depot electrification program also added cable requirements across fleet charging and distribution systems. The Northern Territory and South Australia contribute smaller but growing volumes through grid expansion, substation upgrades, and interconnector-related work.
Australia is a net importer of finished wire and cable products, which links local project activity to international production capacity. China supplied 59% of the value of insulated wire and cable imports, increasing Australia’s exposure to changes in shipping, pricing, and lead times. Domestic infrastructure demand supports the Australia wire and cable market, but this spending does not automatically boost local manufacturing output. Rewiring the Nation has committed more than AUD 7 billion (USD 4.48 billion) in CEFC-allocated financing across New South Wales, Victoria, and Tasmania. The funding concentrates activity in eastern states, with additional effects in Western Australia through federal co-investment. Geographic demand will remain concentrated in areas where grid investment, data infrastructure, construction activity, and major industrial loads overlap.
Competitive Landscape
The Australia wire and cable market remains moderately fragmented in general manufacturing, while high-specification projects remain concentrated among global suppliers. Prysmian and Nexans serve the premium end of the market through high-voltage, HVDC, and subsea manufacturing capabilities. Prysmian reported revenue of EUR 19,650 million (USD 21.2 billion) in 2025. Its EUR 600 million (USD 654 million) Marinus Link cable supply and installation contract strengthens its position in Australia’s highest-value cable projects. Nexans reported EUR 6.1 billion (USD 6.6 billion) in 2025 standard sales and an adjusted EBITDA margin of 11.9%. These suppliers have capabilities that domestic competitors cannot easily replicate for subsea and high-voltage projects.
NKT is building capacity that could strengthen future competition for Australian subsea and high-voltage work. The company outlined EUR 2 billion (USD 2.16 billion) of investment from 2025 to 2028 in high- and medium-voltage capacity and a new cable-laying vessel. Mid-tier and domestic providers are active in industrial, building, and low- to medium-voltage applications. Znergy Cable uses Australian engineering with offshore manufacturing to serve mining and infrastructure specifications. Bambach Wires and Cables maintains a position as a specialist in industrial cable. Electra Cables renewed its Green Star certification in October 2024, supporting its positioning in construction projects that use sustainability procurement criteria. Competition in these categories depends on product compliance, response time, distribution coverage, and project service.
Prysmian acquired Warren and Brown in 2024 to expand its Australian telecommunications connectivity offering. The acquisition adds local connectivity expertise and service revenue that can sustain during periods between major project awards. Prysmian’s Marinus Link contract also shows how suppliers can secure long-duration work by combining manufacturing capacity with installation capability. Nexans is directing its portfolio toward higher-margin electrification work, supported by its 2025 financial results. Domestic manufacturers can compete when they meet the requirements of AS/NZS 1429.1 and deliver faster for smaller projects. However, large HVDC and subsea awards still favor firms with established certified factories and specialized installation assets. As a result, the competitive structure remains broad in standard products but more concentrated in complex transmission projects.
Australia Wire and Cable Industry Leaders
Southwire Company, LLC
Belden Inc.
NKT A/S
Nexans Australia Holdings Pty Ltd
Prysmian S.p.A.
- *Disclaimer: Major Players sorted in no particular order

Recent Industry Developments
- July 2026: Vocus launched the Australian Digital Infrastructure Platform and announced Australia’s first ducted long-haul fiber route between Sydney and Melbourne at AUD 500 million, USD 346 million, capable of accommodating 6,912 fiber cores and expected to be ready for service in 2029.
- June 2026: SUBCO brought the SMAP submarine cable system into service, connecting Sydney, Melbourne, Adelaide, and Perth via a 5,000 km, fully armored, 16-fiber-pair hypercable, adding more than 400 Tbit/s of transcontinental capacity.
- June 2026: Firmus Technologies and SUBCO announced Bernacchi-1, a new submarine fiber-optic cable connecting Tasmania to the SMAP mainland network, Tasmania’s first new subsea fiber connection in more than 20 years, expected operational in Q2 2027.
- May 2026: The Clean Energy Finance Corporation announced AUD 1.2 billion, USD 768 million, from the Rewiring the Nation Fund for Northwest Transmission Developments in Tasmania, covering 130 km of new and upgraded transmission infrastructure supporting Marinus Link Stage 1.


Australia Wire and Cable Market Report Scope
The Australia Wire and Cable Market Report is Segmented by Voltage (Extra-and High-Voltage [Greater Than 35 kV], Medium-Voltage [1–35 kV], and Low-Voltage [Less Than 1 kV]), Cable Type (Power Cable, Fiber-Optic Cable, Signal and Control Cable, and Coaxial and Data Cable), Conductor Material (Copper, Aluminum, and Optical Glass / Polymer), Installation (Overhead, Underground, and Submarine), End-User Vertical (Residential Construction, Commercial Construction, Power Infrastructure, Telecommunications and Data Centers, Oil and Gas and Petrochemicals, Automotive and Mobility, and Industrial Manufacturing), and Insulation (Insulated, and Non-Insulated). The Market Forecasts are Provided in Terms of Value (USD).
| Extra- and High-Voltage (Greater Than 35 kV) |
| Medium-Voltage (1–35 kV) |
| Low-Voltage (Less Than 1 kV) |
| Power Cable |
| Fiber-Optic Cable |
| Signal and Control Cable |
| Coaxial and Data Cable |
| Copper |
| Aluminum |
| Optical Glass / Polymer |
| Overhead |
| Underground |
| Submarine |
| Residential Construction |
| Commercial Construction |
| Power Infrastructure (Utilities and Renewables) |
| Telecommunications and Data Centers |
| Oil and Gas and Petrochemicals |
| Automotive and Mobility |
| Industrial Manufacturing |
| Insulated |
| Non-Insulated |
| By Voltage | Extra- and High-Voltage (Greater Than 35 kV) |
| Medium-Voltage (1–35 kV) | |
| Low-Voltage (Less Than 1 kV) | |
| By Cable Type | Power Cable |
| Fiber-Optic Cable | |
| Signal and Control Cable | |
| Coaxial and Data Cable | |
| By Conductor Material | Copper |
| Aluminum | |
| Optical Glass / Polymer | |
| By Installation | Overhead |
| Underground | |
| Submarine | |
| By End-User Vertical | Residential Construction |
| Commercial Construction | |
| Power Infrastructure (Utilities and Renewables) | |
| Telecommunications and Data Centers | |
| Oil and Gas and Petrochemicals | |
| Automotive and Mobility | |
| Industrial Manufacturing | |
| By Insulation | Insulated |
| Non-Insulated |


Key Questions Answered in the Report
What is the Australia wire and cable market size?
The Australia wire and cable market size was USD 0.85 billion in 2026 and is forecast to reach USD 1.1 billion by 2031 at a 5.29% CAGR.
What is driving demand for wire and cable in Australia?
Transmission upgrades, Renewable Energy Zones, fiber routes, data center projects, building electrification, and fleet charging are supporting demand.
Which voltage category is growing fastest in Australia?
Extra- and high-voltage cables are projected to expand at a 7.11% CAGR through 2031 because of interconnector and grid investment.
Why is aluminum gaining use in cable systems?
Aluminum is projected to grow at a 7.31% CAGR through 2031 as its cost position improves for large power and transmission applications.
Which end user creates the most cable demand?
Power infrastructure, utilities, and renewables held 30.12% of end-user revenue in 2025, while telecommunications and data centers are the fastest-growing verticals.
What limits delivery in the Australia wire and cable market?
Dependence on imported HVDC, subsea, and large XLPE cable can create 18-to-36-month lead times, while certification requirements reduce the available supplier pool.
Page last updated on:





