Australia Global Capability Centers Market Size and Share
Market Overview
| Study Period | 2020 - 2031 |
|---|---|
| Forecast Data Period | 2026 - 2031 |
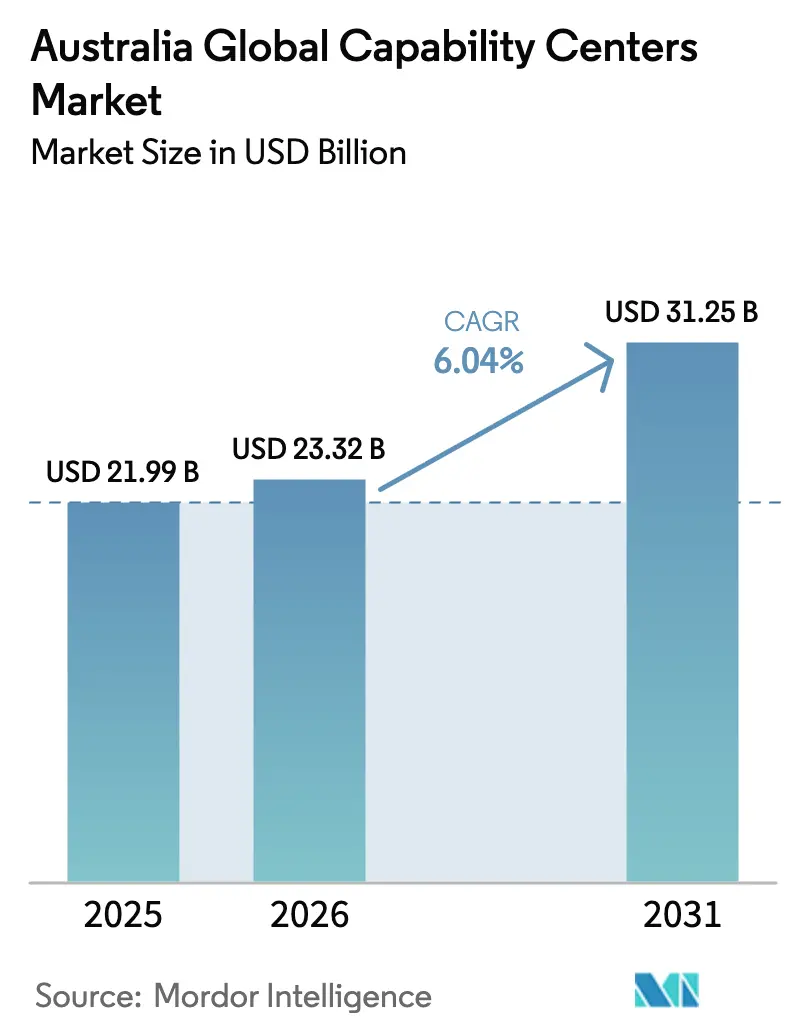
| Base Year Market Size (2025) | USD 21.99 Billion |
| Market Size (2026) | USD 23.32 Billion |
| Market Size (2031) | USD 31.25 Billion |
| Growth Rate (2026 - 2031) | 6.04% CAGR |
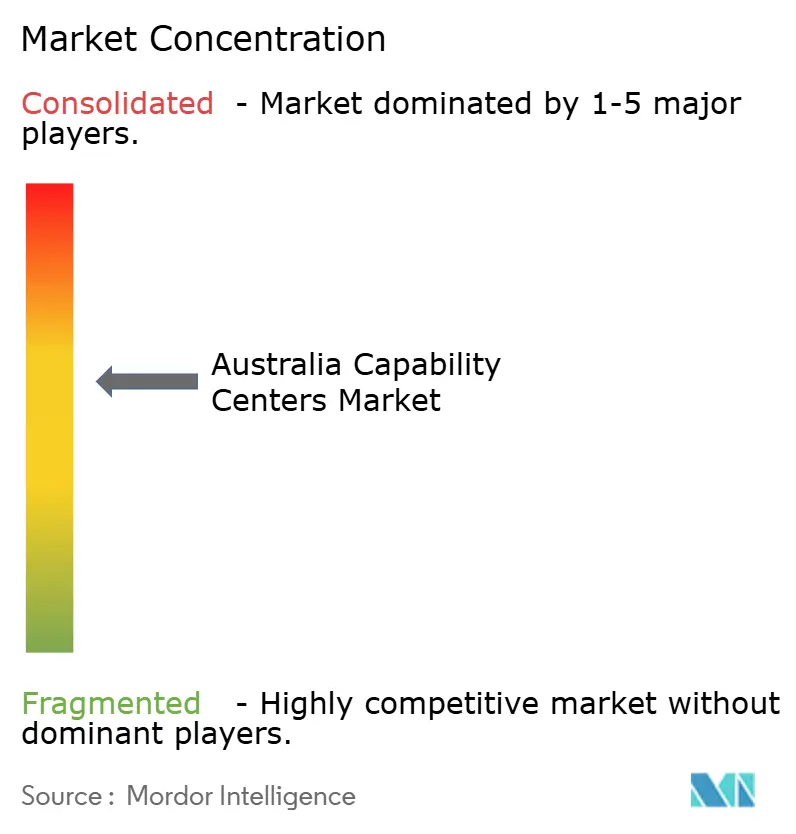
| Market Concentration | Medium |
Major Players *Disclaimer: Major Players sorted in no particular order Image © Mordor Intelligence. Reuse requires attribution under CC BY 4.0. | |
Australia Global Capability Centers Market Analysis by Mordor Intelligence
The Australia Global Capability Centers market size in 2026 is estimated at USD 23.32 billion, growing from 2025 value of USD 21.99 billion with 2031 projections showing USD 31.25 billion, growing at 6.04% CAGR over 2026-2031. Robust digital infrastructure, generous technology incentives, and a deep pool of science and engineering talent position Australia as a premier hub for complex shared services that increasingly emphasize R&D, analytics, and regulated industry support. Fresh funding through the Future Made in Australia initiative, large-scale cloud investments by hyperscalers, and strong time-zone alignment with North America draw multinational enterprises to establish or scale their capability footprints. Concurrently, a decisive shift toward hybrid work unlocks regional talent, while ESG-linked nearshoring mandates nudge firms to locate operations in jurisdictions with cleaner power grids and transparent governance. Wage inflation and immigration policies remain headwinds, but ongoing incentives for quantum, AI, and renewable-energy projects partially offset cost pressures for technology-intensive Global Capability Centers.
Key Report Takeaways
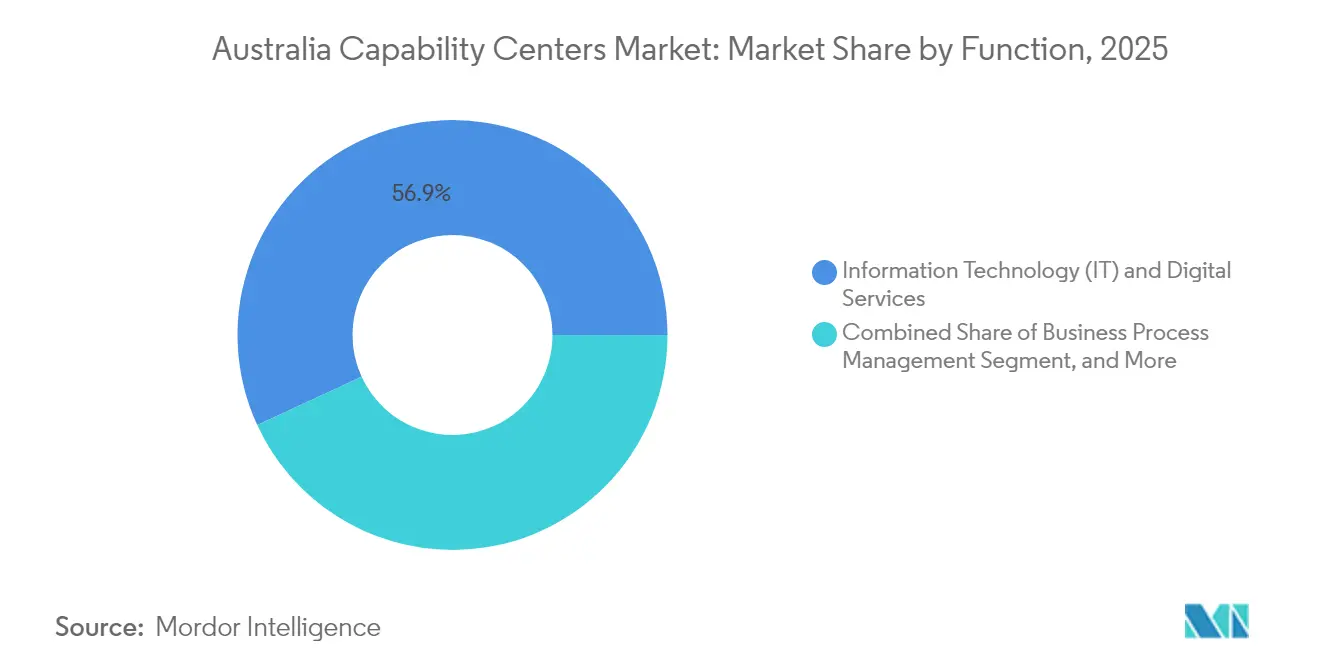
- By function, Information Technology and Digital Services led with 56.87% of Australia's Global Capability Centers market share in 2025; Knowledge Process Outsourcing is projected to register a 6.58% CAGR through 2031.
- By engagement model, the captive in-house segment held 60.05% share of the Australia Global Capability Centers market size in 2025, while hybrid build-operate-transfer arrangements are set to advance at a 7.02% CAGR over 2026-2031.
- By organization size, large enterprises commanded 88.12% revenue share in 2025; small and medium enterprises are forecast to expand at an 8.07% CAGR to 2031.
- By industry vertical, banking, financial services, and insurance accounted for 36.42% of the Australia Global Capability Centers market share in 2025, whereas healthcare and life sciences are poised to grow at the fastest rate, with a 6.38% CAGR through 2031.
Note: Market size and forecast figures in this report are generated using Mordor Intelligence’s proprietary estimation framework, updated with the latest available data and insights as of 2026.
Australia Global Capability Centers Market Trends and Insights
Drivers Impact Analysis*
| Driver | (~) % Impact on CAGR Forecast | Geographic Relevance | Impact Timeline |
|---|---|---|---|
| Increasing Digital Transformation by Australian Enterprises | +1.8% | National, with concentration in Sydney, Melbourne, Brisbane | Medium term (2-4 years) |
| Rising Demand for Time-Zone Advantage to Support North American Operations | +1.2% | Global, particularly benefiting Sydney and Melbourne operations | Short term (≤ 2 years) |
| Government Grants for Advanced Manufacturing and R&D | +0.9% | National, with a focus on Queensland, NSW, Victoria | Long term (≥ 4 years) |
| Growing Pool of STEM Graduates from Australian Universities | +0.7% | National, concentrated in major metropolitan areas | Long term (≥ 4 years) |
| Shift to Hybrid Work: Unlocking Regional Talent in Australia | +0.5% | Regional Australia, extending to tier-2 and tier-3 cities | Medium term (2-4 years) |
| ESG-Linked Nearshoring Mandates from Global Corporations | +0.4% | Global, with emphasis on APAC and North American multinationals | Medium term (2-4 years) |
| Source: Mordor Intelligence | |||
Increasing Digital Transformation by Australian Enterprises
Digital adoption has become mission-critical for Australian firms, with 93% of businesses reporting accelerated initiatives since 2023. Large banks and retailers allocate substantial budgets to cloud-native platforms, AI governance, cybersecurity, and data-driven customer engagement, driving demand for high-skill software engineering, DevSecOps, and data science at their Global Capability Centers. ANZ’s forthcoming Brisbane technology hub, expected to employ 700 professionals within five years, illustrates how in-country transformation projects seed specialized delivery centers that also serve wider Asia-Pacific mandates. Government funding of USD 26.8 million (AUD 40 million) for responsible AI programs further positions Australia as a trusted venue for AI development. The need for sovereign cloud controls, combined with a predicted shortfall of 300,000 tech workers by 2030,[1]Information Age, “One million workers could be reskilled for tech,” ia.acs.org.au prompts enterprises to establish local capability centers quickly to secure scarce talent and comply with tightening data-residency rules.
Rising Demand for Time-Zone Advantage to Support North American Operations
Follow-the-sun service models hinge on seamless 24-hour coverage. Australian locations bridge the daylight gap between Asia and North America, enabling a single Global Capability Center to address real-time incident response, agile sprint hand-offs, or after-hours treasury workflows for U.S. parent entities.[2]Department of Home Affairs, “Mobility Arrangement for Talented Early-professionals Scheme,” homeaffairs.gov.au Mature capital markets, which manage USD 5.3 trillion in assets, create fertile ground for global banks setting up risk, compliance, and trading-platform support desks. The 99.3% national loan-repayment rate reinforces credit risk stability, encouraging institutions to deploy clearing, settlement, and regulatory technology teams in Sydney or Melbourne. When synchronized with Vancouver or San Francisco offices, Australian Global Capability Centers reduce deployment latency for DevOps pushes and enhance customer support responsiveness across three continents.
Government Grants for Advanced Manufacturing and R&D
Targeted incentives power the next wave of research-oriented Global Capability Centers. The Hydrogen Production Tax Incentive, worth an estimated USD 1.34 per kilogram (AUD 2), and a 10% refundable credit for critical-mineral processing lower capital costs for corporates commercializing clean-energy IP. Queensland’s USD 629.8 million (AUD 940 million) co-investment with PsiQuantum to build fault-tolerant quantum computers exemplifies large-scale commitments that pull allied engineering, firmware, and cryogenic-supply-chain expertise into colocated capability centers.[3]Department of Industry, Science and Resources, “State of Australian quantum report 2024,” industry.gov.au Meanwhile, the R&D Tax Incentive, refunding up to 43.5% of eligible expenditure, raises post-tax yields on innovation projects, giving multinationals compelling economic reasons to base design, prototyping, and pilot production in Australia rather than offshore.
Growing Pool of STEM Graduates from Australian Universities
Universities and research institutes graduate approximately 2 million STEM students annually, ranking the country among the top four OECD peers in talent attraction. Flagship institutions in Sydney, Melbourne, and Brisbane appear in global top-100 lists for AI and biomedical disciplines, producing job-ready cohorts for Global Capability Center analytics, bio-informatics, or med-tech functions. Microsoft’s Datacentre Academy, in collaboration with TAFE NSW, addresses operational skills for critical facilities, while industry-university collaborations channel doctoral research into enterprise use cases. Although IT enrollments dipped 10% in 2022, the breadth of interdisciplinary science ensures a strong pipeline for quantum algorithms, advanced materials, and clean-energy domains, all in rising demand across new-age capability centers.
Restraints Impact Analysis*
| Restraint | (~) % Impact on CAGR Forecast | Geographic Relevance | Impact Timeline |
|---|---|---|---|
| High Wage Inflation in Tier-1 Australian Cities | -1.5% | Sydney, Melbourne, Brisbane, Perth | Short term (≤ 2 years) |
| Stringent Immigration Policies Limiting Foreign Talent Inflow | -0.8% | National, affecting all major Global Capability Center locations | Medium term (2-4 years) |
| Rising Cybersecurity Compliance Costs | -0.6% | National, with a higher impact on financial services, Global Capability Centers | Short term (≤ 2 years) |
| Competition from Emerging Asia Pacific Global Capability Center Destinations | -0.4% | Regional competition affecting APAC-focused Global Capability Centers | Long term (≥ 4 years) |
| Source: Mordor Intelligence | |||
High Wage Inflation in Tier-1 Australian Cities
Median technology salaries hit USD 87,100 (AUD 130,000) in 2025, outpacing national wage growth by 33%. Scarce cybersecurity and cloud architects command premiums of 30%, tightening labor budgets for new or scaling Global Capability Centers. Office occupancy costs in premium CBD towers increased by 1.7% in Sydney and 1.6% in Melbourne during Q4 2024, as incentives declined and tenants competed for prime space.[4]Savills, “Savills Australia,” savills.com.hk With active tech job seekers forming less than 20% of the workforce, retention has become a strategic imperative. High wages erode traditional savings of relocating mid-tier work from North America to Australia, compelling enterprises to move toward smaller, domain-specialized pods or to hybridize roles across onshore and nearshore teams.
Stringent Immigration Policies Limiting Foreign Talent Inflow
Skills-linked visas now require a base earnings of USD 90,450 (AUD 135,000) for specialist roles, while core-skills permits start at USD 49,010 (AUD 73,150) and are indexed annually. Permanent migration ceilings for skilled-independent entrants fell by 44% for 2024-25, squeezing supply at a time when Global Capability Centers need quantum scientists, AI ethicists, and multilingual actuarial analysts. The closure of investment-linked migration programs removes a finance-heavy relocation route, and higher student visa charges risk shrinking the international graduate pipeline. Together, these policies raise recruitment lead times, drive up compensation packages, and oblige companies to intensify domestic upskilling, which may delay project timelines for complex Global Capability Center builds.
*Our forecasts treat driver/restraint impacts as directional, not additive. The impact forecasts reflect baseline growth, mix effects, and variable interactions.
Segment Analysis
By Function / Capability: IT Services Anchor a Shift Toward High-Value Work
Information Technology and Digital Services accounted for 56.87% of Australia Global Capability Centers' market revenue in 2025, providing the backbone for enterprise cloud migrations, DevOps pipelines, and cybersecurity operations. As multinationals modernize monolithic architectures, Global Capability Centers handle microservices refactoring, managed AI platforms, and zero-trust frameworks at scale. Government-backed AI governance funding and hyperscale cloud expansions, such as Microsoft’s USD 3.35 billion (AUD 5 billion) data-center build-out, further enlarge digital workloads funneled into in-country teams. Enhanced compliance regimes in financial services also broaden the remit of technology Global Capability Centers to encompass fraud analytics, AML monitoring, and regulatory reporting.
Knowledge Process Outsourcing, although smaller today, is projected to grow at 6.58% as data-intensive functions, investment research, ESG advisory, and actuarial modeling seek talent with dual domain and analytics skill sets. Engineering and R&D clusters flourish around AUD 1 billion (USD 670 million) in National Reconstruction Fund allocations for critical technologies, with projects in quantum photonics, battery chemistry, and hydrogen catalysis being channeled to centers in Brisbane and Adelaide. Business Process Management remains viable for complex, regulated workflows, but faces headwinds from generative AI automation, prompting players like TCS to retool call-center teams into conversational AI trainers.


By Engagement Model: Hybrids Bridge Control and Speed
Captive in-house centers accounted for 60.05% of 2025 revenue, primarily driven by banks, insurers, and miners seeking full IP control and regulated data stewardship within domestic borders. In practice, the Australian Global Capability Centers market now sees captives blending internal squads with managed-service overlays to defray ballooning wage bills. Technology stack ownership, cybersecurity accountability, and long-term talent pipelines justify captives for high-sensitivity domains, such as algorithmic trading or confidential research and development.
Hybrid build-operate-transfer structures are expanding at the fastest rate, with a 7.02% CAGR, as companies seek to shorten their time-to-value while sharing risk with seasoned integrators. Australia Post’s five-provider panel and Cognizant’s reward-sharing deal with Telstra illustrate models where commercial liability and productivity outcomes are co-owned. Traditional BOT deals persist, but savvy enterprises increasingly stagger equity transfers, retaining golden-share governance or dual-key data access to satisfy both internal audit and external regulator demands. Pure outsourcing declines as CIOs migrate commodity workloads to SaaS and insource core platforms for greater strategic leverage.
By Organization Size: Enterprise Spend Dominates, SMEs Pick Up Pace
Large enterprises captured 88.12% of 2025 spending, as Fortune 500 banks, resource majors, and global retailers funneled multi-year capital toward multi-tower Global Capability Center footprints in Sydney, Melbourne, and Brisbane. For big buyers, Australia serves less as a cost-takeout site and more as a hub for complex product engineering, regulatory reporting, and high-availability support in the Australia Global Capability Centers market. Board-level concerns about data sovereignty, ESG compliance, and intellectual property leakage reinforce the logic for sizable captive or hybrid centers over lower-cost offshore vendors.
Small and medium enterprises are set to log an 8.07% CAGR on the back of cloud-native toolchains, consumption-based pricing from hyperscalers, and government commercialization grants of up to USD 670 million (AUD 1 billion) for critical-tech innovators. Fractional Global Capability Center solutions, co-working labs coupled with managed talent pools, help SMEs circumvent seven-figure set-up costs and compete for niche skills. Yet, salary inflation disproportionately impacts SMEs, prompting some to adopt satellite models in regional Australia, where wages are 15-20% below CBD averages and state governments offer payroll tax rebates.

By Industry Vertical: Financial Services Rule, Healthcare Accelerates
The banking, financial services, and insurance cohort accounted for 36.42% of the Australia Global Capability Centers' market revenue in 2025. Unified risk data lakes, real-time payments, and compliance with capital adequacy standards necessitate the establishment of domestic technology centers. ASX’s decision to deploy TCS BaNCS clearing technology underscores the scale of modernization underway in capital-markets infrastructure. Insurers rely on Australia-based actuarial modeling to satisfy prudential regulators and exploit rich national health datasets for product innovation.
The healthcare and life sciences sector is expected to deliver a 6.38% CAGR, buoyed by more than 55 medical institutes and streamlined clinical trial approvals. AI-assisted diagnostics, pharmacovigilance analytics, and gene therapy pipeline management represent high-growth workloads at the Global Capability Center. Quantum computing pilots in drug-molecule simulation, backed by the Queensland government’s quantum strategy, further sharpen Australia’s competitive edge. Manufacturing, e-commerce, and telecoms each contribute steady volumes, leveraging digital twin engineering, supply chain visibility, and omnichannel experience platforms housed in Australian Global Capability Centers.
Geography Analysis
Sydney anchors the Australian Global Capability Centers market, with a concentration in its Tech Central district, a significant ecosystem employing 100,000 professionals across nearly 4,300 firms. The precinct offers dense fiber connectivity, Tier IV data centers, and adjacency to top universities, attracting global cloud vendors and fintechs. Melbourne trails closely, presenting 10-15% lower average Grade-A office rents and a comparable STEM talent pool fed by the University of Melbourne, Monash, and RMIT. Financial services players capitalize on the city’s tram-enabled 20-minute commute patterns to enhance employee experience and retention.
Brisbane is projected to post the sharpest growth momentum for 2026-2031, following landmark investments such as the USD 629.8 million quantum-computing facility and commitments from ANZ to hire 700 technologists locally. New rail links and suburban fiber upgrades expand catchment areas for employers tapping outer-metro talent. Perth and Adelaide carve specialized niches: Perth aligns with mining-tech Global Capability Centers serving global iron-ore majors, while Adelaide houses defense-AI research clusters supported by the Australian Institute for Machine Learning.
Tier-2 and Tier-3 regional hubs, from Newcastle to Hobart, gain relevance as hybrid work policies spread employment beyond major cities. State payroll-tax concessions, co-funded training, and migration agreements such as Western Australia’s Designated Area Migration Authorization collectively reduce operating costs by 12-18% relative to Sydney benchmarks. Nonetheless, regional data-center capacity and international subsea-cable reach lag, steering latency-sensitive workloads back to East Coast metros.
Competitive Landscape
The Australia Global Capability Centers market is moderately fragmented, with no single vendor exceeding a double-digit share. Indian majors TCS, Infosys, Wipro, and HCL Technologies, which wield global delivery frameworks and price advantages, must localize their delivery to comply with stricter Australian data and labor regulations. Multinational consultancies, including Accenture, Capgemini, IBM, and Cognizant, capitalize on transformation mandates by bundling strategic design with managed run services. Meanwhile, Australian corporates such as BHP, Commonwealth Bank, ANZ, Woolworths, and Telstra are fortifying their internal Global Capability Centers to safeguard intellectual capital.
Technology leadership is a primary differentiator. TCS is linked with Macquarie University to research AI in finance, creating postgraduate scholarships and internship pathways. Cognizant partnered with Telstra on a five-year, risk-share model to turbo-charge agile engineering and AI ops. Providers also invest in quantum computing, ESG analytics, and net-zero consulting to capitalize on future-ready demand opportunities. Talent scarcity and wage growth spur fierce recruitment competition, with sign-on bonuses and employee-stock grants becoming mainstream retention levers.
Regulatory scrutiny over critical-infrastructure sovereignty shapes vendor strategy. Firms increase their staffing ratios for Australian citizens or permanent residents, localize cloud regions, and seek IRAP or ISO 27001 certifications to reassure financial services and public sector clients. As new entrants explore Australia to move closer to Western clients amid rising geopolitical tensions, existing players are doubling down on automation and generative AI accelerators to maintain gross margin targets.
Australia Global Capability Centers Industry Leaders
Accenture Australia Pty Ltd
Tata Consultancy Services Australia Pty Ltd
Cognizant Technology Solutions Australia Pty Ltd
Capgemini Australia Pty Ltd
IBM Australia Ltd
- *Disclaimer: Major Players sorted in no particular order

Recent Industry Developments
- October 2025: Commonwealth Bank has completed the migration of its entire core banking system to Amazon Web Services, representing one of the largest cloud transformations globally and positioning the bank to deliver enhanced digital banking capabilities with improved scalability and resilience.
- August 2025: Accenture announced the acquisition of CyberCX, Australia's largest cybersecurity services provider, for over AUD 1 billion (USD 670 million), adding approximately 1,400 cybersecurity professionals and significantly expanding Accenture's security operations capabilities across Australia and New Zealand.
- August 2025: Infosys announced the acquisition of a 75% stake in Telstra's Versent Group for USD 233 million, with Telstra retaining a 25% ownership stake. This creates a strategic partnership that combines Versent's cloud engineering expertise with Infosys's global delivery capabilities to serve Australian and international clients.
- August 2025: Commonwealth Bank and OpenAI have announced an Australia-first strategic partnership to deliver AI-powered solutions across retail, business, and institutional banking operations, positioning CBA to leverage generative AI for customer service, risk management, and operational efficiency improvements.


Australia Global Capability Centers Market Report Scope
The scope of the global capability center study for the market segmentation by the Function/Capability for (i) Information Technology (IT) and Digital Services segment is limited to Software Development, Cloud and Infrastructure Management, Cybersecurity, Data Analytics and AI/ML; (ii) Engineering / ER&D segment is limited to Product Design and Testing, Embedded Systems, Digital Twin / Simulation; (iii) Business Process Management (BPM) segment is limited to Finance and Accounting, HR, Payroll and Talent Management, Procurement, Customer Service; and (iv)Knowledge Process Outsourcing (KPO) segment is limited to Market Research and Insights, Risk and Compliance, Legal and Regulatory Support, Strategy and Consulting Support. Similarly, for segmentation by the Engagement Model, scope for (i) Hybrid Build-Operate-Transfer (BOT) is limited to Joint Venture / Strategic Partnership and Virtual Captive Model. The rest of the segment scope is as specified for the listed segment.
| Information Technology (IT) and Digital Services |
| Engineering / ER&D |
| Business Process Management (BPM) |
| Knowledge Process Outsourcing (KPO) |
| Captive (Self-Build)/ In-house |
| Build-Operate-Transfer (BOT) |
| Hybrid Build-Operate-Transfer (BOT) |
| Large Enterprises |
| Small and Medium Enterprises (SMEs) |
| Banking, Financial Services, and Insurance (BFSI) |
| Telecom and IT |
| Healthcare and Life Sciences |
| Manufacturing, Automotive and Industrial |
| Retail and Consumer Goods |
| Other Industry Verticals |
| By Function/Capability | Information Technology (IT) and Digital Services |
| Engineering / ER&D | |
| Business Process Management (BPM) | |
| Knowledge Process Outsourcing (KPO) | |
| By Engagement Model | Captive (Self-Build)/ In-house |
| Build-Operate-Transfer (BOT) | |
| Hybrid Build-Operate-Transfer (BOT) | |
| By Organization Size | Large Enterprises |
| Small and Medium Enterprises (SMEs) | |
| By Industry Vertical | Banking, Financial Services, and Insurance (BFSI) |
| Telecom and IT | |
| Healthcare and Life Sciences | |
| Manufacturing, Automotive and Industrial | |
| Retail and Consumer Goods | |
| Other Industry Verticals |


Key Questions Answered in the Report
How large is the Australia Global Capability Centers market in 2026?
It was valued at USD 23.32 billion in 2026 and is expected to reach USD 31.25 billion by 2031.
What is the projected growth rate for capability centers in Australia?
The market is forecast to grow at a 6.04% CAGR over 2026-2031.
Which industry vertical accounts for the largest share of capability-center spending?
Banking, financial services, and insurance held 36.42% of spending in 2025.
Why are hybrid build-operate-transfer models gaining popularity?
Firms want to balance IP control with faster deployment and risk sharing, leading to a 7.02% CAGR for hybrid models.
Which cities attract the most multinational Global Capability Center investments?
Sydney, Melbourne, and Brisbane dominate due to top-tier digital infrastructure, talent density, and government incentives.
What key risk could slow Global Capability Center expansion in Australia?
Wage inflation in tier-1 cities, where median tech salaries exceed USD 87,000 annually, poses a near-term cost challenge.
Page last updated on:


