Australia Contract Logistics Market Size and Share
Market Overview
| Study Period | 2020 - 2031 |
|---|---|
| Forecast Data Period | 2026 - 2031 |
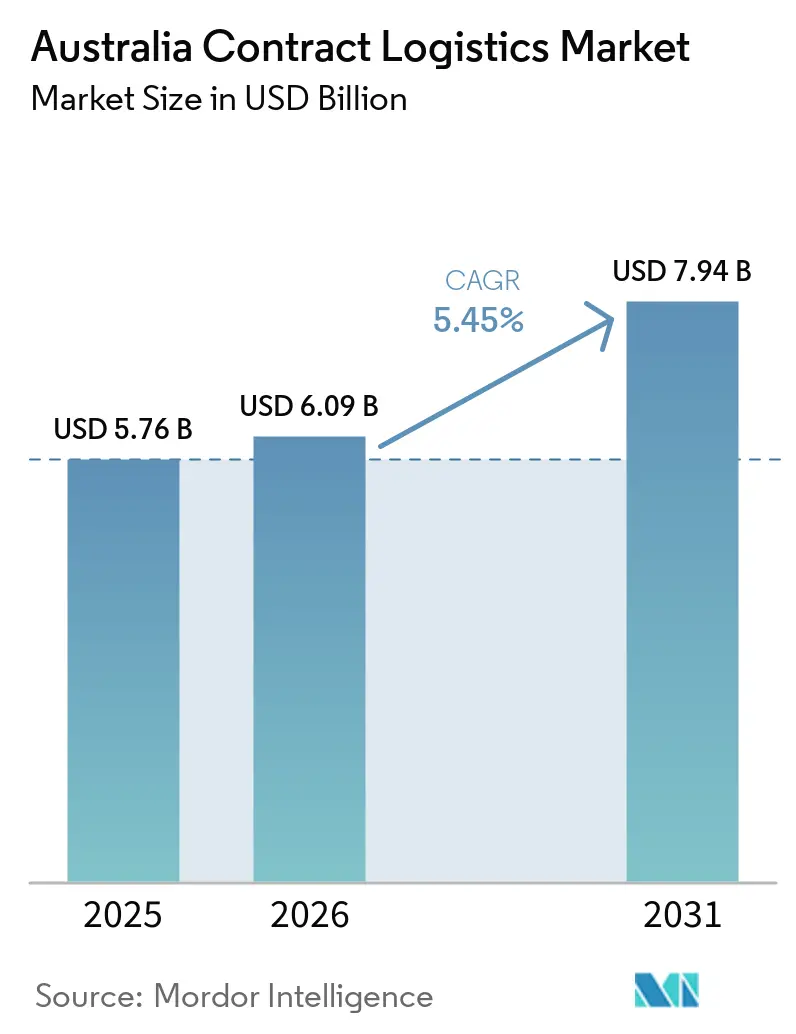
| Base Year Market Size (2025) | USD 5.76 Billion |
| Market Size (2026) | USD 6.09 Billion |
| Market Size (2031) | USD 7.94 Billion |
| Growth Rate (2026 - 2031) | 5.45% CAGR |
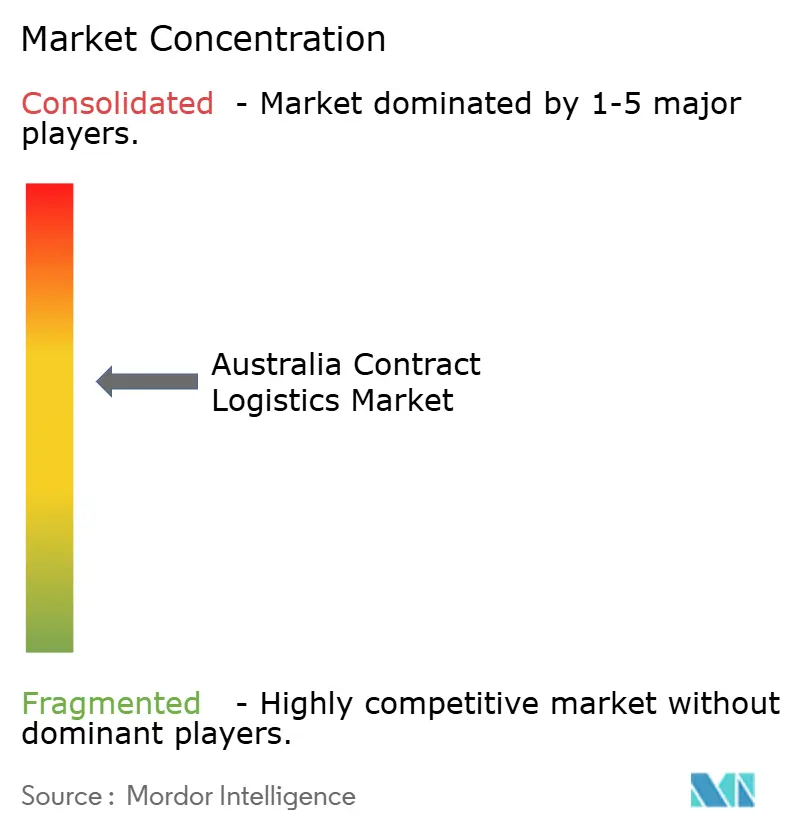
| Market Concentration | Medium |
Major Players *Disclaimer: Major Players sorted in no particular order Image © Mordor Intelligence. Reuse requires attribution under CC BY 4.0. | |
Australia Contract Logistics Market Analysis by Mordor Intelligence
The Australia contract logistics market size is expected to grow from USD 5.76 billion in 2025 to USD 6.09 billion in 2026 and is forecast to reach USD 7.94 billion by 2031 at 5.45% CAGR over 2026-2031.
Public and private infrastructure spending topping USD 18.76 billion and USD 22.11 billion, respectively, around Western Sydney is underpinning a structural shift from post-pandemic volatility to long-run capacity growth. Fresh curfew-free belly-cargo slots at Western Sydney International Airport from late 2026, the Beveridge-to-Parkes double-stack rail section due 2027, and Amazon’s USD 502.5 million robotic fulfillment center slated for 2028 together expand multimodal reach and speed. Yet diesel prices, which jumped to approximately 265 cents per liter in April 2026, are pushing shippers toward longer contracts with surcharge clauses. Parallel regulatory pressure mandatory Scope 3 emissions disclosure for large firms from fiscal 2026 favors providers investing in electric trucks and solar-powered depots, deepening the technology gap between Tier 1 and smaller fleets.[1]Department of Infrastructure, Transport, Regional Development, Communications and the Arts, “Western Sydney Infrastructure Plan,” infrastructure.gov.au
Key Report Takeaways
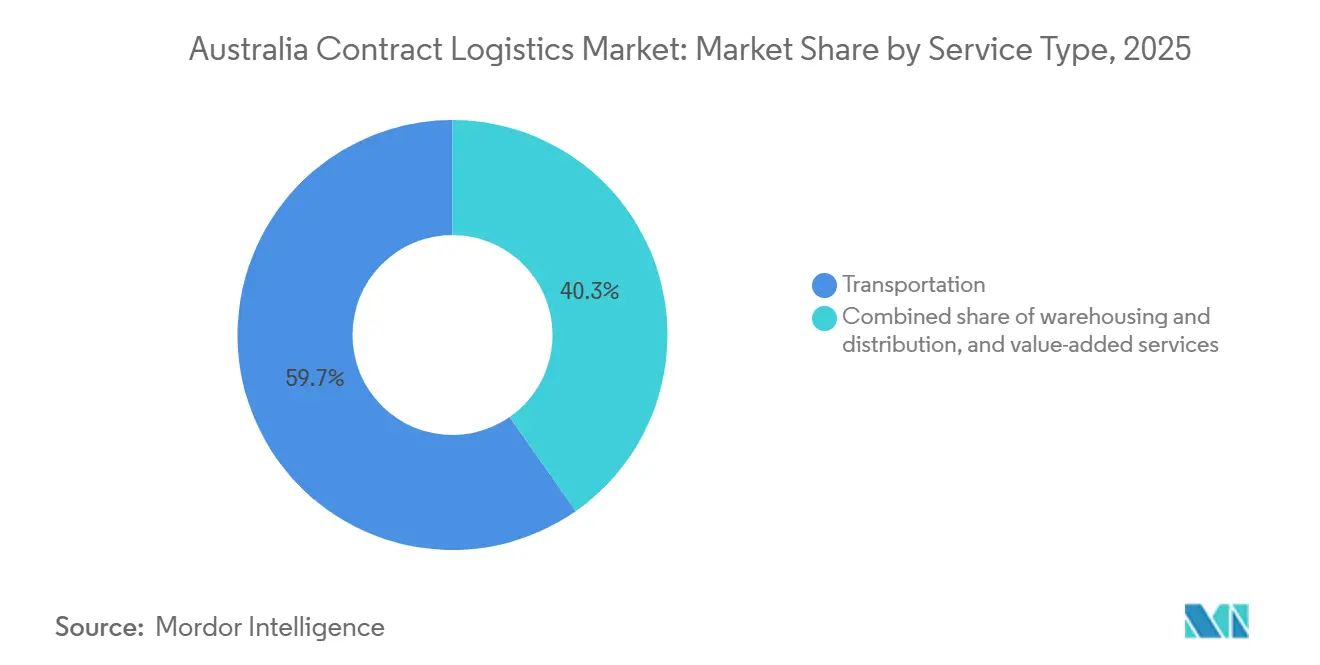
- By service type, transportation led with 59.72% of the Australia contract logistics market share in 2025, and value-added services is projected to expand at a 6.88% CAGR through 2031.
- By contract duration, deals longer than three years accounted for 61.38% of the Australia contract logistics market size in 2025 and are advancing at a 6.34% CAGR through 2031.
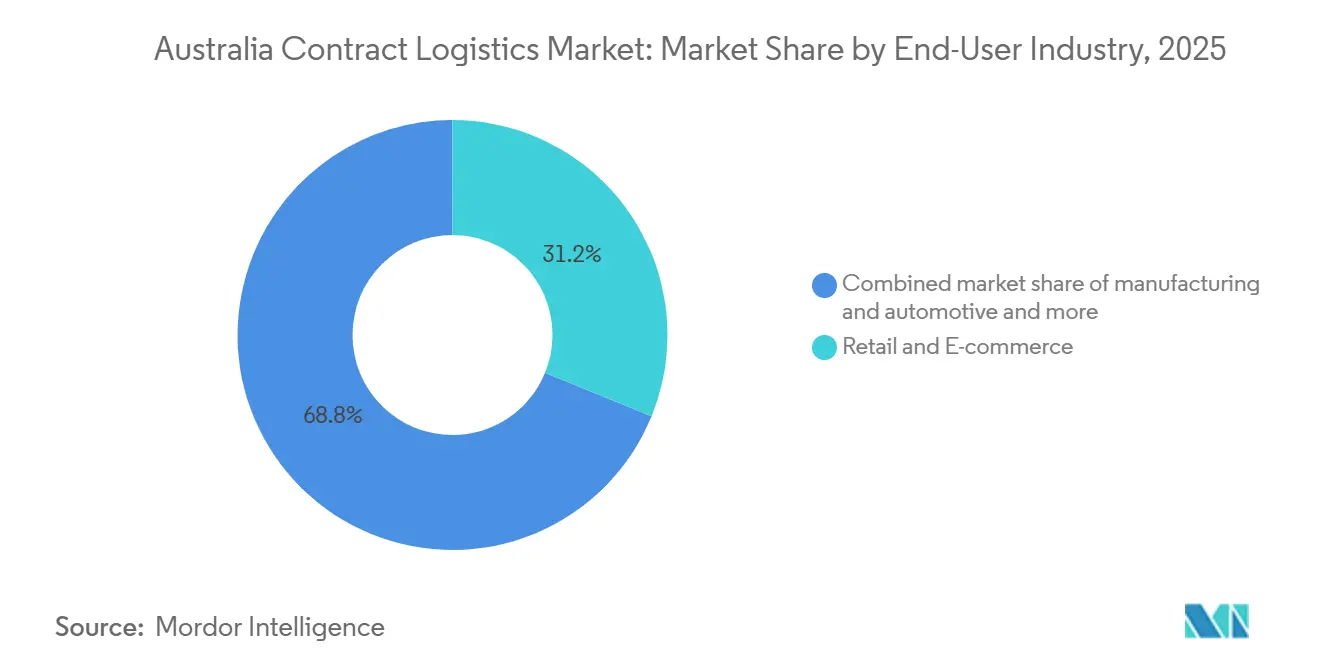
- By end-user industry, retail and e-commerce captured 31.16% of the Australia contract logistics market size in 2025; healthcare and pharmaceuticals is forecast to accelerate at a 7.03% CAGR to 2031.
- By geography, New South Wales accounted for 41.21% of the Australia contract logistics market share in 2025, while Western Australia is set to post the fastest growth at 6.79% CAGR through 2031.
Note: Market size and forecast figures in this report are generated using Mordor Intelligence’s proprietary estimation framework, updated with the latest available data and insights as of January 2026.
Australia Contract Logistics Market Trends and Insights
Drivers Impact Analysis*
| Drivers | (~) % Impact on CAGR Forecast | Geographic Relevance | Impact Timeline |
|---|---|---|---|
| Government-Funded Infrastructure Megaprojects (Western Sydney Airport, Inland Rail) | +1.5% | NSW, Victoria, Queensland | Long term (≥ 4 years) |
| E-Commerce Boom Driving Nationwide B2C Fulfillment | +1.2% | National; strongest in Queensland, NSW, Victoria | Medium term (2-4 years) |
| Rising Demand for End-To-End Cold-Chain Solutions (Food & Pharma) | +0.8% | National; early uptake in NSW, Victoria | Medium term (2-4 years) |
| Stricter ESG Mandates Favoring 3PLs With Low-Carbon Fleets | +0.7% | National | Long term (≥ 4 years) |
| OEM Outsourcing Triggered by Industry 4.0 Retrofits in Manufacturing | +0.6% | Victoria, South Australia, NSW | Medium term (2-4 years) |
| Freight Visibility Platforms Boosting 3PL–Shipper Collaboration | +0.4% | Metro areas nationwide | Short term (≤ 2 years) |
| Source: Mordor Intelligence | |||
Government-Funded Infrastructure Megaprojects (Western Sydney Airport, Inland Rail)
The NSW 2025-26 budget channels over USD 2.41 billion to the Western Sydney Airport Metro and USD 1.34 billion to the toll-free M12 motorway, knitting together an 11,200-hectare Aerotropolis that may host 120,000 jobs. A curfew-free airport able to lift annual freight from 220,000 tonnes to 1.8 million tonnes beats Sydney Kingsford Smith’s night ban. On rail, Inland Rail’s Beveridge-to-Parkes priority section, built for double-stacked trains, edges toward a 2027 handover. The Western Sydney Freight Line will redirect containers off congested city tracks, cutting trucking and emissions. These links gradually anchor national schedules and encourage shippers to centralize distribution around Western Sydney.
E-Commerce Boom Driving Nationwide B2C Fulfillment
Queensland’s online spend reached USD 11.93 billion in 2025, prompting Australia Post to build a USD 134 million parcel hub in Brisbane that can sort 250,000 parcels daily. Coles followed with robotic customer-fulfillment centers near Melbourne and Sydney, each using over 700 robots to complete 50-item orders in five minutes. Automation improves accuracy while easing labor shortages, forecast to reach 78,000 unfilled driving positions by 2029. Amazon’s USD 502.5 million Logan megacenter adds high-throughput capacity and signals that global platforms are embedding long-term assets locally. The surge is spawning fresh 3PL opportunities in urban consolidation and reverse logistics, even as big retailers internalize core fulfillment.
Rising Demand for End-To-End Cold-Chain Solutions (Food and Pharma)
From March 2025, the Therapeutic Goods Administration will require lot-level traceability and 24-hour temperature logging for every therapeutic shipment. Compliance is pushing pharmaceutical firms toward HACCP-certified 3PLs that can deliver real-time audit trails. DHL Supply Chain’s new 215,000 square-foot carbon-neutral depot in Adelaide offers ambient, chilled, and frozen zones under one roof and feeds a growing electric truck fleet. Food shippers face parallel pressure: Australia wastes 7.6 million tonnes of food annually, and better cold-chain routing is central to national reduction targets. As a result, multi-temperature warehouses with integrated batch tracking are emerging as premium assets within the Australia contract logistics market.[2]Therapeutic Goods Administration, “PRAC 2025 Guidelines,” tga.gov.au
Stricter ESG Mandates Favouring 3PLs With Low-Carbon Fleets
Mandatory climate-related financial disclosure began in 2025 for firms with revenue above USD 335 million, with Scope 3 reporting due from fiscal 2026. Shippers now screen 3PLs for renewable power, biodiesel, and electric vehicles. DHL’s Electric Vehicle Center of Excellence and its 256-kWp solar array in Western Sydney exemplify early movers. Qube recorded an 18% reduction in carbon intensity in 2024 relative to its 2018 base, positioning it to win longer-term multinationals’ tenders. Smaller fleets lag on data capture and fleet renewal, risking contract attrition.
Restraints Impact Analysis*
| Restraints | (~) % Impact on CAGR Forecast | Geographic Relevance | Impact Timeline |
|---|---|---|---|
| Driver Shortages Amid Aging Workforce and Tough Visa Rules | -0.9% | National, with acute pressure in regional and remote areas | Short term (≤ 2 years) |
| Volatile Fuel Surcharge Pass-Through Clauses Eroding Margins | -0.7% | National, with higher impact on long-haul and regional operators | Short term (≤ 2 years) |
| Retailers' Insourcing Trend for Micro-Fulfilment in Metro Areas | -0.6% | New South Wales, Victoria, Queensland (metro concentration) | Medium term (2–4 years) |
| Port Congestion and Bio-Security Delays Inflating Dwell Times | -0.5% | New South Wales (Port Botany), Victoria (Melbourne), Western Australia (Fremantle) | Short term (≤ 2 years) |
| Source: Mordor Intelligence | |||
Driver Shortages Amid Aging Workforce and Tough Visa Rules
Out of the 189,900-strong truck workforce, nearly half are older than 55, and only 5.4% are under 25. Tight visa audits canceled three student visas and cited five firms for illegal hiring in April 2026, shrinking informal labor pipelines. Industry Skills Australia is drafting a national heavy-vehicle apprenticeship, but existing schemes still ask operators to pay, limiting uptake. Carriers now offer above-market pay and staggered sign-on bonuses, eroding margins for small fleets. The capacity crunch is already raising spot road-freight rates on the Adelaide–Perth lanes by double digits.
Volatile Fuel Surcharge Pass-Through Clauses Eroding Margins
The Australian transport sector is managing material fuel price volatility, with elevated diesel costs impacting liquidity despite temporary government excise relief. This dynamic creates working capital constraints for operators, as contractual fuel surcharge pass-through mechanisms lag behind spot pump prices, compounding standard customer payment cycles. Consequently, these financial pressures have necessitated operational adjustments, prompting carriers to optimize routes in remote areas, allocate payload capacity for supplemental fuel reserves, and adjust freight rates, which has introduced contractual friction with shippers. Concurrently, the ACCC has initiated regulatory inquiries into fuel suppliers regarding pricing practices in regional markets. Ultimately, this situation underscores the structural exposure of the logistics sector; as road transport remains the primary mode for non-bulk domestic freight and the largest contributor to transport emissions, it is disproportionately sensitive to global fuel pricing fluctuations compared to alternative modes such as rail or coastal shipping.
*Our forecasts treat driver/restraint impacts as directional, not additive. The impact forecasts reflect baseline growth, mix effects, and variable interactions.
Segment Analysis
By Service Type: Transportation Dominates but Value-Added Services Accelerate
Transportation controlled 59.72% of the Australia contract logistics market share in 2025, thanks to road freight’s reach across 249 billion tonne-kilometers. The Australia contract logistics market size for rail and air remains modest, yet double-stack corridors and curfew-free slots at Western Sydney International are expected to unlock new premium lanes. Road accounts for about 83% of sector emissions, keeping decarbonization in focus. Autonomous pallet robots and AI-based load planning now shave up to 15% off truck dwell in major distribution centers.
Value-added services, led by assembly, labeling, and kitting, post the fastest 6.88% CAGR to 2031 as brands outsource customization. IVE Group’s expansion to an 861,000-square-foot national footprint, anchored by a new Sydney supersite and DHL’s Western Sydney mezzanine for returns and inspection, demonstrates how providers are pursuing higher-margin niches. Successful operators couple robotics with skilled labor to manage peak fashion drops or electronics recall campaigns, insulating revenue from pure linehaul volatility.


By Contract Duration: Long Deals Gain Ground Amid Fuel Swings
Contracts longer than three years accounted for 61.38% of the Australia contract logistics market size in 2025, and the segment is expected to grow at the highest CAGR of 6.34% from 2026 to 2031. Surging diesel prices, which doubled monthly fuel bills to USD 201,000 for some fleets, are prompting shippers to lock in capacity through surcharge formulas rather than gamble on spot markets. Multi-year visibility also enables 3PLs to finance hydrogen-ready prime movers and battery swap stations.
One- to three-year agreements still matter for pilots around omnichannel fulfillment or modal shifts as Inland Rail sections go live. DB Schenker’s parts contract for Geely Auto illustrates a medium-term ramp that mirrors product-launch cadence. Regulatory reporting on Scope 3 emissions from 2026 further pushes corporates toward partners that can guarantee audited data throughout a longer horizon.[3]The Treasury, “Mandatory Climate-Related Financial Disclosures,” treasury.gov.au
By End-User Industry: Retail Leads, Healthcare Races Ahead
Retail and e-commerce delivered 31.16% of 2025 revenue, anchored by supermarket automated fulfillment and just-in-time parts flows. Coles’ USD 589.6 million Truganina automated distribution center, opening in 2029, will push 4.6 million cartons weekly and amplify internal capabilities. As major onshore robotics chains pivot, 3PLs are pivoting to support mid-tier online brands with scalable next-day delivery and returns management.
Healthcare and pharmaceuticals are the fastest-growing verticals, with a 7.03% CAGR through 2031 under stricter traceability rules. DHL’s Adelaide cold-chain hub, powered by solar and featuring electric yard tractors, exemplifies how providers win by blending compliance, sustainability, and nationwide reach. Temperature-controlled vans with telematics link directly to recall dashboards, cutting regulatory response time below the TGA’s six-week interim-report window.
Geography Analysis
New South Wales held 41.21% of the Australia contract logistics market size in 2025, driven by Port Botany, where more than 80% of boxes head to Western Sydney warehousing. State funding worth USD 2.41 billion for the Airport Metro, USD 1.34 billion for the M12 motorway, and USD 431.55 million for stormwater works is unlocking 2,100 acres of serviced industrial land near the curfew-free airport. Toll Group’s USD 134 million automated retail hub and DHL’s multi-customer warehouse at Erskine Park cement the region as the nation’s omnichannel nerve center.
Western Australia is forecast to grow fastest, at a 6.79% CAGR to 2031, as the USD 182.91 million Westport planning package advances a Kwinana container port that could quadruple capacity. The USD 16.75 million Kenwick Intermodal Terminal, already routing 200,000 TEU annually from road to rail, trims 135,000 truck trips and strengthens Perth’s east-west supply resilience. DP World’s rail interchange is set to raise Fremantle’s rail share to 33%, alleviating urban congestion.
Victoria, Queensland, and South Australia round out demand. Amazon’s Logan fulfillment center and Australia Post’s USD 134 million Brisbane parcel hub ride USD 11.93 billion in 2025 online spend, stoking Southeast Queensland’s last-mile boom. In Victoria, Coles’ Truganina site ties into cross-state fresh and grocery flows, while DHL’s Adelaide cold-chain campus in South Australia serves life-sciences clusters stretching into regional mining belts. Tasmania, Northern Territory and the ACT remain niche but benefit from an USD 670 million federal rail hardening against extreme weather across the east-west corridor.[4]Transport for NSW, “Port Botany Landside Report,” transport.nsw.gov.au
Competitive Landscape
Australia contract logistics market competition is moderate, with DHL Supply Chain, Toll Group, Linfox, CEVA, Kuehne+Nagel, DSV, Mainfreight, Maersk Logistics, and Qube outperforming dozens of regional fleets. Macquarie Asset Management’s USD 7.84 billion plan to take Qube private, subject to regulatory nods by mid-2026, should free management to invest in digital yard systems and hydrogen truck pilots without quarterly pressure. The move also consolidates port-adjacent warehousing just as Western Sydney and Kwinana terminals expand.
Large global 3PLs differentiate through sustainability credentials and automation scale. DHL’s rooftop solar and EV charging at Erskine Park, along with its Electric Vehicle Center of Excellence, give it an edge in Scope 3-conscious tenders. Toll’s Kemps Creek omni-channel site combines goods-to-person robots and AI cartonization, allowing supermarket replenishment and e-grocery picks under the same roof. Linfox is coupling its Avalon Airport freight hub with advanced x-ray scanning to meet tightened border screening, halving line-haul drags between Melbourne airports.
Regional specialists fight on niche expertise. Temperature-sensitive pharma chains, reverse logistics for fashion and mining-camp resupply each reward deep domain know-how and compliance systems. Start-ups offering SaaS visibility tools or circular-economy brokerage are weaving into established providers’ networks through white-label deals. Overall, capital inflows and technology gaps are driving a two-tier market where scale players win national contracts and smaller fleets cling to localized, high-touch lanes.
Australia Contract Logistics Industry Leaders
DHL Supply Chain
Toll Group
Linfox
CMA CGM Group (including CEVA Logistics)
Kuehne+Nagel
- *Disclaimer: Major Players sorted in no particular order

Recent Industry Developments
- April 2026: ARTC completed reinforced culverts on the east-west rail under a USD 670 million resilience program.
- March 2026: DHL Supply Chain opened a 226,800 square-foot Western Sydney warehouse with 256-kWp solar, rainwater harvesting, and EV charging to serve technology and automotive clients.
- March 2026: Amazon committed USD 750 million to build a 1.6 million-square-foot robotic fulfillment center in Logan, Queensland, targeting 125 million packages a year.
- February 2026: A Macquarie-led consortium signed a scheme to acquire Qube for USD 7.84 billion, aiming to close by mid-2026.


Australia Contract Logistics Market Report Scope
| Transportation | Road |
| Rail | |
| Air | |
| Sea | |
| Warehousing and Distribution | |
| Value-added Services (Assembly, Labelling, Kitting) |
| 1-3 Years |
| Above 3 years |
| Manufacturing and Automotive |
| Food and Beverage |
| Retail and E-commerce |
| Healthcare and Pharmaceuticals |
| Chemicals |
| Other Industries |
| New South Wales |
| Victoria |
| Queensland |
| Western Australia |
| South Australia |
| Rest of Australia |
| By Service Type | Transportation | Road |
| Rail | ||
| Air | ||
| Sea | ||
| Warehousing and Distribution | ||
| Value-added Services (Assembly, Labelling, Kitting) | ||
| By Contract Duration | 1-3 Years | |
| Above 3 years | ||
| By End-user Industry | Manufacturing and Automotive | |
| Food and Beverage | ||
| Retail and E-commerce | ||
| Healthcare and Pharmaceuticals | ||
| Chemicals | ||
| Other Industries | ||
| By Region | New South Wales | |
| Victoria | ||
| Queensland | ||
| Western Australia | ||
| South Australia | ||
| Rest of Australia |


Key Questions Answered in the Report
What is the 2026 size of Australia contract logistics?
The sector is estimated at USD 6.09 billion in 2026.
How fast will Australia contract logistics expand through 2031?
The market value is projected to reach USD 7.94 billion by 2031, driven by a 5.45% CAGR.
Which service type currently generates the most revenue?
Transportation services hold 59.72% share, led by road freight’s extensive reach nationwide.
Which Australian state is expected to post the quickest growth?
Western Australia shows the fastest forecast pace at 6.79% CAGR on the back of the Westport port-rail program.
How are rising fuel prices shaping contract durations?
Diesel volatility is motivating shippers to sign agreements longer than three years, now 61.38% of all contracts.
Why is healthcare logistics gaining momentum?
Stricter Therapeutic Goods Administration traceability rules and cold-chain needs are driving a 7.03% CAGR in healthcare and pharmaceutical volumes.
Page last updated on:


