
Asset Management Market Size and Share
Market Overview
| Study Period | 2020 - 2031 |
|---|---|
| Market Size (2026) | USD 169.87 Trillion |
| Market Size (2031) | USD 245.12 Trillion |
| Growth Rate (2026 - 2031) | 7.61 % |
| Fastest Growing Market | Asia-Pacific |
| Largest Market | North America |
| Market Concentration | Low |
Major Players *Disclaimer: Major Players sorted in no particular order Image © Mordor Intelligence. Reuse requires attribution under CC BY 4.0. | |
Asset Management Market Analysis by Mordor Intelligence
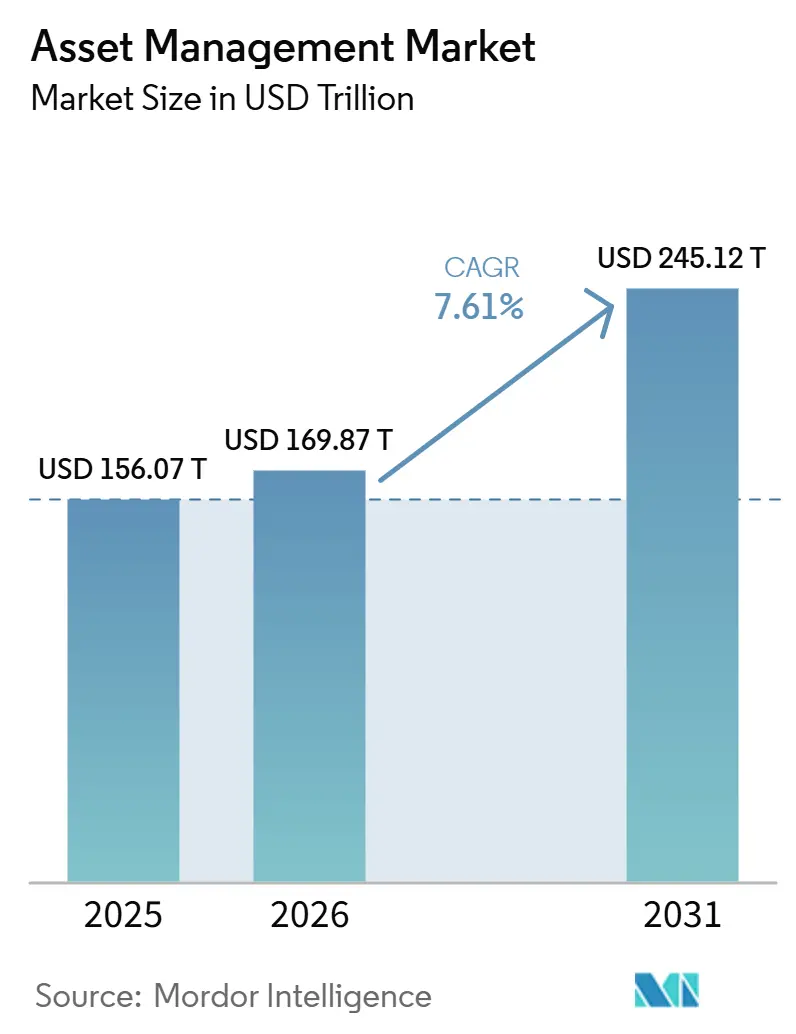
The Asset Management Market size was valued at USD 156.07 trillion in 2025 and is estimated to grow from USD 169.87 trillion in 2026 to reach USD 245.12 trillion by 2031, at a CAGR of 7.61% during the forecast period (2026-2031).
The asset management market is supported by deeper household participation in capital markets, larger defined-contribution retirement pools, and sustained institutional movement toward private credit, infrastructure, and other illiquid strategies. Revenue growth in the recent cycle was driven more by asset price appreciation than by net new money, which helped large firms more than mid-sized managers and left earnings more exposed to a valuation reset in public markets. The asset management market is also seeing a wider mix of delivery models, with digital platforms expanding retail access while human-led advice remains central for complex mandates and larger portfolios. Cross-border demand is rising at the same time, especially from Asia-Pacific investors and Gulf institutional pools, which is supporting offshore structures and broader product reach. Competition in the asset management market is becoming tighter at the top as large firms add scale, technology, and private-market capabilities, while smaller specialists seek niche growth areas or partnerships to protect margins.
Key Report Takeaways
- By asset class, equities captured 48.67% of the asset management market share in 2025, while alternatives are projected to grow at 9.81% CAGR through 2031.
- By provider type, independent asset managers captured 57.59% of the asset management market share in 2025 and are projected to grow at 8.32% CAGR through 2031.
- By delivery model, human advisory captured 71.23% of the asset management market share in 2025, while robo-advisory is projected to grow at 12.58% CAGR through 2031.
- By client type, institutional clients accounted for 64.89% of the asset management market in 2025, while retail clients are projected to grow at an 8.77% CAGR through 2031.
- By domicile, onshore captured 74.26% of the asset management market share in 2025, while offshore is projected to grow at 9.02% CAGR through 2031.
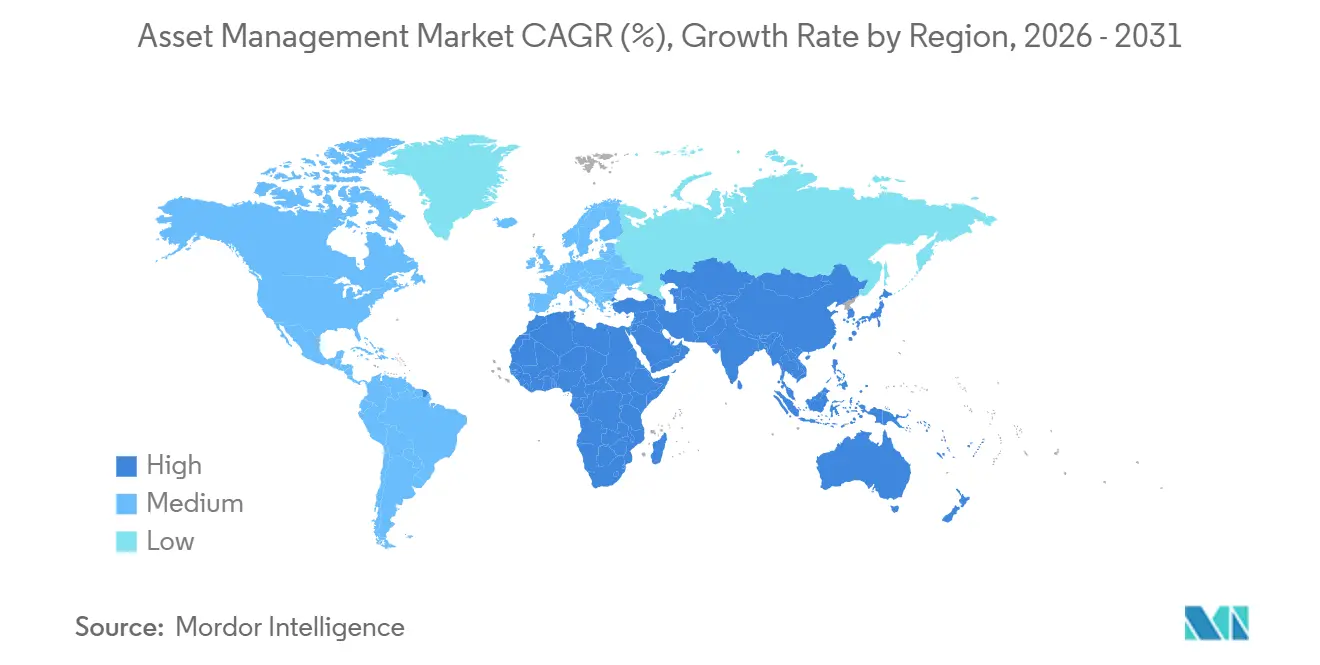
- By geography, North America captured 46.98% of the asset management market share in 2025, while Asia-Pacific is projected to grow at 9.31% CAGR through 2031.
Note: Market size and forecast figures in this report are generated using Mordor Intelligence’s proprietary estimation framework, updated with the latest available data and insights as of January 2026.
Market Trends and Insights
Drivers Impact Analysis of Asset Management Market*
| Driver | (~) % Impact on CAGR Forecast | Geographic Relevance | Impact Timeline |
|---|---|---|---|
| Retirement Savings Accumulation | +1.8% | Global, with the strongest gains in North America, Europe, and East Asia | Long term (≥ 4 years) |
| Institutional Allocation to Alternatives | +1.6% | Global, with primary benefits in North America and the Asia-Pacific | Medium term (2-4 years) |
| Digital Wealth Platforms and AI-Driven Advice | +1.2% | Global, with early adoption in North America and the Asia-Pacific | Medium term (2-4 years) |
| Private Markets Infrastructure Expansion | +1.4% | Global, with a concentration in Europe and Asia-Pacific | Long term (≥ 4 years) |
| Rising Demand for ESG and Sustainable Investing | +1.0% | Global, with the strongest momentum in Europe and North America | Medium term (2-4 years) |
| Increasing Pension Fund and Sovereign Wealth Fund Inflows | +1.3% | Global, with primary concentration in North America, Europe, and the Middle East | Long term (≥ 4 years) |
| Source: Mordor Intelligence | |||
Retirement Savings Accumulation
Retirement savings continue to provide one of the steadiest foundations for the asset management market because these balances build over long periods and are less sensitive to short-term market swings. United States retirement assets reached USD 49.1 trillion in the fourth quarter of 2025, after rising 11.2% over the year, and IRAs alone held USD 19.2 trillion, equal to 39% of total United States retirement assets[1]. Total 401(k) savings rates reached a record 14.3% in the first quarter of 2025, and Fidelity reported that Gen Z participants increased contribution rates in the fourth quarter of 2025, which strengthens the long-run accumulation base for managers serving retirement accounts. Automatic plan design reinforces this pattern: 61% of Vanguard defined contribution plans had automatic enrollment in 2025, and two-thirds of those plans also used automatic annual deferral increases. The asset management market also benefits when managers offer lifecycle and retirement income solutions that help retain balances during decumulation, rather than losing those assets when participants retire. That makes retirement platforms a source of both scale and stickiness in the asset management market.
Institutional Allocation to Alternatives
Institutional demand for alternatives remains a major growth engine for the asset management market, as allocators seek yield, diversification, and longer-duration returns outside listed securities. Global institutional investors increased private market allocations from 10.5% of portfolios in 2023 to 12.5% in 2025, and average allocations reached 17% of portfolios in 2026. Aviva Investors reported that 88% of global institutional investors planned to increase or maintain private market allocations over the next 2 years, with infrastructure equity showing particularly strong intent[2]. Fundraising activity also shows that this demand is not limited to the largest flagship managers, as Hamilton Lane closed Infrastructure Opportunities Fund II at nearly USD 2 billion in February 2026 and Goldman Sachs Asset Management reached a USD 3 billion first close for West Street Infrastructure Partners V in June 2026. Public pension systems committed USD 84.8 billion to private markets and alternative strategies in the first quarter of 2026, up 51% from the fourth quarter of 2025, which shows how quickly allocations are still moving higher. The asset management market is gaining an additional channel through insurance-linked demand for private credit, where insurers act as institutional investors in some regions and as retail wrappers in others, broadening the buyer base for these strategies.
Digital Wealth Platforms and AI-Driven Advice
Digital distribution is changing how the asset management market attracts, serves, and retains smaller accounts that once sat outside the reach of traditional advisory economics. Global robo-advisor assets under management reached USD 1.2 trillion at year-end 2024 after crossing the USD 1 trillion threshold in 2023[3]. Unbiased said its AI-enabled financial advice platform supported a record GBP 52 billion in AUM opportunities in 2025, up from GBP 41 billion in 2024, and linked part of that rise to a 106% increase in traffic from consumers using generative AI search to find advice. BCG estimated that AI integration could cut industry costs by 25% to 35% and raise client coverage per relationship manager by 3 to 5 times over the next 3 to 5 years, which explains why firms are redesigning service models rather than treating AI as a narrow productivity tool. Tokenized United States Treasuries reached USD 13.6 billion in April 2026, up 170% year on year, underscoring how digital infrastructure is increasingly shaping product design and distribution. The asset management market is likely to see the largest gains among firms that combine automation with human judgment at the points where planning, trust, and personalization still matter most.
Private Markets Infrastructure Expansion
Private markets infrastructure is becoming a larger part of the asset management market because it combines stronger revenue economics with large capital needs in energy, transport, and digital systems. Moody’s said private markets currently generate 4 times more profit per USD 1 billion in AUM than traditional managers, which is pushing firms to expand product offerings, build origination capabilities, and add specialist teams. PwC expects private markets to represent more than 50% of total asset management industry revenues by 2030, while private credit alone is expected to reach USD 2.7 trillion by 2028. Europe’s infrastructure requirements stand at EUR 12 trillion (USD 14.11 trillion) by 2040, with annual spending needs of EUR 800 billion (USD 941 billion), providing the asset management market with a durable demand backdrop for infrastructure equity and debt vehicles. PIMCO and SIMCo launched a multi-billion-dollar infrastructure debt origination platform in June 2026, and EQT set a EUR 21 billion (USD 24.6 billion) target for EQT Infrastructure VII in May 2026, which shows continued institutional appetite for this segment[4]. This part of the asset management market is attracting both large, diversified firms and fixed-income specialists seeking access to yield premiums and longer-duration mandates.
Restraints Impact Analysis of Asset Management Market*
| Restraint | (~) % Impact on CAGR Forecast | Geographic Relevance | Impact Timeline |
|---|---|---|---|
| Fee Compression From Passive Products | -1.5% | Global, with the strongest pressure in North America and Europe | Long term (≥ 4 years) |
| Cybersecurity and Data Privacy Exposure | -0.8% | Global, with compliance burdens concentrated in North America and the European Union | Medium term (2-4 years) |
| Regulatory Reporting and Conduct Compliance Burden | -0.7% | North America and the European Union, with spillover into the Asia-Pacific | Long term (≥ 4 years) |
| Market Volatility and Asset Underperformance | -1.1% | Global, especially affecting North America, Europe, and Asia-Pacific | Medium term (2-4 years) |
| Source: Mordor Intelligence | |||
Fee Compression from Passive Products
Fee compression continues to limit upside in the asset management market, as low-cost passive vehicles are capturing a larger share of flows and asset bases across core product lines. Average expense ratios for equity mutual funds fell 62% between 1996 and 2025, while index equity ETF expense ratios stood at 0.14% and bond ETF expense ratios stood at 0.09% at year-end 2025. Index mutual funds and index ETFs accounted for 52% of long-term fund assets in the United States by year-end 2025, up from 19% in 2010, indicating how much the asset mix has shifted toward cheaper structures. BCG reported that fees on 2024 net inflows were 40 basis points below fees on 2023 existing AUM across mutual funds and ETFs, which means the mix effect is eroding revenue even before broad fee cuts are applied. Active ETF flows exceeded USD 470 billion in 2025, up 59% from 2024, yet these vehicles still trade at a discount to traditional active mutual funds, so even the product formats attracting growth do not fully protect margins. The asset management market is responding through product innovation, but that response also raises operating complexity and suitability risk.
Cybersecurity and Data Privacy Exposure
Cybersecurity is a material restraint on the asset management market because firms hold portfolio data, identity records, and transaction information, which create both operational and reputational risks. The SEC’s amended Regulation S-P had a compliance deadline of December 3, 2025, and extended data protection and incident response obligations across registered investment advisers, including information obtained from third parties such as feeder funds, administrators, and placement agents. The SEC Division of Examinations also kept cybersecurity as a 2025 exam priority, with attention on access controls, data loss prevention, account management, and incident response practices. These obligations are harder for independent and mid-sized managers to absorb because they do not have the same dedicated security budgets and internal infrastructure as the largest platforms. A serious breach can also trigger direct AUM losses, especially in institutional mandates, where fiduciary rules may require manager termination following a documented security failure. That makes cybersecurity spending a necessary cost of doing business across the asset management market rather than a discretionary technology line item.
*Our forecasts treat driver/restraint impacts as directional, not additive. The impact forecasts reflect baseline growth, mix effects, and variable interactions.
Asset Management Market Segment Analysis
By Asset Class:
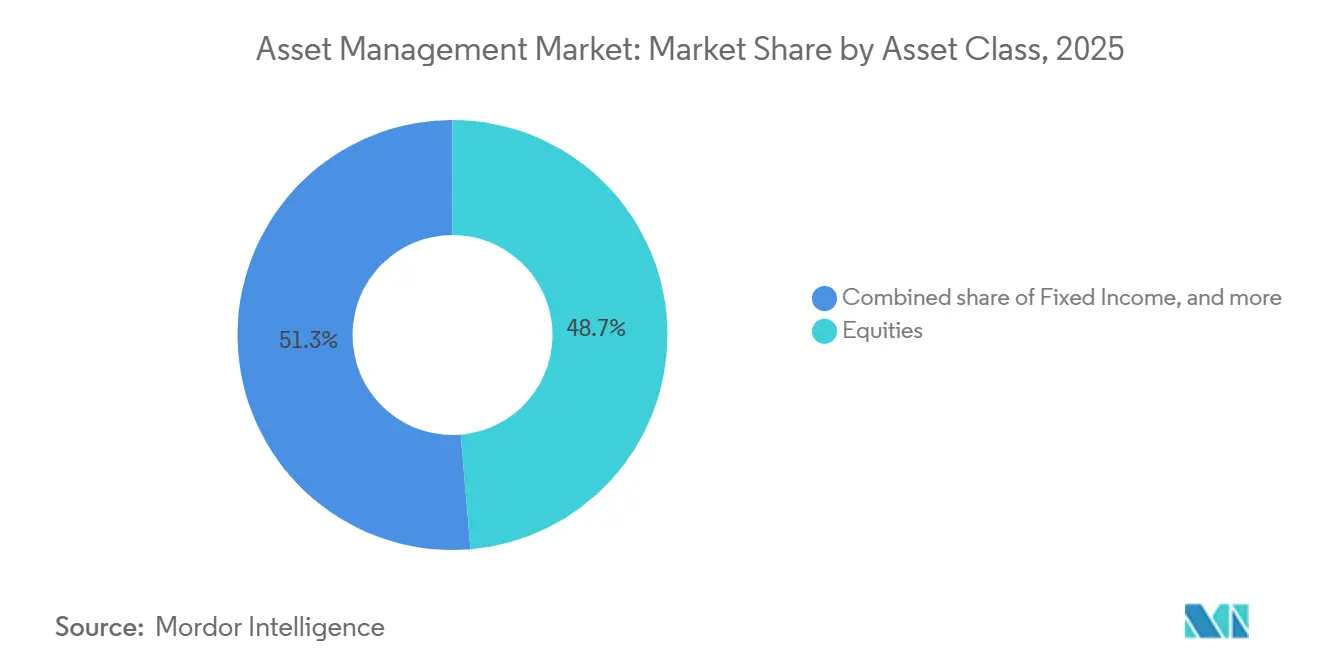
Equities Anchor the Base While Alternatives Expand the FastestEquities accounted for 48.67% of the asset management market in 2025, making them the largest asset class. This position reflected continued passive equity inflows and the central role of listed equity exposure in retirement accumulation portfolios. The asset management market also continued to rely on equity beta for revenue growth during the recent upcycle, making listed markets especially important for headline AUM expansion. United States active ETF flows surpassed USD 470 billion in 2025, up 59% from 2024, capturing 32% of all ETF flows, indicating that investors continued to use equity-linked vehicles even as delivery formats changed. Fixed income remained important in institutional mandates, while cash and cash equivalents maintained elevated weightings throughout much of 2025 amid persistent rate uncertainty.
Alternatives are projected to grow at 9.81% CAGR through 2031, making them the fastest-growing asset class in the asset management market. Private markets exposure also widened materially, with 94% of asset owners holding such exposure in 2026, up from 86% in 2025, and average institutional allocations reaching 17% of portfolios. The top 50 private equity firms captured 37% of global fundraising in 2024, up from a 10-year average of 22%, indicating that growth in this part of the asset management industry is concentrating among established managers with stronger operational capabilities. That concentration favors firms that can provide reporting, origination depth, and distribution reach across private credit, infrastructure, and real assets. It also means the asset management market is not only shifting toward alternatives but doing so in a way that rewards scale and institutional credibility.
By Provider Type:
Independent Managers Extend Their LeadIndependent Asset Managers accounted for 57.59% of AUM in 2025, and they remained the largest provider group in the asset management market. Their position reflects the client's preference for fee transparency, specialist investment capability, and fewer conflicts arising from captive product distribution. Independent firms also benefit when institutional allocators use open-architecture selection rather than bank-led product shelves. The asset management market has increasingly rewarded managers who can show alignment of interest, especially in mandates where performance and reporting standards matter more than branch distribution. Banks, by contrast, face pressure from higher compliance costs, passive substitution across core products, and a tougher fight for investment talent.
Independent Asset Managers are also projected to grow at a 8.32% CAGR through 2031, keeping them ahead of other provider groups in the asset management market. A notable signal came in April 2025 when Wellington Management, Vanguard, and Blackstone formed an alliance to build multi-asset solutions that combine public and private markets with active and index strategies. That move showed how independent firms are broadening their reach without relying on traditional bank structures. The “Others” category, which includes boutiques, wealth platforms, and digital-first advisers, is also gaining traction as clients split mandates across more specialized providers rather than consolidating all their assets with a single institution. This is pushing the asset management market toward a more layered provider structure where scale matters, but specialized capability still creates room for growth.
By Delivery Model:
Human Advice Holds the Majority, While Robo Expands the FastestHuman Advisory retained 71.23% of the AUM delivery share in 2025, making it the largest delivery model in the asset management market. This reflects the continued importance of tax planning, estate considerations, and portfolio coordination for high-net-worth and institutional relationships. Complex mandates still require judgment, trust, and accountability that clients do not fully delegate to automated channels. The asset management market, therefore, continues to rely on human-led relationships for larger balances and more sophisticated client needs. At the same time, the value proposition of pure human advice is changing as technology reduces the information gap that once supported premium pricing.
Robo-advisory is projected to grow at 12.58% CAGR through 2031, making it the fastest-growing delivery model in the asset management market. Global robo-advisor AUM reached USD 1.2 trillion at year-end 2024, indicating that digital advice has already moved well beyond a niche position. Hybrid Advisory is emerging as the middle path, combining algorithmic construction with periodic adviser involvement and better unit economics at moderate account sizes. BCG estimated that AI could increase client coverage per relationship manager by 3 to 5 times over the next 3 to 5 years, which supports wider use of hybrid and automated models. The asset management market is therefore likely to keep human advice dominant in absolute size while digital and hybrid channels capture a larger share of incremental inflows.
By Client Type:
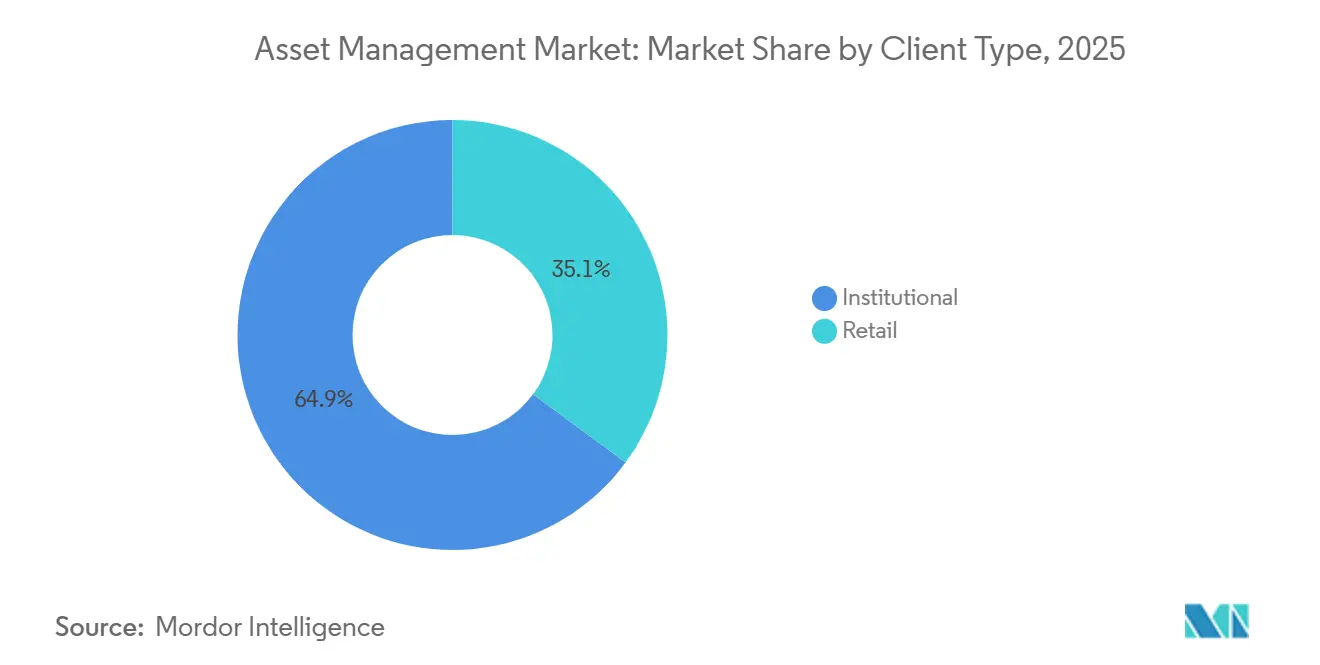
Institutions Still Lead While Retail Becomes More ImportantInstitutional clients accounted for 64.89% of the asset management market in 2025, making them the core client base. Pension funds, insurers, endowments, sovereign wealth funds, family offices, and other large allocators continue to set the pace for product design and due diligence expectations. Institutional demand is especially important in alternatives, where mandate size, reporting needs, and access structures favor experienced allocators. This part of the asset management market also exerts greater influence on manager economics, as large mandates can reshape the platform mix and product development. Public pension commitments of USD 84.8 billion to private markets and alternatives in the first quarter of 2026, up 51% from the prior quarter, underscore the segment's continued activity.
Retail is projected to grow at 8.77% CAGR through 2031, making it the fastest-growing client group in the asset management market. Growth is supported by digital brokerage access, lower minimums, and the gradual opening of private-market products to individual investors. The retail investors accounted for 61% of global AUM expansion between 2020 and 2025, suggesting a meaningful shift in the source of new balances. State Street reported that 84% of asset managers and wealth managers either offer or plan to offer private-market strategies to individual investors, indicating how quickly product design is adapting to this demand. The asset management market is therefore narrowing the gap between institutional and retail access, even though institutions still hold the larger asset base.
By Domicile:
Onshore Dominance Continues While Offshore Momentum BuildsOnshore domicile accounted for 74.26% of AUM in 2025, which made it the leading domicile format in the asset management market. Domestic fund structures in the United States and Europe remain deep and liquid, and many emerging markets still rely on local vehicle rules for distribution and regulatory compliance. Retail access also remains easier in familiar local structures such as IRS-qualified and UCITS-compliant formats. This gives onshore vehicles a durable scale advantage across mainstream savings and advisory channels in the asset management market. It also helps explain why the largest AUM pools still sit inside domestic structures even as cross-border demand rises.
Offshore domicile is projected to grow at a 9.02% CAGR between 2026 and 2031, making it the fastest-growing domicile in the asset management market. The growth of Asia-Pacific wealth diversification and Gulf institutional demand for internationally domiciled products. PwC noted that Asia-Pacific managers currently hold less than a quarter of regional client assets, compared with nearly 40% in Europe and nearly 60% in North America, leaving space for offshore hubs to play a larger role as regulation evolves. Singapore and Hong Kong continue to strengthen their positions as cross-border wealth hubs through broader fund access arrangements. The asset management market is also increasingly using offshore structures for product access rather than for tax planning, especially when domestic investors want global alternatives and fixed-income strategies that are not widely available at home.
Geography Analysis
North America Asset Management Market
North America captured 46.98% of the asset management market in 2025, maintaining its position as the largest regional market. The region continues to benefit from a very large retirement pool, deep ETF adoption, and broad advisory distribution. United States ETF flows exceeded USD 1.4 trillion in 2025, and global ETF flows surpassed USD 2.2 trillion, which reinforces North America’s central role in listed fund accumulation. Net flows in the Americas grew 2.4% in 2024, and United States retirement assets reached USD 49.1 trillion at year-end 2025, providing the region with a durable source of recurring inflows. Canada’s pension system and Mexico’s AFORE structure add further institutional depth, while the United States wealth transfer supports continued retail participation over time.
Europe and South America Asset Management Market
Europe did not lead in scale, but it remained a major force in the asset management market because fund flows, ETF adoption, and infrastructure funding needs all strengthened. European fund markets saw net flows nearly triple 2023 levels in 2024, and European ETF assets exceeded USD 3 trillion by the end of 2025, up 40% over the year. Europe also requires EUR 12 trillion (USD 14.11 trillion) in infrastructure investment by 2040, which supports long-term demand for real assets and private market strategies, regardless of short-term market conditions. South America remained smaller in the global asset management market, but Brazil’s private pension base, Chile’s AFP system, and wider digital broker use are expanding the region’s formal investment base.
APAC and MEA Asset Management Market
Asia-Pacific is projected to grow at a 9.31% CAGR through 2031, making it the fastest-growing geography in the asset management market. The region posted 9% annual net inflow growth between 2020 and 2025 and could reach USD 34.5 trillion in AUM by 2030, pointing to sustained structural expansion. India recorded 17% AUM growth in 2025, supported by monthly SIP inflows above USD 3 billion and 192 million demat accounts, while China’s mutual fund and private fund AUM reached USD 5.7 trillion (CNY 39.36 trillion) in April 2026. Japan reached USD 6.4 trillion in AUM at year-end 2025, and the Middle East and Africa are building a broader investor base through sovereign wealth activity and pension reform, which extends the growth runway for the asset management market.
Competitive Landscape
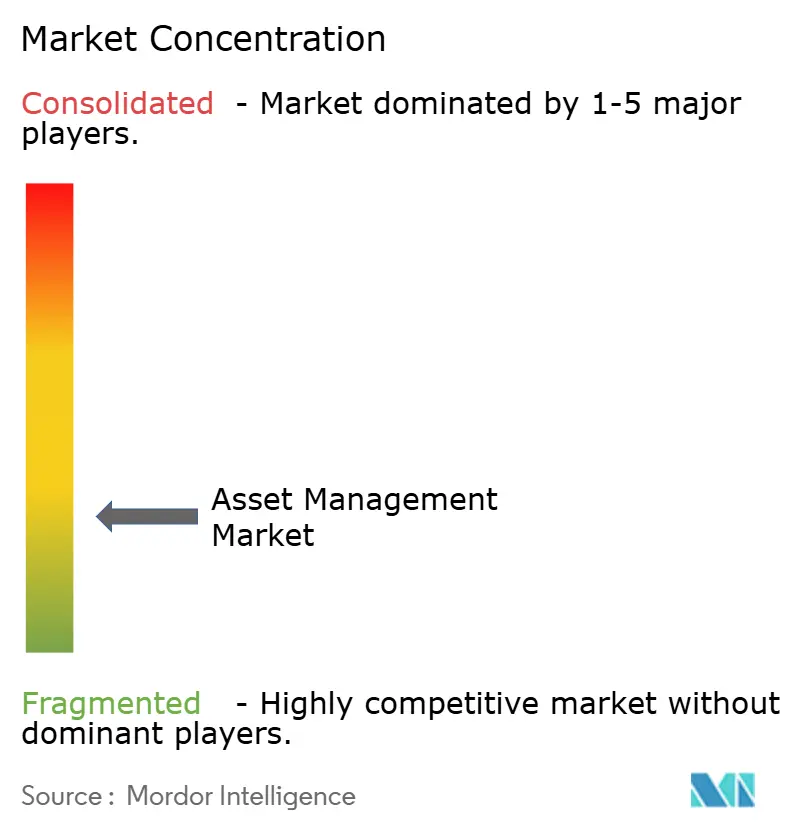
The asset management market is fragmented, yet broad enough to leave substantial room for specialist firms and regional players. The top 20 managers controlled 47% of global AUM in 2024, up from 45.5% in 2023, and 15 United States firms accounted for 84% of that top-20 volume. Large firms continue to benefit from scale because they can spread technology spending, lower passive pricing, and use broad distribution access more efficiently than mid-tier competitors. This is one reason the asset management market is seeing consolidation at the top, while smaller firms pursue narrower, capability-led models. The basic divide is becoming clearer: firms that can offer full-platform breadth versus those that compete by depth in selected segments.
A major strategic move came in February 2025 when BlackRock completed the acquisition of Preqin, creating a stronger private markets data, technology, and investment platform that supports broader, whole-portfolio client solutions. Another major step came in 2026 when Nuveen agreed to acquire Schroders plc in a GBP 9.9 billion transaction that would create a combined platform with nearly USD 2.5 trillion in active assets. In April 2025, Wellington Management, Vanguard, and Blackstone also formed a strategic alliance to build multi-asset solutions combining public and private assets, demonstrating how firms are broadening their product architecture without relying solely on traditional product silos. These moves show that competitive advantage in the asset management market now rests more on integrated capability than on isolated product strength.
Strategy is also shifting toward technology, private markets access, and digitally supported personalization across the asset management market. PwC reported that 81% of asset managers were actively using generative AI in 2025 to improve operating efficiency, indicating the widespread embedding of technology into workflows. Franklin Templeton’s June 2026 launch of Franklin Crypto, following the acquisition of 250 Digital, demonstrated another route to differentiation through the build-out of new capabilities in emerging asset categories. PIMCO and SIMCo’s June 2026 infrastructure debt platform showed how specialized firms can defend margins by developing origination-based expertise in high-growth segments rather than trying to match the breadth of the largest global houses. The asset management market, therefore, rewards scale at one end and distinctive specialist capability at the other, while the middle tier faces the greatest pressure.
Asset Management Industry Leaders
-
BlackRock, Inc.
-
The Vanguard Group, Inc.
-
Fidelity Investments
-
State Street Global Advisors
-
J.P. Morgan Asset Management
- *Disclaimer: Major Players sorted in no particular order
Asset Management Market Companies Covered in this Report
- BlackRock, Inc.
- The Vanguard Group, Inc.
- Fidelity Investments
- State Street Global Advisors
- J.P. Morgan Asset Management
- Goldman Sachs Asset Management
- Capital Group
- Amundi
- UBS Asset Management
- Allianz Global Investors
- BNY Investments
- Invesco Ltd.
- T. Rowe Price Group, Inc.
- Franklin Templeton
- Northern Trust Asset Management
- Schroders plc
- Morgan Stanley Investment Management
- MFS Investment Management
- PIMCO
- Legal and General Investment Management
Recent Industry Developments in Asset Management Market
- June 2026: Nuveen agreed to acquire Schroders plc in a GBP 9.9 billion (USD 13.5 billion) cash transaction, creating a combined active asset manager with nearly USD 2.5 trillion in AUM. The deal removes a significant independent European active manager from the market and signals a new phase of transatlantic consolidation.
- June 2026: PIMCO and SIMCo announced a strategic partnership to establish a multi-billion-dollar senior investment-grade infrastructure debt origination platform targeting energy transition, digital infrastructure, transportation, and social infrastructure, positioning fixed-income specialists as credit originators in a structurally growing private market segment.
- June 2026: Goldman Sachs Asset Management's West Street Infrastructure Partners V reached a USD 3 billion first close, representing approximately 75% of its final fundraising target, reflecting sustained LP demand for mid-market infrastructure equity strategies with a roughly 20-year GP track record.
- June 2026: Franklin Templeton closed the acquisition of 250 Digital and launched the Franklin Crypto division, creating a dedicated active cryptocurrency investment management unit that merges the acquired firm's liquid strategies and investment team with Franklin Templeton's global distribution platform.
Global Asset Management Market Report Scope
Segmentation Overview
| Equities |
| Fixed Income |
| Alternatives |
| Cash and Cash Equivalents |
| Others |
| Banks |
| Independent Asset Managers |
| Others |
| Human Advisory |
| Hybrid Advisory |
| Robo-Advisory |
| Retail |
| Institutional |
| Onshore |
| Offshore |
| North America | United States |
| Canada | |
| Mexico | |
| South America | Brazil |
| Argentina | |
| Rest of South America | |
| Europe | United Kingdom |
| Germany | |
| France | |
| Italy | |
| Spain | |
| Rest of Europe | |
| Asia-Pacific | China |
| Japan | |
| India | |
| South Korea | |
| Australia | |
| Indonesia | |
| Thailand | |
| Malaysia | |
| Singapore | |
| Vietnam | |
| Rest of Asia-Pacific | |
| Middle East and Africa | Saudi Arabia |
| United Arab Emirates | |
| Turkey | |
| South Africa | |
| Egypt | |
| Rest of Middle East and Africa |
| By Asset Class | Equities | |
| Fixed Income | ||
| Alternatives | ||
| Cash and Cash Equivalents | ||
| Others | ||
| By Provider Type | Banks | |
| Independent Asset Managers | ||
| Others | ||
| By Delivery Model | Human Advisory | |
| Hybrid Advisory | ||
| Robo-Advisory | ||
| By Client Type | Retail | |
| Institutional | ||
| By Domicile | Onshore | |
| Offshore | ||
| By Geography | North America | United States |
| Canada | ||
| Mexico | ||
| South America | Brazil | |
| Argentina | ||
| Rest of South America | ||
| Europe | United Kingdom | |
| Germany | ||
| France | ||
| Italy | ||
| Spain | ||
| Rest of Europe | ||
| Asia-Pacific | China | |
| Japan | ||
| India | ||
| South Korea | ||
| Australia | ||
| Indonesia | ||
| Thailand | ||
| Malaysia | ||
| Singapore | ||
| Vietnam | ||
| Rest of Asia-Pacific | ||
| Middle East and Africa | Saudi Arabia | |
| United Arab Emirates | ||
| Turkey | ||
| South Africa | ||
| Egypt | ||
| Rest of Middle East and Africa | ||
Key Questions Answered in the Report
What is the 2031 value forecast for asset management worldwide?
The asset management market is forecast to reach USD 245.12 trillion by 2031, up from USD 169.87 trillion in 2026, at a 7.61% CAGR over 2026-2031.
Which asset class holds the largest share of global managed assets?
Equities held 48.67% of AUM in 2025, making them the largest asset class.
Which segment is growing fastest across asset classes?
Alternatives are the fastest-growing asset class, with a projected 9.81% CAGR between 2026-2031.
Why are independent asset managers gaining ground?
Independent Asset Managers held 57.59% of AUM in 2025 and are projected to grow at 8.32% CAGR, supported by fee transparency, alignment of interest, and open-architecture mandate selection.
Which region is expanding the fastest through 2031?
Asia-Pacific is the fastest-growing region with a projected 9.31% CAGR between 2026-2031, supported by strong retail participation and rising regional wealth pools.
What is the biggest pressure on fees for investment managers?
Passive products remain the main fee pressure point, with index mutual funds and index ETFs accounting for 52% of long-term United States fund assets by year-end 2025 and core ETF fee levels remaining very low.