Asia Pacific Virtual Tour Software Market Size and Share
Market Overview
| Study Period | 2019 - 2030 |
|---|---|
| Forecast Data Period | 2025 - 2030 |
| Historical Data Period | 2019 - 2023 |
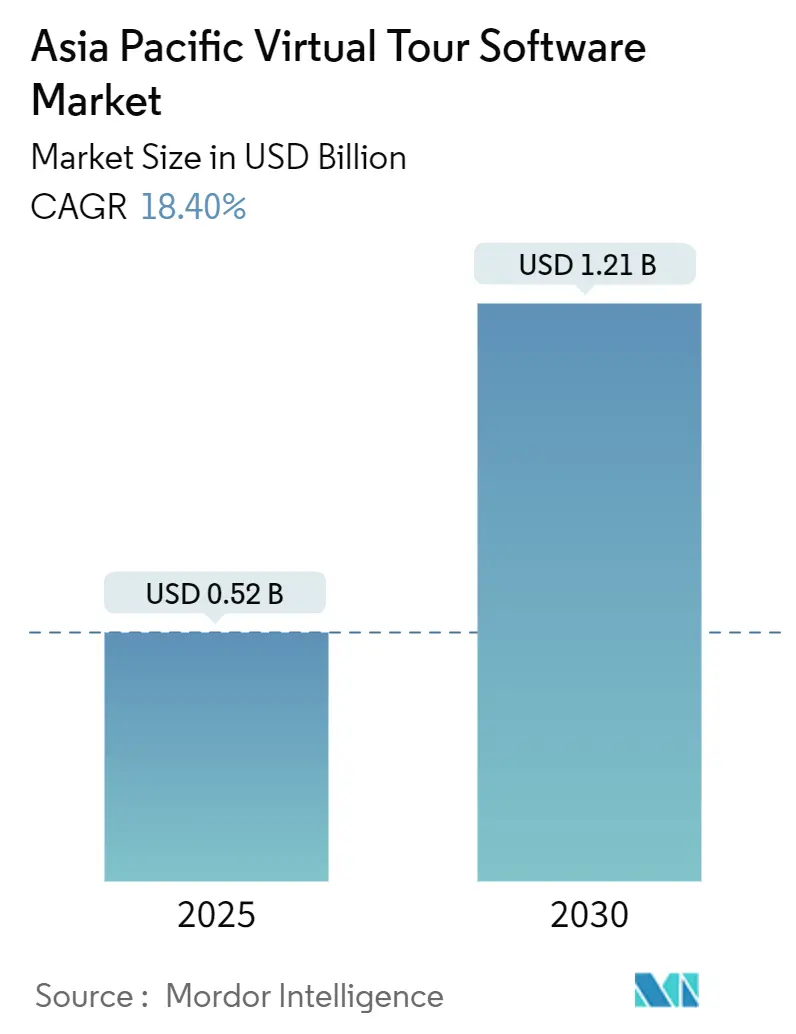
| Market Size (2025) | USD 0.52 Billion |
| Market Size (2030) | USD 1.21 Billion |
| Growth Rate (2025 - 2030) | 18.40% CAGR |
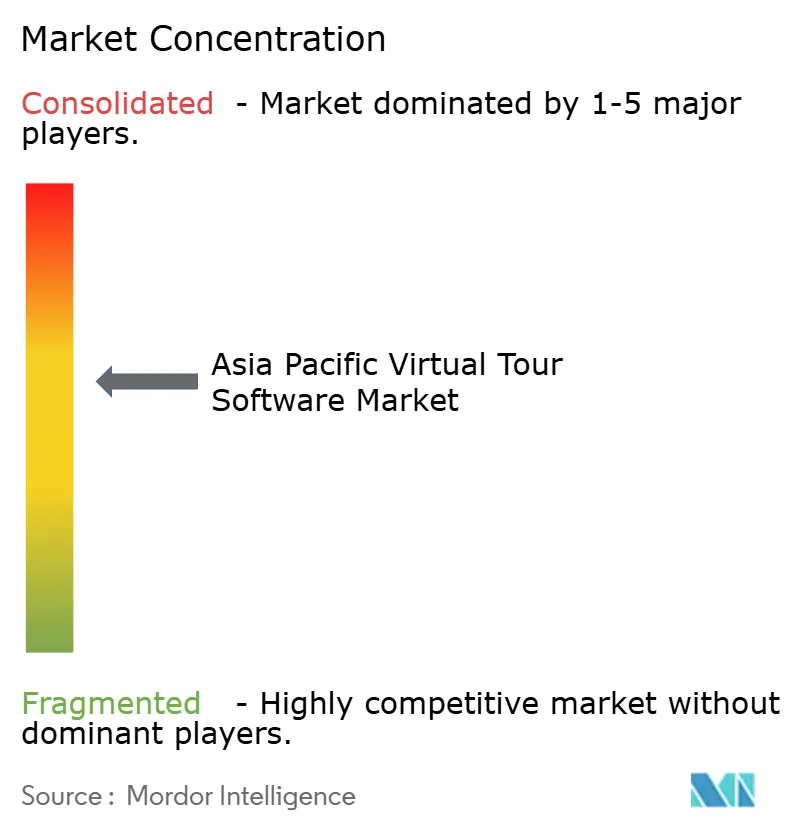
| Market Concentration | Medium |
Major Players *Disclaimer: Major Players sorted in no particular order Image © Mordor Intelligence. Reuse requires attribution under CC BY 4.0. | |
Asia Pacific Virtual Tour Software Market Analysis by Mordor Intelligence
The Asia Pacific virtual tour software market size reached USD 0.52 billion in 2025 and is projected to increase to USD 1.21 billion by 2030, reflecting an 18.4% CAGR over the forecast period. The expansion is directly linked to surging smartphone-based 360-degree camera use, intensified PropTech investment, and government smart tourism programs that collectively lower adoption barriers across diverse economies. Cloud deployment dominates because enterprises prefer subscription services that remove hardware upkeep while ensuring elastic capacity. Mobile access has overtaken desktop usage, indicating that consumers favor device-agnostic, on-the-go viewing experiences. Meanwhile, cloud rendering costs continue to fall, making high-fidelity tours viable even for small firms. Competitive rivalry is moderate as regional specialists leverage localized features to challenge global incumbents.
Key Report Takeaways
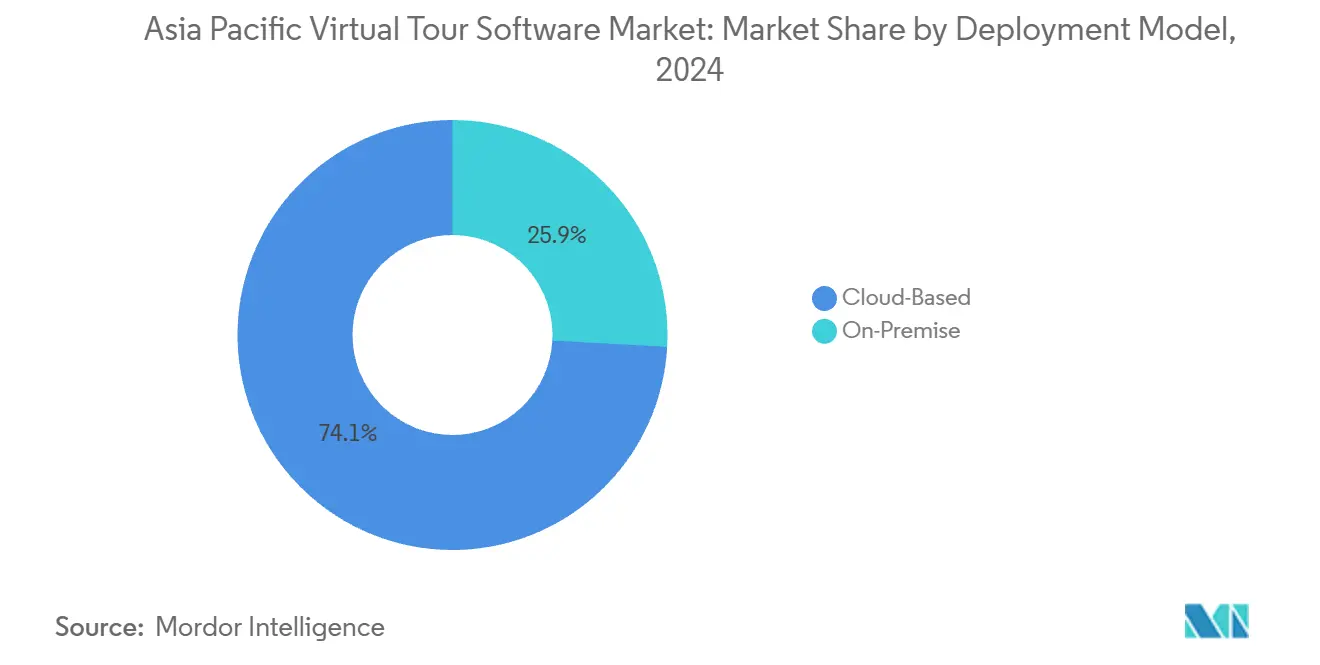
- By deployment model, cloud solutions held 74.12% revenue share in 2024, and hybrid-ready cloud platforms are projected to grow at a 21.02% CAGR through 2030.
- By end-user industry, real estate led with 41.58% share of the Asia Pacific virtual tour software market size in 2024, while education and training is expanding at a 21.34% CAGR to 2030.
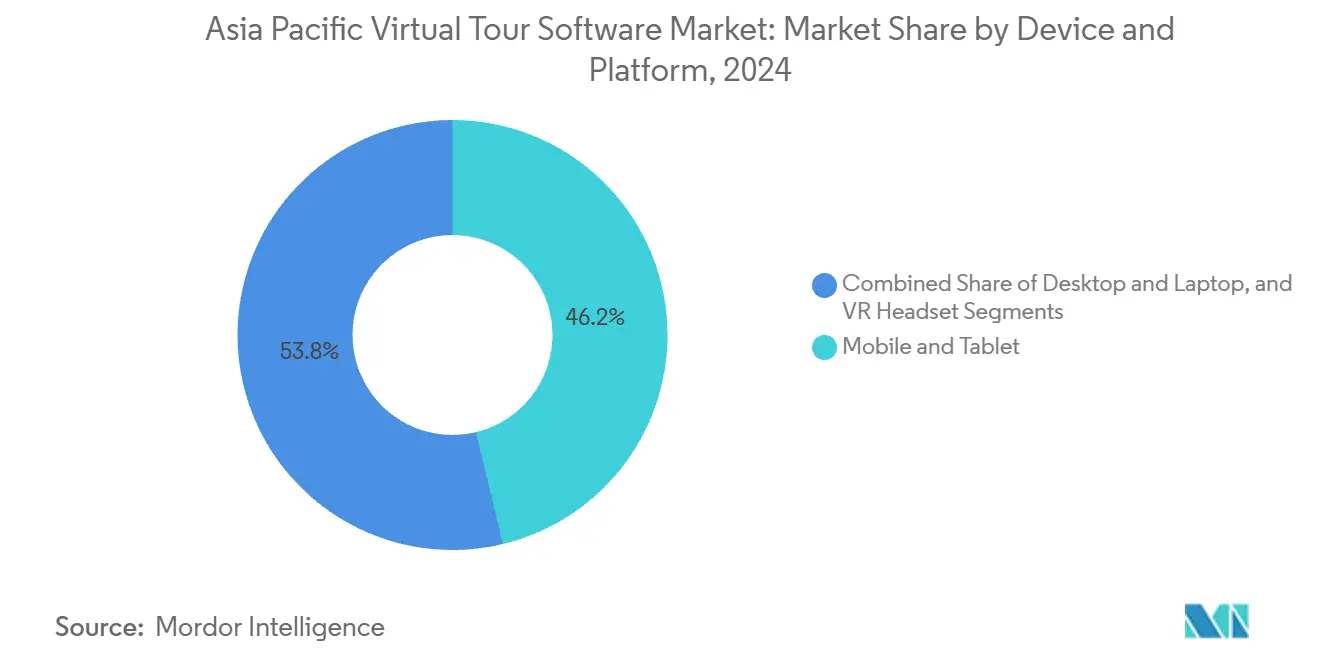
- By device and platform, mobile and tablet access captured 46.23% of the Asia Pacific virtual tour software market share in 2024, and VR headsets recorded the fastest growth at 20.34% CAGR through 2030.
- By component, software licenses accounted for 66.81% of the revenue in 2024, whereas services are expected to accelerate at a 21.28% CAGR, reflecting the rising demand for turnkey content creation and analytics.
- By geography, China accounted for 43.61% of the 2024 revenue, whereas India is poised to have the highest 20.92% CAGR from 2024 to 2030.
Asia Pacific Virtual Tour Software Market Trends and Insights
Drivers Impact Analysis*
| Driver | (~) % Impact on CAGR Forecast | Geographic Relevance | Impact Timeline |
|---|---|---|---|
| Accelerating smartphone-based 360-degree camera adoption | +3.2% | China, India, Southeast Asia core markets | Medium term (2-4 years) |
| Rapid growth of Property Technology (PropTech) investments | +2.8% | Urban centers across APAC | Short term (≤ 2 years) |
| Government-led smart tourism initiatives | +2.1% | Singapore, China, Thailand, Malaysia | Medium term (2-4 years) |
| E-commerce platforms integrating immersive storefronts | +1.9% | China, India, Southeast Asia retail hubs | Long term (≥ 4 years) |
| Surge in low-cost cloud rendering services | +1.7% | Infrastructure-dependent regions | Short term (≤ 2 years) |
| Rise of metaverse-ready virtual experiences in education | +1.5% | South Korea, Japan | Long term (≥ 4 years) |
| Source: Mordor Intelligence | |||
Accelerating Smartphone-Based 360-Degree Camera Adoption
Affordable 360-degree cameras that link directly to popular smartphones eliminate the need for expensive historical equipment, reducing outlays from more than USD 5,000 to as little as USD 529. This enables small real estate agencies and boutique hotels to craft professional tours without requiring technical staff. Regional manufacturers now offer localized models that support native-language apps and payment gateways, widening penetration into tier-2 and tier-3 cities. Content volumes are rising quickly because agents can finish a full property capture in under 15 minutes. These dynamics collectively expand the Asia Pacific virtual tour software market by opening previously cost-prohibitive customer segments. Cloud platforms optimized for smartphone uploads further streamline workflows, reducing time from shooting to publishing to under one hour. As smartphones remain the primary internet device in many emerging economies, this trend is expected to sustain double-digit adoption growth in the medium term.
Rapid Growth of Property Technology (PropTech) Investments
PropTech funding across APAC surpassed all-time highs in 2024, and virtual tours have become must-have features for digital brokers and online classifieds. Zillow’s purchase of Virtual Staging AI demonstrates how platform owners are combining immersive content with valuation analytics to attract sellers, 71% of whom prefer agents that offer virtual tours. Venture capital flows empower startups to localize global code bases for local regulations, thereby accelerating product rollouts across megacities such as Jakarta and Ho Chi Minh City. Developers also use tour data to refine space planning and to shorten leasing cycles, providing measurable ROI that secures continued investor interest. The inflow reinforces the Asia Pacific virtual tour software market as a core layer of digital real-estate infrastructure.
Government-Led Smart Tourism Initiatives
Policy interventions, such as Singapore’s SGD 300 million Tourism Development Fund, subsidize the creation of immersive content for attractions and museums.[1]Singapore Economic Development Board, “Singapore to Pump SGD 300 Million into Tourism,” edb.gov.sg Thailand, Malaysia, and provincial Chinese agencies have rolled out similar grants that cover up to 70% of digital-experience costs, spurring direct procurement of tour software. Tourism boards mandate multilingual narration and accessibility features, thereby expanding the addressable demand among operators targeting international travelers. Program managers increasingly rank virtual tours as prerequisites for marketing support, ensuring priority adoption within funded projects. As a result, public-sector orders act as an anchor client base for vendors entering new markets, supporting recurring revenue in the Asia Pacific virtual tour software market.
E-Commerce Platforms Integrating Immersive Storefronts
Furniture, automotive, and luxury retailers are incorporating 3D showrooms into their websites to bridge the tactile gaps that deter online conversions. Large marketplaces offer plug-in APIs, allowing merchants to drag-and-drop panoramic views without writing code, thereby stimulating uptake among small sellers. Early pilots indicate that dwell time rises by 40%, elevating search rankings and boosting upsell rates. These metrics prompt cross-category imitation, accelerating the adoption of virtual tours beyond real estate and tourism. Reduced cloud rendering fees mean even entry-level merchants can now afford high-resolution product spins. This broadened utility reinforces the strategic relevance of the Asia Pacific virtual tour software market for digital commerce ecosystems.
Restraints Impact Analysis*
| Restraint | (~) % Impact on CAGR Forecast | Geographic Relevance | Impact Timeline |
|---|---|---|---|
| Limited broadband penetration in tier-2 and tier-3 cities | -2.3% | Rural India, Indonesia, Philippines, Vietnam | Medium term (2-4 years) |
| Data-privacy compliance complexities across diverse jurisdictions | -1.8% | Cross-border operations | Short term (≤ 2 years) |
| Fragmentation of device and browser standards | -1.4% | Web-based deployments | Long term (≥ 4 years) |
| High upfront content-creation costs for small businesses | -1.1% | Emerging economies | Medium term (2-4 years) |
| Source: Mordor Intelligence | |||
Limited Broadband Penetration in Tier-2 and Tier-3 Cities
Connectivity gaps remain pronounced in parts of India, Indonesia, and Vietnam, where up to 43.8% of households report inadequate internet quality.[2]Vu Thi Thu Hoai et al., “The Current State of Virtual Reality and Augmented Reality Adoption in Vietnamese Education,” pdfs.semanticscholar.org Slow speeds cause buffering, which undermines the user experience and diminishes conversion rates for education and tourism operators. Providers now embed adaptive streaming and offline modes, but these add development costs and may compromise image resolution. Public-private fiber projects aim to close the divide, though most will not reach completion before 2028. Until then, uneven bandwidth will restrict the Asia Pacific virtual tour software market’s full potential outside large metropolitan areas.
Data-Privacy Compliance Complexities Across Diverse Jurisdictions
From China’s prescriptive cybersecurity law to Japan’s principle-based guidelines, the region’s regulatory patchwork raises legal uncertainty for vendors who store panoramic imagery and user analytics in multitenant clouds.[3]Paulger Dominic, “Navigating Governance Frameworks for Generative AI Systems in the Asia-Pacific,” fpf.org Organizations must localize data residency, encryption, and consent flows for each rollout, which can inflate legal and DevOps budgets. Non-compliance triggers fines or forced shutdowns, deterring smaller entrants and slowing product updates. Large incumbents leverage in-house counsel to maintain regional coverage, adding a competitive moat. Harmonization efforts remain limited, keeping this restraint in place for the short term.
*Our forecasts treat driver/restraint impacts as directional, not additive. The impact forecasts reflect baseline growth, mix effects, and variable interactions.
Segment Analysis
By Deployment Model: Cloud Dominance Accelerates Service Integration
Cloud solutions generated 74.12% revenue in 2024, and the segment is projected to expand at a 21.02% CAGR, outpacing on-premise and hybrid alternatives. Lower upfront capex and automated scaling align perfectly with cost-sensitive buyers, especially SMEs across Southeast Asia. Cloud vendors now bundle CDN acceleration, analytics, and AI-driven hotspot creation, enhancing platform stickiness. The Asia Pacific virtual tour software market size for cloud deployments is forecast to more than triple by 2030, as multicloud strategies ease data sovereignty concerns.
On-premise implementations persist within public agencies and financial institutions where strict compliance mandates local hosting. However, hybrid models that cache sensitive data on-site while streaming panoramic textures from secure clouds are eroding the standalone on-premise share. Providers that certify against ISO 27001 and regional privacy codes win bids by striking a balance between security and scalability. This evolution highlights why integrated service offerings are now accounting for a growing share of revenues across the Asia Pacific virtual tour software industry.


By End-User Industry: Education Emerges as Fastest-Growing Segment
Real estate retained 41.58% revenue in 2024, validating its status as the foundational buyer group. Yet the education vertical is projected to post a 21.34% CAGR to 2030, the highest among all sectors. The Asia Pacific virtual tour software market size for education is expanding as universities incorporate virtual campus visits and lab simulations to broaden their enrollment funnels and enhance learning outcomes. Government digital mandates in China, South Korea, and India allocate grants that offset licensing and hardware costs, further accelerating uptake.
Retail, hospitality, and cultural heritage institutions follow closely, fueled by tourism board incentives and e-commerce strategies. This diversification reduces cyclical exposure to any single sector. For vendors, packaging vertical templates with curriculum alignment or booking integrations emerges as a critical differentiator in the Asia Pacific virtual tour software market.
By Device and Platform: Mobile Platforms Lead Accessibility Revolution
Mobile and tablet usage accounted for 46.23% of revenue in 2024, reflecting smartphone penetration rates that exceed 80% in several countries across the Asia Pacific region. VR headsets, although starting from a smaller base, are projected to grow at a 20.34% CAGR driven by cost declines and new mixed-reality releases from global OEMs. Desktops remain essential for detailed architectural walkthroughs, where large displays and precise inputs are crucial.
Platform fragmentation has historically strained development budgets; however, WebXR progress now enables single-code deployments that auto-scale from mobile browsers to tethered headsets. This standardization reduces time-to-market and unlocks cross-device analytics, enhancing monetization in the Asia Pacific virtual tour software market.

By Component: Services Growth Reflects Integration Demand
Software licenses accounted for 66.81% of 2024 revenue, but professional services are expected to grow at a 21.28% CAGR as buyers seek end-to-end delivery, from 360° shooting to post-deployment analytics. Bundled contracts often renew annually, improving vendor visibility and customer lifetime value. The Asia Pacific virtual tour software market share of services is expanding as clients recognize that content quality and reporting are as crucial as the underlying platform.
Localized agencies deliver language-specific voice-overs and cultural context, addressing tourism boards’ accessibility guidelines. Some software firms acquire niche studios to internalize talent, while others prefer partner ecosystems that scale faster across geographies. Either route reinforces the shift toward service-centric revenue in the Asia Pacific virtual tour software industry.
Geography Analysis
China generated 43.61% of 2024 revenue owing to nationwide broadband coverage and robust government backing for smart education and tourism. Data-localization rules, however, favor domestic clouds, prompting multinationals to rely on joint ventures.[4]Wang Yan et al., “Challenges, Opportunities and Trends of Digitalization in Education in the Asia-Pacific Region,” apec.org
India is the fastest-growing territory with a projected 20.92% CAGR, buoyed by rapid smartphone adoption and an expanding e-commerce base. Government digital-learning programs further catalyze demand, although rural bandwidth gaps temper penetration beyond major metropolitan areas.
Japan and South Korea exhibit high per-capita spending on mixed-reality education and entertainment, driving the uptake of premium features. Southeast Asian markets such as Singapore, Thailand, and Malaysia leverage tourism-funding schemes to stimulate operator adoption, whereas Indonesia and Vietnam see momentum constrained by infrastructure disparities. Collectively, these patterns sustain a multi-speed Asia Pacific virtual tour software market that rewards vendors who tailor licensing and compliance models to local conditions.
Competitive Landscape
The market remains moderately concentrated following CoStar’s USD 1.6 billion acquisition of Matterport, which solidified a premium platform stack that combines 3D capture with property data analytics. Regional challengers such as Walkinto Technologies and CloudPano thrive on price-flexible SaaS tiers and language localization. Hardware makers like Insta360 integrate turnkey publishing modules, bypassing traditional software layers.
Artificial intelligence has become a central battleground. Zillow’s Virtual Staging AI acquisition embeds automated furniture placement, while several APAC startups add real-time personalization based on user click paths. Decentralized GPU marketplaces cut rendering fees by up to 50%, enabling new entrants to undercut established price points.
Strategic partnerships dominate go-to-market roadmaps, with tour vendors aligning with ISP bundles, handset OEMs, and PropTech platforms. This network effect locks users into multi-service ecosystems, reinforcing recurring revenue across the Asia Pacific virtual tour software market.
Asia Pacific Virtual Tour Software Industry Leaders
Matterport Inc.
Zillow Group Inc.
3DVista Espana SL
CloudPano LLC
Insta360 (Arashi Vision Inc.)
- *Disclaimer: Major Players sorted in no particular order

Recent Industry Developments
- March 2025: University of the Philippines researchers validated the acceptance of VR campus tours among distance-learning students.
- April 2025: South Korean scholars published positive findings on VR science curricula in high schools.
- April 2025: Japan's Ministry of Education approved funding for virtual heritage tours using VR and AR technologies.
- February 2025: Prestige Group partnered with a tech startup to offer 360° virtual walkthroughs for luxury projects in Bangalore.


Asia Pacific Virtual Tour Software Market Report Scope
| Cloud-Based |
| On-Premise |
| Real Estate |
| Hospitality and Tourism |
| Education and Training |
| Cultural Institutions and Attractions |
| Retail and E-Commerce |
| Desktop and Laptop |
| Mobile and Tablet |
| VR Headset |
| Software Licenses |
| Services |
| China |
| India |
| Japan |
| Australia |
| South Korea |
| Rest of Asia-Pacific |
| By Deployment Model | Cloud-Based |
| On-Premise | |
| By End-User Industry | Real Estate |
| Hospitality and Tourism | |
| Education and Training | |
| Cultural Institutions and Attractions | |
| Retail and E-Commerce | |
| By Device and Platform | Desktop and Laptop |
| Mobile and Tablet | |
| VR Headset | |
| By Component | Software Licenses |
| Services | |
| By Country | China |
| India | |
| Japan | |
| Australia | |
| South Korea | |
| Rest of Asia-Pacific |


Key Questions Answered in the Report
How large is the Asia Pacific virtual tour software market in 2025?
It stands at USD 0.52 billion and is projected to grow briskly through 2030.
Which deployment model leads in the region?
Cloud-based solutions hold 74.12% revenue due to ease of scaling and lower capex.
What sector is growing the fastest?
Education and training shows a 21.34% CAGR as schools adopt immersive learning.
Which country contributes the highest revenue?
China accounts for 43.61% of 2024 sales, supported by extensive digital infrastructure.
What is the main restraint on wider adoption?
Limited broadband in tier-2 and tier-3 cities still hampers seamless virtual experiences.
How are vendors differentiating their offerings?
They increasingly embed AI for automated staging, analytics, and personalized user pathways.
Page last updated on:


