Asia Pacific Mobile Broadband Market Size and Share
Market Overview
| Study Period | 2019 - 2030 |
|---|---|
| Forecast Data Period | 2025 - 2030 |
| Historical Data Period | 2019 - 2023 |
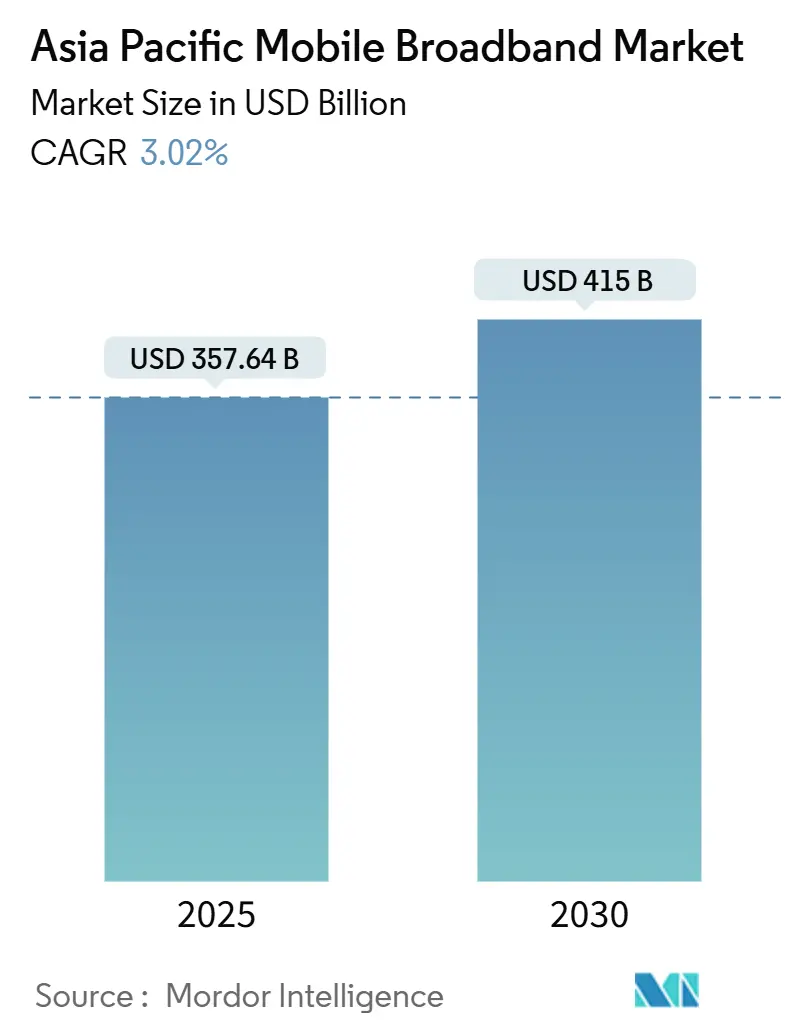
| Market Size (2025) | USD 357.64 Billion |
| Market Size (2030) | USD 415 Billion |
| Growth Rate (2025 - 2030) | 3.02% CAGR |
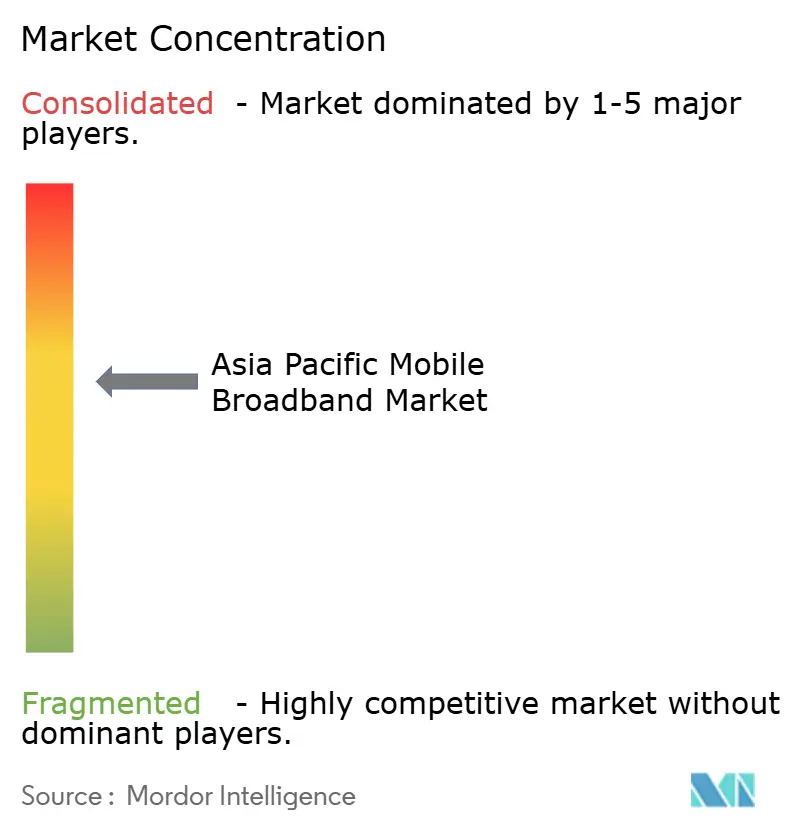
| Market Concentration | Medium |
Major Players
*Disclaimer: Major Players sorted in no particular order Image © Mordor Intelligence. Reuse requires attribution under CC BY 4.0. |
|
Asia Pacific Mobile Broadband Market Analysis by Mordor Intelligence
The Asia Pacific Mobile Broadband Market size is estimated at USD 357.64 billion in 2025, and is expected to reach USD 415 billion by 2030, at a CAGR of 3.02% during the forecast period (2025-2030). The growth pace reflects a shift from subscriber additions toward monetizing next-generation enterprise solutions and premium consumer services as 5G standalone (SA) infrastructure scales across 12 core economies. Operators now anchor expansion strategies on mid-band spectrum, which delivers the optimal mix of capacity and coverage, while mmWave remains constrained to dense micro-cells. Enterprise private 5G networks, edge computing, and network-slicing-enabled service tiers emerge as new value drivers. Meanwhile, affordable 5G handsets priced below USD 150 expand the addressable base, particularly in tier-2 and tier-3 Indian and Southeast Asian cities. Competitive pressure is gradually shifting from pure coverage races to differentiated digital bundles that combine connectivity with cloud, video streaming, fintech, and edge analytics services.
Key Report Takeaways
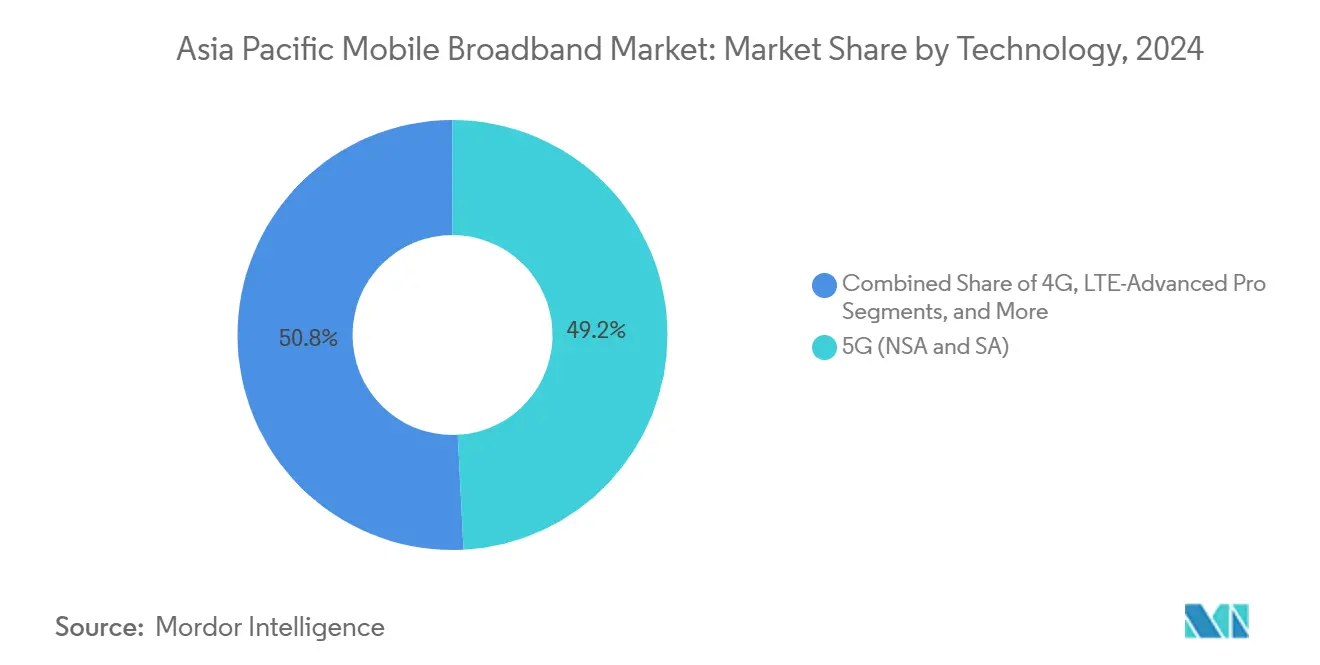
- By technology, 5G (NSA and SA) accounted for a 49.18% share of the Asia Pacific mobile broadband market size in 2024 and is forecasted to grow at a 4.08% CAGR through 2030.
- By service type, mobile data plans accounted for a 73.43% share of the Asia Pacific mobile broadband market in 2024 and are forecasted to grow at a 3.60% CAGR through 2030.
- By end user, the consumer segment generated a 72.72% revenue share in 2024; the enterprise segment is expected to expand at a 5.20% CAGR through 2030.
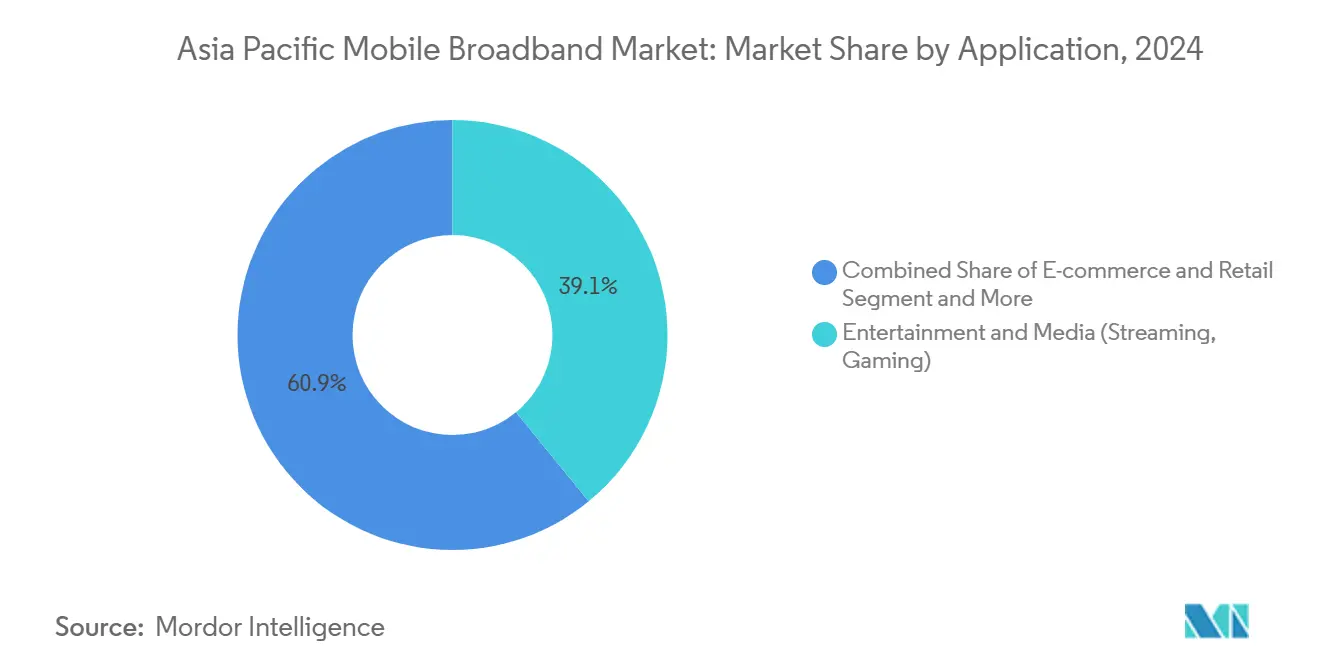
- By application, entertainment and media services captured 39.07% share in 2024, while e-commerce and retail applications are forecast to grow at 5.86% CAGR to 2030.
- By spectrum band, the 1-6 GHz mid-band segment accounted for 57.46% of the Asia Pacific mobile broadband market size in 2024 and is projected to grow at a 5.29% CAGR through 2030.
- By country, China led the Asia Pacific mobile broadband market with 52.46% of the market share in 2024, while India is projected to advance at a 4.55% CAGR through 2030.
Note: Market size and forecast figures in this report are generated using Mordor Intelligence’s proprietary estimation framework, updated with the latest available data and insights as of January 2026.
Future direction is shaped by developments occurring across multiple regions, with Asia contributing to the overall trajectory. The outlook on worldwide mobile broadband market reflects how these are expected to evolve collectively.
Asia Pacific Mobile Broadband Market Trends and Insights
Drivers Impact Analysis*
| Driver | (~) % Impact on CAGR Forecast | Geographic Relevance | Impact Timeline |
|---|---|---|---|
| Rapid 5G Roll-outs and Mid-band Spectrum Auctions Complete Across ≥12 APAC Markets | +0.8% | APAC core markets, spillover to emerging ASEAN | Medium term (2-4 years) |
| Affordable Sub-USD 150 4G/5G Smartphones Widening Addressable Base | +0.6% | India, Southeast Asia, emerging APAC markets | Short term (≤ 2 years) |
| Exploding Mobile Video and Gaming Traffic | +0.5% | Global APAC, concentrated in urban centers | Short term (≤ 2 years) |
| Operator-led Digital-service Bundling (OTT video, cloud, payments) Lifting ARPU | +0.4% | Mature APAC markets, selective emerging economies | Medium term (2-4 years) |
| 5G RedCap Pilots Enabling Massive Industrial IoT Connections | +0.3% | Industrial hubs in China, Japan, South Korea | Long term (≥ 4 years) |
| Malaysia’s Wholesale 5G Model is Proving 30-40% Lower Data-cost Economics | +0.2% | Malaysia, potential ASEAN adoption | Medium term (2-4 years) |
| Source: Mordor Intelligence | |||
Rapid 5G Roll-outs and Mid-Band Spectrum Auctions Drive Infrastructure Modernization
Completed 3.3-3.8 GHz awards across 12 Asia-Pacific economies unlock capacity for nationwide 5G SA coverage, with Thailand’s 2024 auction alone raising USD 3.2 billion and enabling 85% population reach within the same year. [1]National Broadcasting and Telecommunications Commission Thailand, “5G Spectrum Auction Results 2024,” nbtc.go.thSingapore achieved 95% 5G coverage only 18 months after reallocating spectrum blocks, underscoring the efficiency of harmonized regulatory frameworks. Operators prefer mid-band deployments because each site covers four to six times the area of a 28 GHz mmWave site, thereby lowering unit-cost economics. Regional policy alignment now simplifies cross-border roaming, while Japan’s early SA experience demonstrates that network slicing can directly translate into premium enterprise contracts.
Affordable Smartphone Proliferation Expands Market Addressability
Under India’s Production-Linked Incentive program, domestic assembly lowered the average 5G handset prices by 23% in 2024, pushing device penetration above 40% in tier-2 cities. [2]Ministry of Electronics and Information Technology India, “Production Linked Incentive Scheme Progress Report 2024,” meity.gov.inQualcomm’s Snapdragon 4s Gen 2 platform brings sub-USD 100 5G devices to shelves, catalyzing demand across lower-income ASEAN populations. Vietnam’s 2024 tariff cuts boosted 5G handset imports by 35%, demonstrating policy leverage in accelerating uptake. While affordable devices widen adoption, they also squeeze operator margins, compelling investments in network capacity to manage traffic from users with a lower average revenue per user (ARPU).
Mobile Video and Gaming Traffic Explosion Strains Network Infrastructure
TikTok, OTT video, and multiplayer gaming drove 45% data growth in 2024, resulting in peak-hour congestion that now defines capacity planning across the metropolitan APAC region. [3]Akamai Technologies, “State of the Internet Connectivity Report Q3 2024,” akamai.comSouth Korea logged 2.8 exabytes of monthly mobile gaming traffic, equivalent to 38% of total usage, prompting operators to densify their urban small-cell grids. Live-streamed esports and user-generated content shift uplink requirements beyond traditional downlink-centric architectures. Edge caching, content-delivery-network integration, and AI-driven traffic steering are therefore rising on operator capex agendas.
Operator Digital-Service Bundling Strategies Elevate ARPU
China Mobile generated USD 15.2 billion in incremental platform revenue in 2024, equivalent to 18% of its total, by packaging connectivity with cloud storage, e-payments, and OTT video services. Bharti Airtel’s unified platform tied 45 million Indian users to financial-service and entertainment bundles, lifting segment ARPU 22% versus connectivity-only plans. Such strategies combat commoditization by embedding subscribers in multi-service ecosystems, reducing churn, and creating upsell paths into security, edge analytics, and fintech features.
Restraints Impact Analysis*
| Restraint | (~) % Impact on CAGR Forecast | Geographic Relevance | Impact Timeline |
|---|---|---|---|
| Fragmented Spectrum and Delayed 6 GHz Assignments in Emerging ASEAN | -0.4% | Emerging ASEAN markets, limited spillover effects | Medium term (2-4 years) |
| Rural Coverage CAPEX Still ≥1.8× Urban Per-site; ROI < 6 yrs for Many LMICs | -0.6% | Rural areas across emerging APAC economies | Long term (≥ 4 years) |
| Low-income Handset Affordability Gap | -0.3% | Lower-income segments across APAC | Short term (≤ 2 years) |
| Uplink Congestion from Creator-economy Traffic Outpacing Cell-uplink Upgrades | -0.2% | Urban centers, content creation hubs | Short term (≤ 2 years) |
| Source: Mordor Intelligence | |||
Spectrum Fragmentation Delays Network Optimization
Indonesia’s 6 GHz allocation has been pushed back to 2026, forcing operators to squeeze their congested sub-6 GHz holdings and incurring 15-20% higher network-equipment costs compared to harmonized markets. The Philippines experienced an 18-month deployment lag due to reallocation disputes, which slowed 5G coverage build-outs. Without synchronized ASEAN roadmaps, multinational carriers must juggle diverse band plans, which lengthen device-testing cycles and inflate inventory.
Rural Deployment Economics Challenge Market Expansion
Backhaul scarcity, rugged terrain, and sparse populations make rural sites 1.8 times costlier than their urban equivalents, with many lower-middle-income economies facing six-year payback horizons. Universal-service funds typically cover less than 30% of the required outlays, slowing coverage rollouts. India’s USD 6.8 billion BharatNet fiber backbone underscores the scale of intervention needed to anchor rural 5G. Satellite backhaul and neutral-host towers show promise but await supportive licensing frameworks.
*Our forecasts treat driver/restraint impacts as directional, not additive. The impact forecasts reflect baseline growth, mix effects, and variable interactions.
Segment Analysis
By Technology: 5G Networks Anchor Infrastructure Evolution
5G captured 49.18% of the Asia Pacific mobile broadband market share in 2024 and is projected to compound at a 4.08% CAGR through 2030, elevating the Asia Pacific mobile broadband market size for 5G-enabled services. China alone deployed more than 3.2 million base stations by late 2024, creating scale advantages in equipment procurement and ecosystem maturity. LTE remains essential for voice fallback and legacy coverage but faces contracting capex as operators re-allocate budgets to SA cores, edge computing, and network slicing.
Parallel support for legacy and next-generation networks temporarily inflates opex; however, migration to SA unlocks industrial IoT, low-latency robotics, and ultra-reliable connectivity for smart factory segments. Samsung’s 5G RedCap trial validated the low-complexity device integration, signaling a forthcoming surge in massive IoT connections.


By Service Type: Mobile Data Plans Remain Revenue Mainstay
Unlimited data bundles delivered 73.43% of the revenue in 2024 and are expected to grow at a 3.60% CAGR to 2030, as video and gaming adoption expand the Asia Pacific mobile broadband market. As operators shift voice traffic to data networks, the once-prominent voice-over-LTE services, now technically mature, see a dip in revenue contribution. This shift is characterized by a transition from per-minute pricing to more integrated, bundled service models. Meanwhile, with the work-from-home trend showing no signs of waning, mobile hotspot and tethering services are becoming increasingly vital. In response, operators are rolling out tailored plans aimed at remote work; these plans boast an average revenue per user (ARPU) that's notably higher than conventional mobile-only usage.
Data consumption now drives purchasing decisions, with video streaming and gaming apps necessitating unlimited or high-allowance data plans. Operators are adopting tiered service models, offering business users premium network priority and faster speeds, moving beyond traditional data allowance structures. Regulatory frameworks across the APAC region mandate transparent pricing and aim to eliminate billing shocks, prompting operators to implement simplified, unlimited pricing models that enhance the customer experience and stabilize revenues.
By End-User: Enterprise Segment Outpaces Consumer Growth
Consumer connections accounted for 72.72% of revenue in 2024, yet enterprise lines grew faster at a 5.20% CAGR, driven by private 5G deployments in factories, logistics yards, and hospital campuses. These sectors are driving digital transformation by adopting dedicated network capabilities, which move them away from shared consumer networks. By late 2024, private 5G deployments in the APAC region had reached 1,200 installations, with Japan leading the adoption in manufacturing, delivering measurable productivity gains.
With smartphone penetration nearing saturation in mature markets, growth in the consumer segment has slowed, prompting operators to focus on service monetization rather than subscriber acquisition. Enterprise customers, prioritizing guaranteed service levels and network customization, enable operators to achieve ARPU levels 3-4 times higher than consumer averages. Regulatory compliance in healthcare and finance drives demand for dedicated network slices, ensuring data privacy and adherence to regulations while supporting premium pricing models that justify network investments.
By Application: Entertainment Dominates, E-Commerce Accelerates
Entertainment and media took a 39.07% share in 2024, driven by streaming platforms optimizing codecs for 4K mobile displays. However, mobile checkout volumes propel e-commerce to a 5.86% CAGR through 2030, reflecting that digital payment adoption and mobile commerce are expanding across emerging APAC markets. Social media and communication apps maintain a stable presence but face revenue challenges as messaging services shift to over-the-top platforms, bypassing traditional SMS revenue streams.
Healthcare and education apps have accelerated adoption due to pandemic-driven digitization. Telemedicine and remote learning underscore the importance of reliable connectivity and low latency. The diverse application landscape complicates network planning, as services require varying quality-of-service parameters. Operators implement traffic management policies to prioritize critical applications while maintaining network performance. ITU standards for application-aware networking help optimize resources, enhancing user experience and infrastructure efficiency.
By Spectrum Band: Mid-Band Frequencies Dominate Operator Roadmaps
Mid-band held a 57.46% share in 2024 and is projected to expand at a 5.29% CAGR, reinforcing its primacy within the Asia Pacific mobile broadband market size. Sub-1 GHz bands are crucial for rural coverage but are becoming a lower investment priority as operators focus on mid-band deployments in urban areas. Frequencies above 6 GHz, such as mmWave and terahertz, offer ultra-high-speed capabilities but are limited to niche applications due to coverage constraints and high costs.
Mid-band, particularly 3.5 GHz, provides an optimal balance of coverage and capacity, enabling cost-effective population coverage. In spectrum-constrained urban markets, technologies such as dynamic spectrum access enhance frequency utilization. Regulatory frameworks are increasingly supporting flexible spectrum policies, allowing operators to optimize frequency use based on traffic and coverage needs, thereby enhancing network efficiency and service quality.
Geography Analysis
China generated 52.46% of the 2024 regional revenue, thanks to a policy-mandated three-operator build-out that surpassed 3.2 million 5G base stations, giving Chinese carriers unrivaled unit network costs and spectrum depth. State-backed infrastructure funds continue to subsidize rural expansion, but growth moderates as subscriber penetration nears saturation and ARPU plateaus. Operators now focus on monetizing edge-cloud and industrial use cases while bundling OTT video and fintech services to retain users.
India is the fastest-growing part of the Asia Pacific mobile broadband market, with a 4.55% CAGR projected to 2030. Reliance Jio’s low-cost data rates and rapid tower roll-out earned 450 million subscribers by 2024, catalyzing national mobile-first digitization. Government campaigns, such as Digital India and BharatNet, accelerate fiber backhaul and digital service adoption in healthcare, education, and payments. The scale of rural opportunity continues to drive operators' investment in mid-band coverage, even as profitability hinges on ARPU uplift from freemium content bundles.
Japan and South Korea exhibit mature penetration but lead global experimentation in 5G SA, network slicing, and RedCap IoT pilots. Operators differentiate through enterprise SLAs for manufacturing automation and smart-city governance, exporting solution know-how to emerging ASEAN partners. Australia and New Zealand grapple with continent-scale geography; satellite backhaul and neutral hosts become crucial for connecting sparse communities. Elsewhere, ASEAN nations move at varied tempos: Singapore showcases near-ubiquitous indoor 5G, Malaysia pioneers a wholesale model, while Indonesia, the Philippines, and Vietnam still resolve spectrum and tower-permitting bottlenecks.
Analysis of the mobile broadband market by Mordor Intelligence spans multiple other regional evaluations across North America, Middle East, and South America.
Competitive Landscape
Established operators maintain regional dominance; however, they are increasingly challenged by competition from digital service platforms and infrastructure-sharing initiatives. China Mobile invests USD 12.8 billion in 2025 to expand edge-cloud zones and SA reach into Tier 2 cities, targeting industrial IoT contracts. Reliance Jio utilizes integrated fiber-to-home and content suites to cross-sell fintech wallets and streaming apps, thereby locking users into its digital ecosystem.
Shared-infrastructure models are gaining traction as cost pressures intensify. Malaysia’s single wholesale network approach delivers 30-40% lower data gigabyte costs and stimulates debate over similar frameworks in Indonesia and Thailand. Carriers also offload tower portfolios to REIT-style entities to free balance sheets for spectrum and cloud investments.
Technology vendors are deepening their collaboration with operators to integrate AI-driven, self-optimizing networks; Samsung’s patent filings outline machine-learning engines for predictive congestion management. Open RAN pilots in Japan and Australia are testing cost reductions and vendor diversity, although widespread commercial adoption remains nascent, pending performance validation.
Asia Pacific Mobile Broadband Industry Leaders
-
China Mobile Limited
-
SK Telecom Co., Ltd.
-
KT Corporation
-
Reliance Jio Infocomm Limited
-
NTT Docomo, Inc.
- *Disclaimer: Major Players sorted in no particular order

Recent Industry Developments
- August 2025: China Mobile earmarked USD 12.8 billion for 2025 to extend 5G SA and edge-computing across tier-2 cities, reflecting a 15% capex uptick over 2024.
- May 2025: Bharti Airtel launched prepaid entertainment packs bundling 25+ OTT platforms at INR 279, alongside unlimited 5G data and calls at INR 598, illustrating ARPU-lift bundling strategies.


Asia Pacific Mobile Broadband Market Report Scope
| 4G |
| 5G (NSA and SA) |
| LTE-Advanced Pro |
| Wi-Fi |
| Other Technologies (NB-IoT, LoRaWAN, etc.) |
| Mobile Data Plans |
| Voice-over-LTE (VoLTE) |
| Mobile Hotspot / Tethering |
| Consumers |
| Businesses/Enterprises |
| Entertainment and Media (Streaming, Gaming) |
| E-commerce and Retail |
| Social Media and Communication |
| Healthcare and Education |
| Other Applications |
| Sub-1 GHz (Coverage bands) |
| 1–6 GHz (Mid-band) |
| >6 GHz mmWave and Terahertz |
| China |
| India |
| Japan |
| South Korea |
| Australia and New Zealand |
| Rest of Asia Pacific |
| By Technology | 4G |
| 5G (NSA and SA) | |
| LTE-Advanced Pro | |
| Wi-Fi | |
| Other Technologies (NB-IoT, LoRaWAN, etc.) | |
| By Service Type | Mobile Data Plans |
| Voice-over-LTE (VoLTE) | |
| Mobile Hotspot / Tethering | |
| By End-User | Consumers |
| Businesses/Enterprises | |
| By Application | Entertainment and Media (Streaming, Gaming) |
| E-commerce and Retail | |
| Social Media and Communication | |
| Healthcare and Education | |
| Other Applications | |
| By Spectrum Band | Sub-1 GHz (Coverage bands) |
| 1–6 GHz (Mid-band) | |
| >6 GHz mmWave and Terahertz | |
| By Country | China |
| India | |
| Japan | |
| South Korea | |
| Australia and New Zealand | |
| Rest of Asia Pacific |


Key Questions Answered in the Report
How large is the Asia Pacific mobile broadband market in 2025?
The Asia Pacific mobile broadband market size is valued at USD 357.64 billion in 2025.
What is the expected CAGR for Asia Pacific mobile broadband through 2030?
The market is projected to grow at a 3.02% CAGR from 2025 to 2030.
Which technology segment dominates Asia Pacific mobile broadband?
5G leads with 49.18% share in 2024 and a forecast 4.08% CAGR to 2030.
Which country is expanding fastest in mobile broadband usage?
India is advancing at a 4.55% CAGR through 2030, driven by affordable devices and rural expansion.
Why are mid-band frequencies critical for Asia Pacific operators?
The 1–6 GHz mid-band delivers the best balance of coverage and capacity, holding 57.46% market share in 2024 and growing at 5.29% CAGR.
How are operators increasing ARPU in mature markets?
They bundle connectivity with OTT video, cloud storage, and mobile payments, lifting ARPU by up to 22% among bundled subscribers.
Page last updated on:


