Asia Pacific Global Capability Centers Market Size and Share
Market Overview
| Study Period | 2019 - 2030 |
|---|---|
| Forecast Data Period | 2025 - 2030 |
| Historical Data Period | 2019 - 2023 |
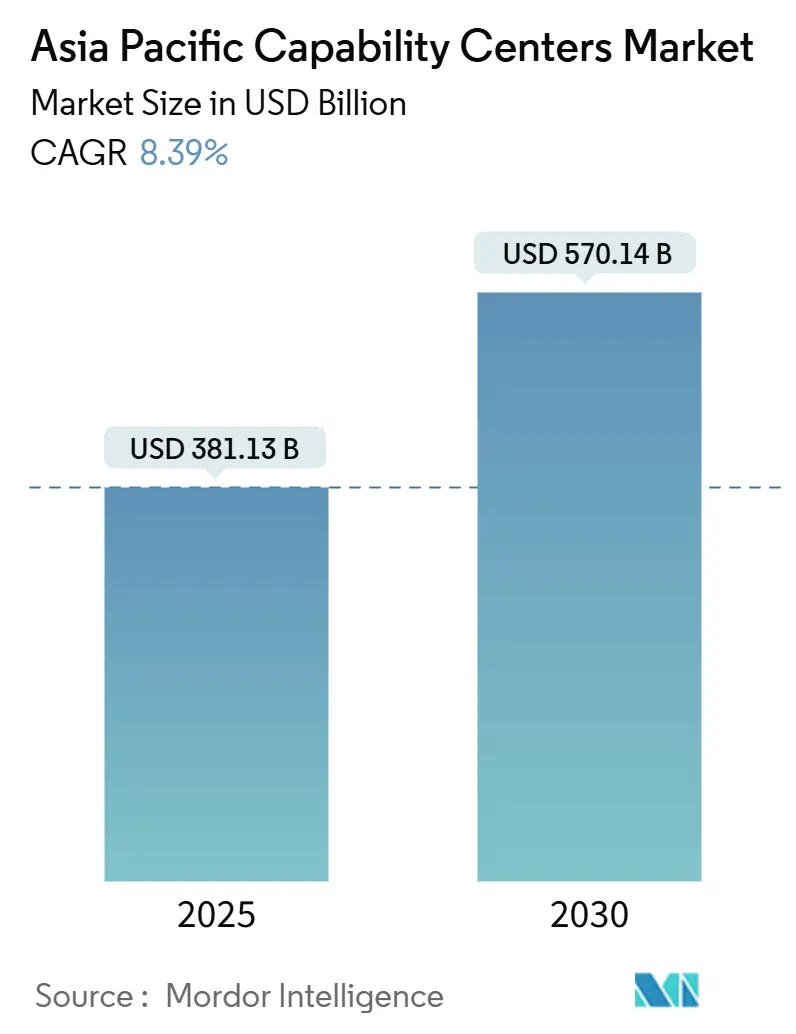
| Market Size (2025) | USD 381.13 Billion |
| Market Size (2030) | USD 570.14 Billion |
| Growth Rate (2025 - 2030) | 8.39% CAGR |
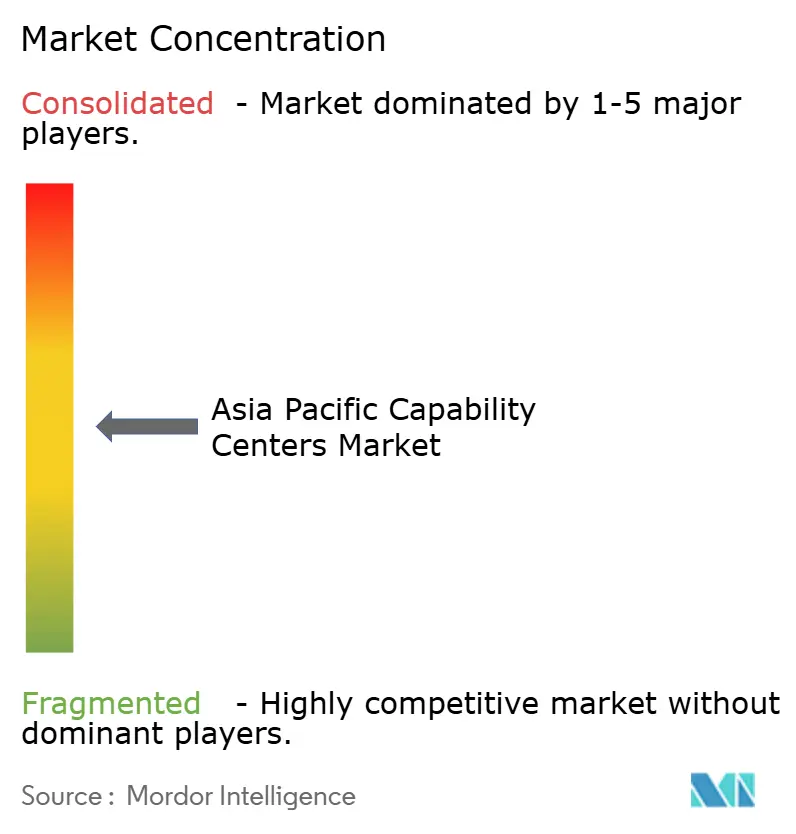
| Market Concentration | Medium |
Major Players *Disclaimer: Major Players sorted in no particular order Image © Mordor Intelligence. Reuse requires attribution under CC BY 4.0. | |
Asia Pacific Global Capability Centers Market Analysis by Mordor Intelligence
The Asia Pacific global capability centers market size is valued at USD 381.13 billion in 2025 and is projected to reach USD 570.14 billion by 2030, growing at an 8.39% CAGR over the forecast period. Expansion rests on enterprises replacing traditional outsourcing with innovation-led hubs that orchestrate cloud-native architectures, artificial intelligence pipelines, and sustainability analytics. Governments across China, India, Singapore, and Vietnam continue to sponsor large-scale talent-skilling and infrastructure programs, widening the accessible labor pool and compressing setup timelines. Provider participation in design-build models is also increasing, which shortens ramp-up cycles and aligns centers with their parent company's digital transformation roadmaps. At the same time, escalating salary costs in mature hubs and tightening data-sovereignty laws push organizations toward multi-hub footprints that balance risk, compliance, and access to specialized skills.
Key Report Takeaways
- By function and capability, Information Technology and Digital Services led with 60.27% revenue share in 2024; Engineering and Research and Development is projected to expand at an 8.77% CAGR to 2030.
- By engagement model, the captive approach held 57.83% of the Asia Pacific global capability centers market share in 2024, while hybrid Build-Operate-Transfer is registering the fastest growth at 9.21% through 2030.
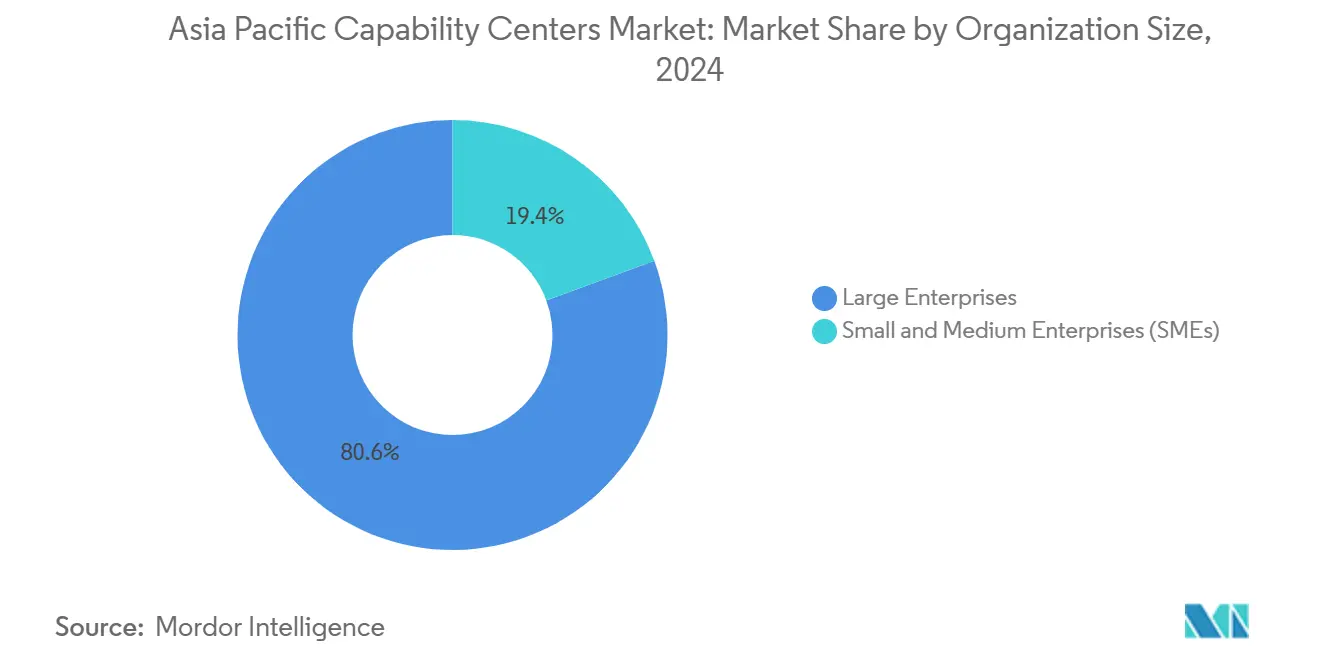
- By organization size, large enterprises accounted for 80.62% of 2024 revenues, whereas small and medium enterprises are set to log the highest 10.22% CAGR during 2025-2030.
- By industry vertical, Banking, Financial Services, and Insurance captured 36.29% of 2024 revenues; Manufacturing, Automotive, and Industrial applications are forecast to grow at 9.18% CAGR in the same horizon.
- By country, China retained a 57.81% share in 2024, while Vietnam recorded the strongest 9.38% CAGR outlook for the period up to 2030.
Asia Pacific Global Capability Centers Market Trends and Insights
Drivers Impact Analysis*
| Driver | (~) % Impact on CAGR Forecast | Geographic Relevance | Impact Timeline |
|---|---|---|---|
| Rapid digital transformation priorities among multinationals | +2.1% | Global, with a concentration in China, India, and Singapore | Medium term (2-4 years) |
| Acceleration of cloud-native engineering requirements | +1.8% | APAC core, spill-over to emerging Southeast Asian markets | Short term (≤ 2 years) |
| Government-backed talent-skilling programs for Global Capability Centers | +1.5% | India, Singapore, Malaysia, Vietnam, Philippines | Long term (≥ 4 years) |
| Rising costs in traditional offshoring hubs are prompting near-shore Asia Pacific expansion | +1.2% | Vietnam, Philippines, Indonesia, Thailand | Medium term (2-4 years) |
| ESG compliance mandates driving captive sustainability analytics centers | +0.9% | Singapore, Australia, Japan, with expansion to China and India | Long term (≥ 4 years) |
| Availability of "plug-and-play" Global Capability Center campuses reduces time-to-build | +0.8% | India, Philippines, Malaysia, Singapore | Short term (≤ 2 years) |
| Source: Mordor Intelligence | |||
Rapid Digital Transformation Priorities Among Multinationals
Global enterprises are elevating centers from cost-reduction units to strategic nerve centers that own product road maps, embed advanced analytics, and support enterprise-wide digital programs. In India, more than half of the 1,700 active centers have already migrated into portfolio-and-transformation roles, a shift expected to reach roughly 70% penetration by 2026.[1]“India's Global Capability Center Count Rises to 1,700,” The Economic Times, economictimes.indiatimes.com Transformational mandates translate into larger budgets for AI-enabled customer support, risk modeling, and supply-chain optimization. As parent firms seek region-specific innovation, Global Capability Centers become homes to micro-products tailored for local regulations, languages, and consumer behaviors, strengthening competitive moats that simple outsourcing cannot replicate. This strategic zigzag curbs exposure to volatile vendor markets and secures proprietary intellectual property under direct corporate stewardship.
Acceleration of Cloud-Native Engineering Requirements
Monolithic applications continue to be refactored into container-based microservices hosted within hyperscale regions across the Asia Pacific. Google’s USD 2 billion commitment to Malaysia and Microsoft’s USD 2.9 billion investment in Japan strengthen regional low-latency cloud grids and drive greater clustering of Global Capability Center near those zones. A 12.2 GW operational data-center footprint, reinforced by another 14.46 GW under construction, positions the region to manage the surging 1.8 billion mobile subscribers who already inject USD 880 billion into local economies.[2]World Bank, “East Asia and Pacific Economic Update 2024,” worldbank.org Proximity to this capacity reduces round-trip delays and satisfies data-residency requirements, enabling centers to roll out continuous-integration pipelines that shorten release cycles from weeks to days. Technical sophistication raises entry barriers, encouraging large firms to retain or internalize ownership, yet it also fuels demand for specialist providers capable of accelerating the re-platforming journey.
Government-Backed Talent-Skilling Programs for Global Capability Centers
Public-sector interventions aim to address AI and cybersecurity talent shortages that officially affect more than half of the professional workforce across the Asia Pacific. India’s National Framework for Global Capability Centers channels fiscal incentives and up-skilling grants toward tier-2 cities, while Singapore’s conversion programs fast-track mid-career workers into data science and cloud engineering roles. Malaysia allocates targeted funds in its 2025 budget to enhance Industry 4.0 competencies, and universities in Vietnam integrate DevOps coursework to bridge practice-ready gaps. Such policies generate multiplier effects that extend beyond individual sites by fostering cluster ecosystems comprising vendors, academia, and venture capital. Corporations benefit from steady pipelines of graduates certified in globally harmonized curricula, which cuts onboarding spend and stabilizes attrition.
Rising Costs in Traditional Offshoring Hubs Prompting Near-Shore Expansion
Wage escalation in high-density metros places stress on historical cost arbitrage. In premier locations, engineering salaries grew at double-digit rates in 2025, eroding the savings that once justified centralized footprints. Emerging economies, including Vietnam, Indonesia, and the Philippines, offer more moderate 6-7% salary inflation and expanding STEM cohorts, making them prime nodes for overflow or specialized centers. Organizations, therefore, design multi-hub frameworks that distribute workloads across geographies, depending on the urgency, sensitivity, and regulatory requirements. Savings redirected from salary line items fund automation pilots and bonus pools capable of retaining scarce niche experts, illustrating a virtuous circle of cost optimization and capability uplift.
Restraints Impact Analysis*
| Restraint | (~) % Impact on CAGR Forecast | Geographic Relevance | Impact Timeline |
|---|---|---|---|
| Intensifying salary inflation in top-tier cities | -1.4% | Singapore, Hong Kong, Japan, Australia, and major Indian metros | Short term (≤ 2 years) |
| Data-sovereignty regulations restricting cross-border worksharing | -1.1% | China, Singapore, and Australia, with emerging restrictions in Southeast Asia | Medium term (2-4 years) |
| Competition for senior engineering leadership talent | -0.8% | Regional hubs across APAC, particularly Singapore, Bangalore, and Shanghai | Medium term (2-4 years) |
| Fragmented local vendor ecosystem in emerging Southeast Asian countries | -0.6% | Vietnam, Philippines, Indonesia, Thailand | Long term (≥ 4 years) |
| Source: Mordor Intelligence | |||
Intensifying Salary Inflation in Top Tier Cities
The ballooning demand for artificial intelligence, cloud security, and full-stack engineering has pushed median pay in premier hubs to all-time highs. Mid-level software developers in Singapore now earn USD 5,000 to USD 6,000 per month, while senior AI scientists in major Chinese metros exceed the USD 100,000 annual mark.[3]Elton Chan, “Tech Recruitment in Asia Pacific,” SecondTalent.com, secondtalent.com Companies combat the margin squeeze by offering employee stock programs, accelerated rotation schemes, and hybrid work options; yet, attrition still tilts upward. The cost burden is magnified when centers scale beyond 1,000 FTEs, prompting a calculable pivot toward lower-cost adjunct sites for Level-2 support and process automation teams.
Data-Sovereignty Regulations Restricting Cross-Border Work sharing
Almost every large economy in the Asia Pacific has introduced or tightened local-data provisions, which complicate cross-jurisdictional replication. China prescribes explicit security reviews for datasets exiting its borders, and Australia now mandates critical-infrastructure entities to store sensitive telemetry domestically. ASEAN members remain fragmented, forcing multinationals to establish distinct data classification rules for each host nation. The resulting compliance overhead can delay project rollouts by several quarters and prompt firms to invest in redundant onshore computing, thereby dampening the productivity gains expected from centralized shared-service operations.
*Our forecasts treat driver/restraint impacts as directional, not additive. The impact forecasts reflect baseline growth, mix effects, and variable interactions.
Segment Analysis
By Function / Capability: Digital Services Retain Commanding Share
Information Technology and Digital Services secured 60.27% of 2024 revenue and is pacing at an 8.77% CAGR, underscoring its primacy in shaping the Asia Pacific global capability centers market. This base involves application modernization, platform engineering, and cloud operations, all of which fuel corporate digitization at scale. The segment’s dominance stems from board-level mandates to migrate legacy monoliths into high-availability, AI-ready stacks. Engineering and Research and Development contribute a rapidly growing tranche, expanding 1.3 times faster than the headline rate as firms incubate product prototypes, sensor fusion algorithms, and digital twin simulations. The Asia Pacific global capability centers market size for these innovation-heavy workloads is projected to expand further, as every incremental product upgrade requires cross-disciplinary teams, real-time analytics, and global deployment orchestration.
Parallel momentum arises from more than 185 AI and machine-learning centers of excellence that now operate inside the regional footprint, with roughly one-third hosted by software or internet firms. Such centers evaluate synthetic data generation, advanced risk scoring, and natural-language search, all of which feed directly into revenue-generating channels. Process-led segments still occupy stable niches: business process management leverages robotic process automation to lift straight-through processing ratios, and knowledge process outsourcing synthesizes market intelligence for executive decisions. Converging factors suggest that non-digital functions will continue to migrate toward automation, while human talent concentrates on upstream design, architecture, and customer-experience layers.


By Engagement Model: Hybrid BOT Gains Ground
Captive builds held a 57.83% share in 2024 because IP stewardship and cybersecurity oversight remain paramount for highly regulated industries. Even so, hybrid Build-Operate-Transfer schemes are emerging at a 9.21% CAGR as enterprises seek startup agility without sacrificing final ownership. In a hybrid transaction, providers assemble the shell entity, recruit the founding team, and stabilize operations across 18-24 months, after which the parent takes full control. The arrangement mitigates operational risk early on and reduces the long-run total cost of ownership.
Provider involvement now accounts for nearly 50% of gross setups. This intermediation not only assures compliance with local labor codes and real estate statutes but also grants ready access to DevOps, cybersecurity, and regulatory specialists who are scarce in-house. For niche or peripheral functions, some firms still prefer classic BOT terms where vendors fully manage operations until maturity thresholds are met. However, the swing toward hybrid epitomizes a broader trust model: organizations are willing to outsource build speed yet retain strategic reign once throughput and security baselines prove solid.
By Organization Size: SMEs Break In
Large enterprises exert an overwhelming influence, commanding 80.62% of the revenue in 2024, primarily because Fortune 500 companies possess budgets to launch multi-functional, multi-country networks that mirror their corporate profit and loss (P&L) architectures. Their centers frequently exceed 2,000 employees, integrating engineering, finance, and customer-experience pods under one roof. Conversely, the small and medium enterprise cohort is growing at a 10.22% CAGR, as shared campuses and subscription-based infrastructure are erasing many historical entry barriers. Plug-and-play real estate parks, complete with managed connectivity and security, enable 100-seat teams to go live within weeks.
Roughly 40 technology unicorns are expected to establish India centers by late 2024, underscoring the appeal for high-growth disruptors that require direct control over their product pipelines. As tooling and compliance templates become standardized, mid-market manufacturers and digital-first retailers have begun blazing similar trails, reinforcing democratization across the Asia Pacific global capability centers market. The narrative suggests that segment polarization will soften over time, with SMEs diverting work from third-party outsourcers into their own captive micro-sites.
By Industry Vertical: Manufacturing Accelerates
The Banking, Financial Services, and Insurance (BFSI) sector continued to lead the industry in 2024, with a 36.29% share, driven by regulatory reporting, anti-money laundering analytics, and the rollout of open banking platforms. Core banking migrations to cloud and the advent of embedded finance demand specialized risk engines, cementing this vertical’s need for robust Global Capability Center footprints. Meanwhile, the Manufacturing, Automotive, and Industrial lines are projected to chart a 9.18% CAGR through 2030, as Industry 4.0 priorities shift budgets toward digital twin pilots, predictive maintenance, and sustainability dashboards. The Asia Pacific global capability centers market size for manufacturing-oriented analytics is widening in tandem with reshoring initiatives that require real-time supplier visibility.
Telecom and information technology companies utilize centers for 5G core software validation and network performance analytics. Healthcare and life sciences organizations are focusing their efforts on clinical data management and remote patient monitoring stacks, both of which are capital-intensive yet deliver high value in terms of compliance. Retailers employ AI orchestration to refine inventory positioning, personalize promotions, and power immersive commerce, showcasing how digital building blocks permeate virtually every customer touchpoint.
Geography Analysis
China captured 57.81% of the global capability centers market share in 2024, underscoring the scale advantages that stem from its vast engineering workforce and government-backed technology subsidies. National incentives include tax holidays, real estate concessions, and grant funding that accelerate the launch of multi-function campuses. Centers in Shenzhen and Shanghai now manage full life-cycle product builds, including hardware prototyping and regional customer support desks. Operators still navigate strict data-sovereignty rules, so many install duplicate on-shore compute clusters to serve export markets while keeping sensitive data inside China. These compliance investments raise capital outlays yet preserve access to an unmatched talent reservoir that sustains complex digital programs.
India held the second-largest position and hosted more than 1,700 centers, equivalent to a significant share of the global capability centers market size for the Asia Pacific.[4]Press Trust of India, “India's Global Capability Center Count Rises to 1,700, Revenue Climbs to USD 64.6 Billion,” Business Standard, business-standard.comThe country offers labor costs up to 40% lower than Eastern Europe, deep English fluency, and a thriving vendor ecosystem that simplifies scale-up. A national framework announced in 2025 directs fiscal benefits toward tier-2 cities, such as Kochi and Coimbatore, thereby trimming real-estate costs and alleviating saturation in Bengaluru and Hyderabad. Early adopters report up to 25% faster hiring cycles in these emerging metropolitan areas, which helps stabilize attrition rates. The push beyond primary hubs distributes economic gains while giving operators redundancy against climate or policy shocks in any single city.
Vietnam leads growth with a projected 9.38% CAGR for 2025-2030, anchored by STEM graduates who command wages that remain below regional averages. Ho Chi Minh City offers turnkey campuses equipped with managed security, connectivity, and workspace, enabling mid-sized firms to go live within weeks. Singapore operates as a high-value command center, housing treasury, regulatory, and analytics teams, while the Philippines excels in customer experience and software quality assurance, thanks to its widespread proficiency in English. Indonesia contributes large talent pools suitable for scale-heavy support functions, and Australia supplies niche skills in mining technology, energy trading, and cybersecurity. This multi-hub map enables enterprises to balance cost, risk, and compliance while securing proximity to specialized skill clusters throughout the Asia Pacific.
Competitive Landscape
Competition remains moderately fragmented, with the top five service providers controlling a significant share of installed capacity, leaving ample room for niche specialists to thrive. Systems integrators, such as Accenture, TCS, and Infosys, compete directly with the Big Four consulting arms and with focused enablers like ANSR, which deliver build-operate-transfer blueprints. Provider participation has doubled over the past five years, and turnkey engagements now account for approximately 40% of new center launches, as clients seek faster operational readiness. This surge in third-party involvement shortens ramp-up timelines from 18 months to approximately 9 months, compressing the time to value for parent companies. Larger players sustain a lead by bundling talent acquisition, facility management, and cloud migration into single-invoice packages that appeal to global conglomerates.
Strategic investments highlight the escalating battle for differentiation. Accenture has invested USD 170 million in ANSR to enhance its rapid-deployment platform for next-generation centers, signaling a deeper collaboration between integrators and specialist builders. Infosys expanded its Meridian platform to include pre-built compliance templates that help clients satisfy local data-residency statutes in China and Australia. TCS rolled out an AI-enabled workforce-planning module that predicts attrition risk and optimizes bench strength across multi-country hubs. These technology layers create tangible switching costs because proprietary analytics underpin resource scheduling, performance dashboards, and regulatory reporting. Providers also co-invest with governments in talent academies that certify graduates in cloud security and DevOps, ensuring a steady labor pipeline.
Emerging challengers exploit white-space segments by offering deep vertical focus. Boutique firms in Singapore specialize in ESG data orchestration for asset managers, while Vietnam-based startups focus on low-code and robotic process automation services targeting mid-sized manufacturers. Cybersecurity vendors in Australia are deploying zero-trust blueprints tailored to the needs of mining and energy clients. The resulting mix of scale operators and specialists provides buyers with a spectrum of partnership models, ranging from end-to-end outsourcing to targeted capability augmentation. Continued deal flow suggests that consolidation will remain limited, and innovation niches will persist as long as client demand fragments across technologies, industries, and compliance regimes.
Asia Pacific Global Capability Centers Industry Leaders
IBM Corporation
Microsoft Corporation
Google LLC
Capgemini SE
Accenture plc
- *Disclaimer: Major Players sorted in no particular order

Recent Industry Developments
- February 2025: BlackRock confirmed plans to add 1,200 staff across Mumbai and Gurugram and integrate a Bangalore center acquired via the proposed Preqin deal.
- February 2025: TVS Motor Company earmarked INR 2,000 crore (USD 240 million) to build a Mysuru center housing engineers, designers, and AI experts.
- February 2025: Lennox India allocated USD 6 million to scale its Chennai center from 900 to 1,500 employees.
- February 2025: HCLTech inaugurated a 3.2-lakh-square-foot Hyderabad delivery site designed for 5,000 professionals.


Asia Pacific Global Capability Centers Market Report Scope
The scope of the global capability center study for the market segmentation by the Function/Capability for (i) Information Technology (IT) and Digital Services segment is limited to Software Development, Cloud and Infrastructure Management, Cybersecurity, Data Analytics and AI/ML; (ii) Engineering / ER&D segment is limited to Product Design and Testing, Embedded Systems, Digital Twin / Simulation; (iii) Business Process Management (BPM) segment is limited to Finance and Accounting, HR, Payroll and Talent Management, Procurement, Customer Service; and (iv)Knowledge Process Outsourcing (KPO) segment is limited to Market Research and Insights, Risk and Compliance, Legal and Regulatory Support, Strategy and Consulting Support. Similarly, for segmentation by the Engagement Model, scope for (i) Hybrid Build-Operate-Transfer (BOT) is limited to Joint Venture / Strategic Partnership and Virtual Captive Model. The rest of the segment scope is as specified for the listed segment.
| Information Technology (IT) and Digital Services |
| Engineering / ER&D |
| Business Process Management (BPM) |
| Knowledge Process Outsourcing (KPO) |
| Captive (Self-Build) / In-house |
| Build-Operate-Transfer (BOT) |
| Hybrid Build-Operate-Transfer (BOT) |
| Large Enterprises |
| Small and Medium Enterprises (SMEs) |
| Banking, Financial Services, and Insurance (BFSI) |
| Telecom and IT |
| Healthcare and Life Sciences |
| Manufacturing, Automotive and Industrial |
| Retail and Consumer Goods |
| Other Industry Verticals |
| China |
| India |
| Indonesia |
| Singapore |
| Philippines |
| Vietnam |
| Australia |
| Rest of Asia Pacific |
| By Function / Capability | Information Technology (IT) and Digital Services |
| Engineering / ER&D | |
| Business Process Management (BPM) | |
| Knowledge Process Outsourcing (KPO) | |
| By Engagement Model | Captive (Self-Build) / In-house |
| Build-Operate-Transfer (BOT) | |
| Hybrid Build-Operate-Transfer (BOT) | |
| By Organization Size | Large Enterprises |
| Small and Medium Enterprises (SMEs) | |
| By Industry Vertical | Banking, Financial Services, and Insurance (BFSI) |
| Telecom and IT | |
| Healthcare and Life Sciences | |
| Manufacturing, Automotive and Industrial | |
| Retail and Consumer Goods | |
| Other Industry Verticals | |
| By Country | China |
| India | |
| Indonesia | |
| Singapore | |
| Philippines | |
| Vietnam | |
| Australia | |
| Rest of Asia Pacific |


Key Questions Answered in the Report
What is the projected value of the Asia Pacific global capability centers market in 2030?
The market is forecast to reach USD 570.14 billion by 2030.
Which segment currently holds the largest share of Global Capability Center revenue?
Information Technology and Digital Services account for 60.27% of the 2024 revenue.
Which engagement model is expanding fastest in the Asia Pacific centers?
The hybrid Build-Operate-Transfer model is growing at a 9.21% CAGR through 2030.
Which country shows the highest growth rate for new centers?
Vietnam leads with a 9.38% CAGR expected from 2025-2030.
Why are enterprises adopting multi-hub Global Capability Center strategies?
They aim to offset salary inflation, comply with data-sovereignty laws, and access specialized skill pools across different geographies.
How will the manufacturing vertical impact the growth of the Global Capability Center?
Manufacturing, Automotive, and Industrial applications are expected to grow at a 9.18% CAGR, driven by Industry 4.0 and supply-chain digitization initiatives.
Page last updated on:


