Market Overview
| Study Period | 2021 - 2031 |
|---|---|
| Forecast Data Period | 2026 - 2031 |
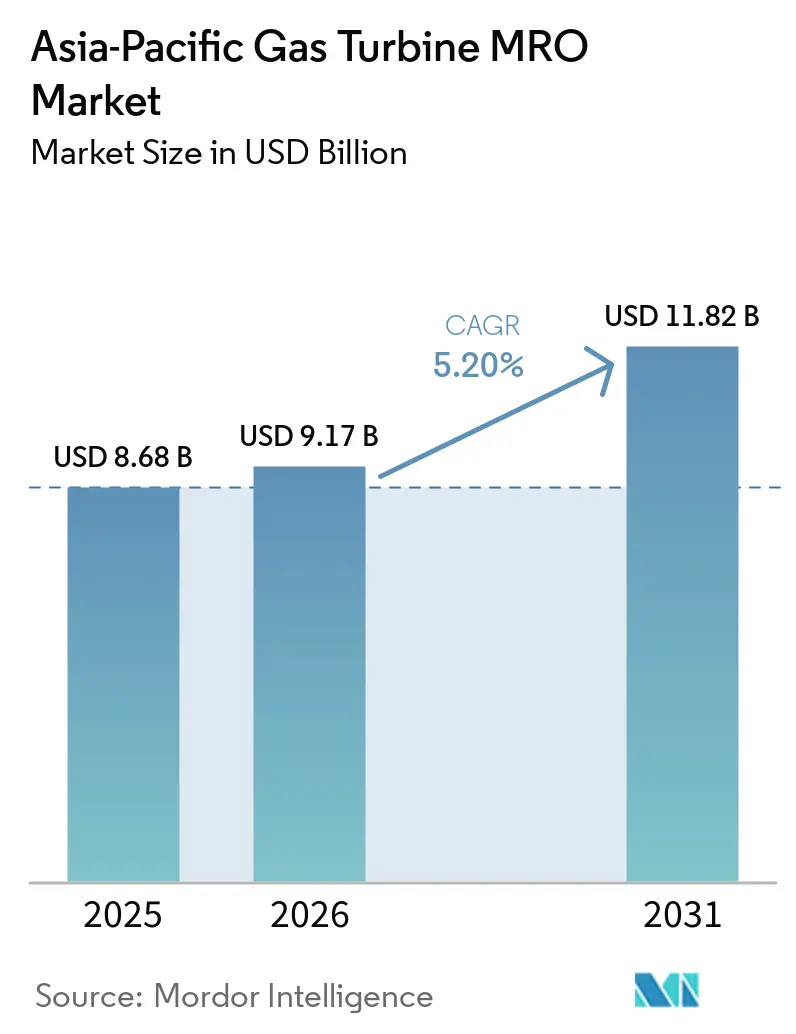
| Base Year Market Size (2025) | USD 8.68 Billion |
| Market Size (2026) | USD 9.17 Billion |
| Market Size (2031) | USD 11.82 Billion |
| Growth Rate (2026 - 2031) | 5.20% CAGR |
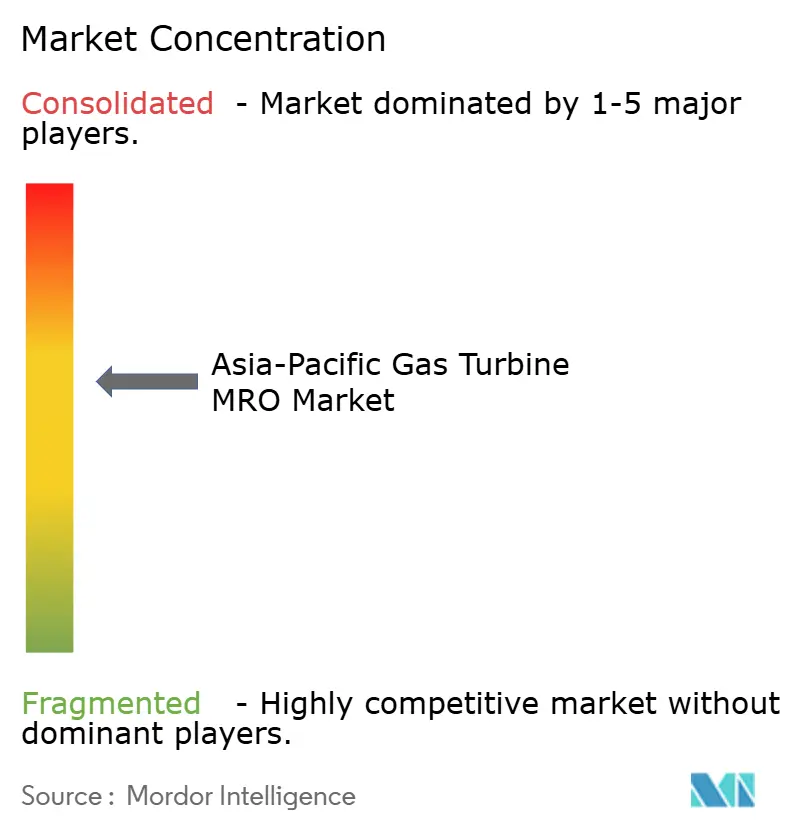
| Market Concentration | Medium |
Major Players *Disclaimer: Major Players sorted in no particular order Image © Mordor Intelligence. Reuse requires attribution under CC BY 4.0. | |
Asia-Pacific Gas Turbine MRO Market Analysis by Mordor Intelligence
The Asia-Pacific Gas Turbine MRO Market size is expected to increase from USD 8.68 billion in 2025 to USD 9.17 billion in 2026 and reach USD 11.82 billion by 2031, growing at a CAGR of 5.20% over 2026-2031.
A maturing fleet of heavy-duty combined-cycle plants, policy-driven coal-to-gas conversions, and the rise of aeroderivative peakers for data-center resiliency together give the market a dual-track growth pattern in which long-term service agreements dominate large-unit spending while opportunistic repairs proliferate in smaller installations. Digital-twin platforms deployed by OEMs are cutting forced outages by up to 18%, shifting value from reactive part replacement to predictive analytics subscriptions.[1]GE Vernova, “SmartSignal Case Study,” gevernova.com Hot-section casting shortages, however, lengthen lead times to 18 months, inviting independent service providers to capture share with remanufactured components that arrive in eight months. The widening technician gap in ASEAN is forcing operators to fly in crews, eroding the cost advantage of regional hubs and putting a premium on remote diagnostics. Meanwhile, hydrogen-ready retrofits in Australia, Japan, and South Korea are accelerating unscheduled mid-life inspections that reset overhaul clocks but raise annual MRO spend per unit by USD 1.2 million.[2]Korea Electric Power Corporation, “Hydrogen Pilot at Dangjin,” kepco.co.kr
Key Report Takeaways
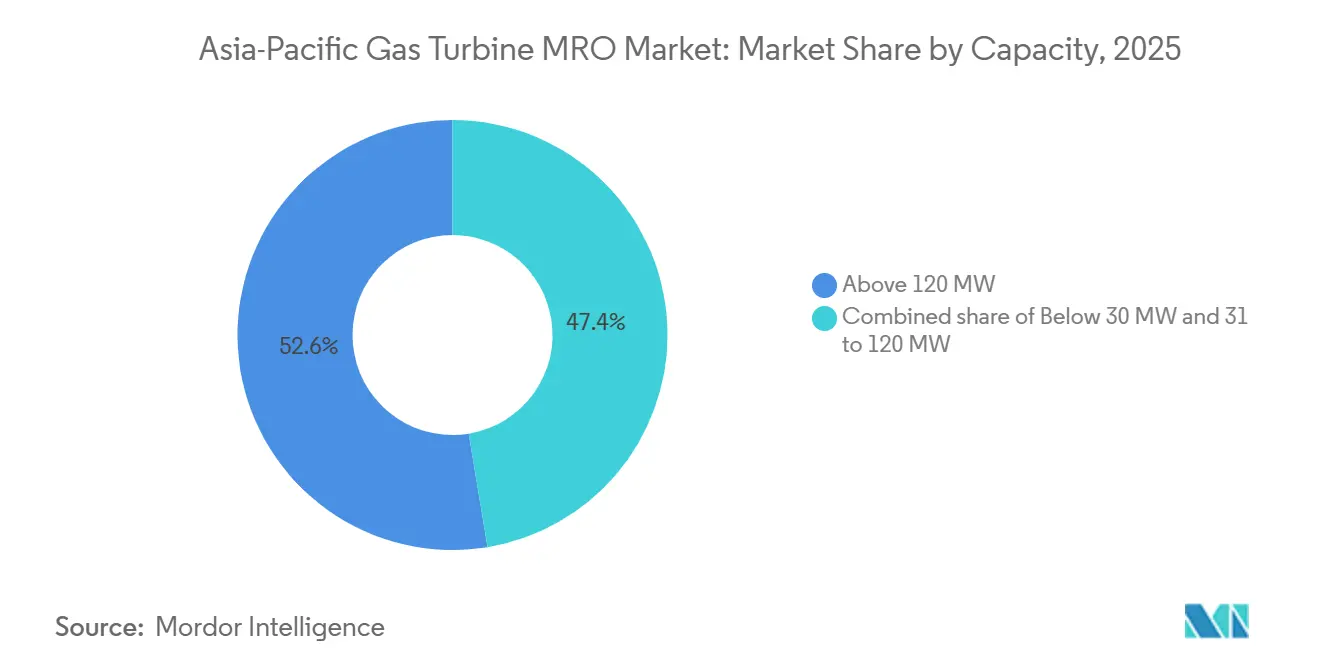
- By capacity, turbines above 120 MW held 52.6% of the Asia-Pacific gas turbine MRO market share in 2025; turbines in this band are expected to grow at a 5.6% CAGR through 2031.
- By turbine cycle, combined-cycle plants captured 69.3% of regional revenue in 2025 and are projected to grow at a 6.0% CAGR, the fastest among turbine-cycle segments.
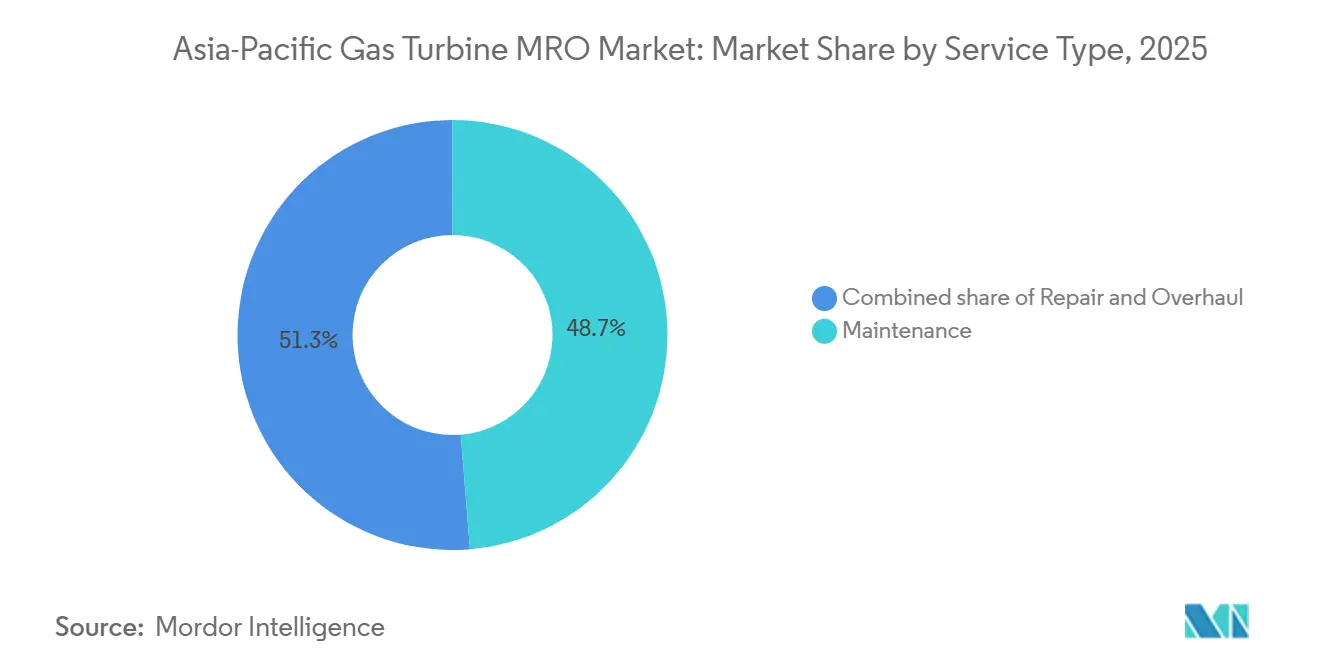
- By service type, maintenance services accounted for 48.7% of spend in 2025; overhaul services are expected to grow at 6.5% through 2031.
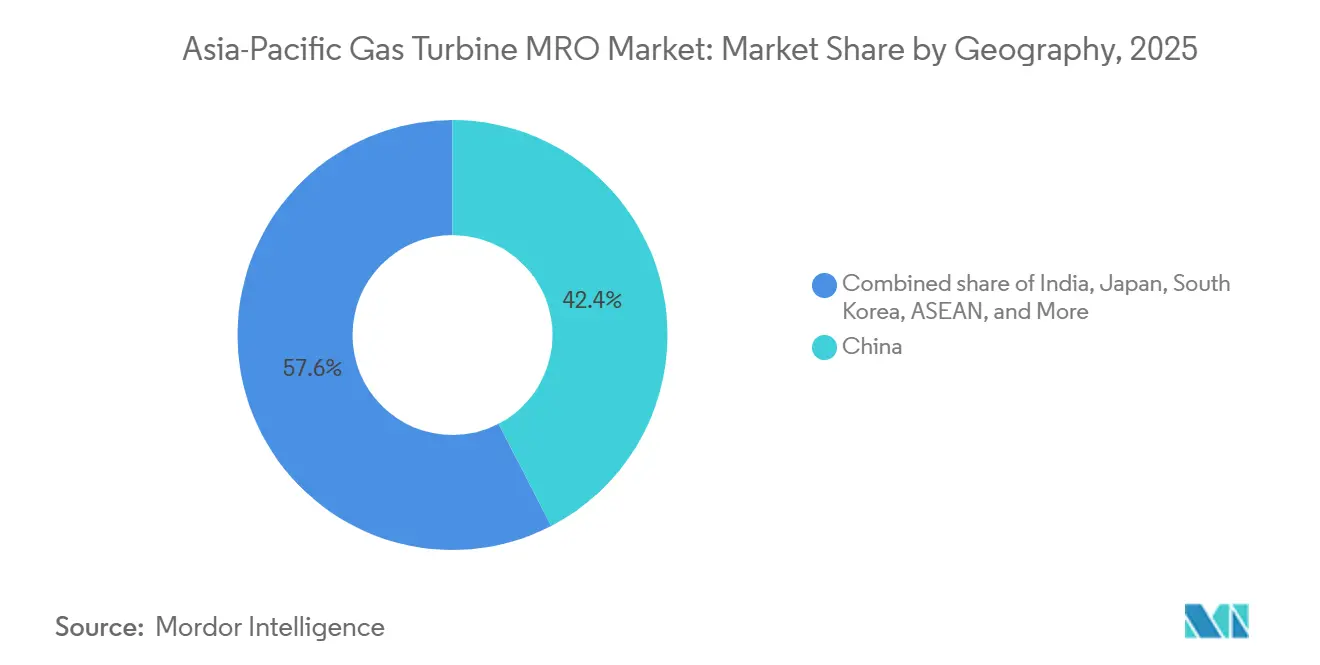
- By geography, China accounted for 42.4% of revenue in 2025 and is projected to grow at a CAGR of 5.4% through 2031.
Note: Market size and forecast figures in this report are generated using Mordor Intelligence’s proprietary estimation framework, updated with the latest available data and insights as of 2026.
Asia-Pacific Gas Turbine MRO Market Trends and Insights
Drivers Impact Analysis*
| Driver | (~) % Impact on CAGR Forecast | Geographic Relevance | Impact Timeline |
|---|---|---|---|
| Aging APAC turbine fleet approaching 100,000 EOH overhaul threshold | +1.2% | China, Japan, India, South Korea | Medium term (2-4 years) |
| Coal-to-gas shift in China & India drives new LTSA signings | +0.9% | China, Japan, India, South Korea | Long term (≥4 years) |
| OEM digital twins slash unplanned outages by >15% | +0.7% | Japan, Australia, global fleets | Short term (≤2 years) |
| Data-center peaker demand spikes aeroderivative shop visits | +0.5% | ASEAN, Australia, India | Short term (≤2 years) |
| Hydrogen-ready upgrade kits trigger mid-life inspections | +0.4% | Australia, Japan, South Korea | Medium term (2-4 years) |
| Source: Mordor Intelligence | |||


Aging APAC Turbine Fleet Approaching 100,000 EOH Overhaul Threshold
Roughly 60 GW of combined-cycle capacity installed between 2005 and 2015 is now breaching the metallurgical fatigue ceiling, prompting capital-intensive hot-gas-path work that costs USD 4 million–USD 6 million per unit.[3]Reuters, “Precision Castings Extends Lead Times,” reuters.com Malaysian, Indonesian, and Singaporean utilities report deferred maintenance converging with parts shortages, forcing hard choices between expedited logistics premiums and extended outages that risk grid penalties.
Coal-to-Gas Shift in China & India Drives New LTSA Signings
China’s 150 GW gas target and India’s 4.2 GW of 2025 additions are locking utilities into 15-year service pacts that hand performance risk to OEMs.[4]Turbomachinery International, “Malaysia TNB Extends Gas Turbine Overhaul Intervals,” turbomachinerymag.com Hybrid coal-gasification projects deepen service complexity, favoring providers that can bundle combustion tuning with emissions-system upkeep.
OEM Digital Twins Slash Unplanned Outages by >15 %
SmartSignal, GT Auto Tuner, and MHPS-TOMONI together shrink forced-outage hours, extend overhaul intervals by up to 3,000 hours, and generate USD 1.5 million in avoided maintenance costs per heavy-duty unit over five years. Subscription revenues offset cannibalized parts sales, creating a strategic pivot from hardware margins to software stickiness.
Data-Center Peaker Demand Spikes Aeroderivative Shop Visits
Hyperscale operators running LM6000 and Trent machines at triple the start-stop frequency of baseload plants are driving a 25% rise in regional aeroderivative repair capacity, with GE’s new Thai shop cutting turnaround to nine weeks. Capacity payments 40% above open-cycle norms justify the USD 3 million–USD 5 million overhaul bills.
Restraints Impact Analysis*
| Restraint | (~) % Impact on CAGR Forecast | Geographic Relevance | Impact Timeline |
|---|---|---|---|
| Renewable intermittency curtails baseload run-hours | −0.8% | China, India, Australia, Japan | Medium term (2-4 years) |
| Global hot-section casting shortage inflates spare-part lead times | −0.6% | Global, acute in ASEAN & India | Short term (≤2 years) |
| Skilled-technician gap widens in ASEAN | −0.3% | ASEAN, emerging India | Long term (≥4 years) |
| PMA parts disrupt OEM warranty economics | −0.4% | Global, post-warranty fleets | Medium term (2-4 years) |
| Source: Mordor Intelligence | |||
Renewable Intermittency Curtails Baseload Run-Hours
Solar and wind penetration above 35% in several Chinese provinces and declining capacity factors in India reduce annual operating hours by 30%, deferring scheduled overhauls and shrinking fixed-fee contract profitability.
Global Hot-Section Casting Shortage Inflates Spare-Part Lead Times
Nickel-alloy component backlogs stretch to 18 months, compelling operators to raise inventory buffers and handing independents an opening with faster remanufactured supply.
*Our forecasts treat driver/restraint impacts as directional, not additive. The impact forecasts reflect baseline growth, mix effects, and variable interactions.
Segment Analysis
By Capacity: Heavy-Duty Dominance Anchors Overhaul Spending
Turbines above 120 MW captured 52.6% of the Asia-Pacific gas turbine MRO market size in 2025 and will grow at a 5.6% CAGR, with each major overhaul yielding USD 4 million–USD 6 million in parts and labor. Siemens HL-class coatings now extend hot-section life by 15%, potentially flattening near-term demand but boosting long-run fleet value.
Mid-range 31-120 MW machines hold 32% share and track a 4.8% CAGR, reflecting industrial cogeneration resilience despite renewable displacement in Australia and South Korea. Sub-30 MW aeroderivatives remain 15% of spend yet migrate to Thai and Malaysian shops, compressing OEM margins but expanding independent footprints.


By Turbine Cycle: Combined-Cycle Economics Drive Service Intensity
Combined-cycle units commanded 69.3% of the Asia-Pacific gas turbine MRO market share in 2025 and are on a 6.0% CAGR, propelled by thermal efficiencies above 60% that justify integrated gas-plus-steam maintenance packages worth up to USD 12 million per outage. GE’s HA installations in Thailand demonstrate 64% net efficiency, raising needs for condenser and blade-path diagnostics beyond the gas turbine core.
Simple-cycle fleets retain a 31% foothold yet trail at 4.2% growth, with battery storage nibbling at their peaking role. Independent providers favor these open-cycle assets because of fewer proprietary barriers and price-sensitive owners.
By Service Type: Overhaul Surge Reflects Fleet Maturity
Routine maintenance produced 48.7% of 2025 revenue, but overhauls are expanding at 6.5%, the fastest rate, as 2005-2015 vintages cross the 100,000-hour mark, driving the Asia-Pacific gas turbine MRO market size upside. Overhaul bottlenecks at coating shops sparked Sulzer’s 40% capacity bump in Singapore, slicing turnaround to 11 weeks.
Repair services, roughly one-quarter of spend, rise 4.9% on unplanned blade or bearing failures. Doosan’s USD 25 million laser-cladding upgrade in Changwon widens regional repair options and chips away at European centers’ share.
By End-User Industry: Power Generation Anchors Demand, Oil-Gas Volatility Persists
Utilities took 62.9% of 2025 revenue and grew at 6.1% as grid-reliability penalties reward availability contracts that bundle parts, labor, and digital oversight. Oil-and-gas users remain one-quarter of spend but swing with LNG price cycles, evidenced by Woodside’s deferred Australian upgrades.
Industrial operators and data-center owners form a 14% slice yet deliver outsized aeroderivative overhaul volume; hyperscale peakers could lift their share to 7% by 2031 as facilities proliferate in Singapore, Sydney, and Mumbai.
Geography Analysis
China generated 42.4% of 2025 revenue and will expand at 5.4%, underpinned by low-cost domestic OEMs such as Shanghai Electric that promise 25% faster turnarounds and 48-hour emergency response. Third-party inspection mandates every 32,000 hours add USD 420 million in annual compliance spend, sustaining Asia-Pacific gas turbine MRO market demand.
Japan and South Korea together supply 23% of value, with Japan’s 62% average capacity factors yielding predictable major-inspection cadence and premium contract pricing. Hydrogen co-firing pilots in both countries compress intervals yet hike per-unit spend, raising Asia-Pacific gas turbine MRO market share for OEMs that offer combustor upgrades.
ASEAN, at 18% of revenue, splits between Thailand–Malaysia cost arbitrage plays and Vietnam–Indonesia OEM-locked fleets. India’s 15% share grows fastest as NTPC tenders move to open bidding, letting independents undercut incumbents by 22%–28%, while BHEL leverages 4,500 field staff to localize imported turbine service.
Competitive Landscape
Asia-Pacific gas turbine MRO market concentration is moderate: the top-five OEMs control about 58%, while independents own roughly one-fifth. OEMs pivot to digital twins and outcome-based contracts to create data lock-ins that offset parts-margin erosion; SmartSignal and GT Auto Tuner lower forced outages by up to 20% and stretch intervals by 3,000 hours, reshaping revenue pools.
Independents, led by Wood Group, EthosEnergy, and Ansaldo, exploit 18-month OEM part queues with eight-month remanufactured alternatives, winning 12% of Southeast Asian combustor-liner sales. Doosan’s 35% stake in a Vietnamese JV exemplifies localization plays that pressure Western OEM pricing, while Sulzer and MTU pour USD 15 million–USD 20 million each into additive manufacturing to certify 3D-printed blades, potentially cutting repair cycles by 30%.
Value is migrating from hardware to software; OEMs that integrate analytics with hardware upgrades secure lifetime customer data, whereas independents race to add digital overlays or risk relegation to price-taker status. Hydrogen retrofits, data-center peakers, and remanufactured parts remain white-space arenas where scale, certification, and capital investment decide winners.
Asia-Pacific Gas Turbine MRO Industry Leaders
GE Vernova (Gas & Aero Alliance)
Mitsubishi Heavy Industries (MHPS)
Siemens Energy
Rolls-Royce
John Wood Group
- *Disclaimer: Major Players sorted in no particular order

Recent Industry Developments
- March 2026: StandardAero signed a General Terms Agreement with AviLease to provide MRO services for LEAP-1A/1B and CFM56-7B engines. This agreement enhances aftermarket support capacity, indirectly benefiting Asia-Pacific operators through expanded global LEAP/CFM56 MRO capabilities and the region's growing fleets.
- December 2025: APSEZ acquired Australia’s NQXT export terminal, enhancing Asia-Pacific trade flows. While not turbine-specific, increased regional energy logistics activity supports long-term gas-power expansion, indirectly boosting gas-turbine deployment and associated MRO demand across Asia-Pacific energy corridors.
- September 2025: Mitsubishi Heavy Industries announced plans to double gas-turbine production to address rising regional demand driven by data-center growth and aging asset replacement. This expansion supports the Asia-Pacific MRO ecosystem by increasing installed bases, future overhaul workloads, and supply chain activities across the region.
- February 2025: Rolls-Royce launched fast-start MTU gas gensets capable of delivering full output in 45 seconds. The growing adoption of gas-based backup power for digital infrastructure in Asia-Pacific is expected to expand the service footprint, driving future MRO demand for high-response gas generator systems in the region.


Asia-Pacific Gas Turbine MRO Market Report Scope
The Gas Turbine MRO (Maintenance, Repair, and Overhaul) Market encompasses the global range of services, solutions, and providers dedicated to ensuring the operational reliability, performance optimization, and lifecycle extension of industrial and aero-derivative gas turbines. This market includes all activities necessary to maintain the safe and efficient operation of gas turbines across power generation, oil and gas, aviation, and industrial sectors.
The Asia-Pacific gas turbine MRO market is segmented into capacity, turbine cycle, service type, end-user industry, and geography. By capacity, the market is segmented into below 30 MW, 31 to 120 MW, and above 120 MW. By turbine cycle, the market is segmented into Combined Cycle and Open/Simple Cycle. By service type, the market is segmented into Maintenance, Repair, and Overhaul. By end-user industry, the market is segmented into Power Generation, Oil and Gas (Up-/Mid-/Down-stream), and Industrial and Other. By geography, the market is divided into China, Japan, India, South Korea, ASEAN Countries, Australia and New Zealand, and the Rest of Asia-Pacific. For each segment, market sizing and forecasts have been done based on revenue (USD billion).
By Capacity
| Below 30 MW |
| 31 to 120 MW |
| Above 120 MW |
By Turbine Cycle
| Combined Cycle |
| Open/Simple Cycle |
By Service Type
| Maintenance |
| Repair |
| Overhaul |
By End-user Industry
| Power Generation |
| Oil and Gas (Up-/Mid-/Down-stream) |
| Industrial and Other |
By Geography
| China |
| Japan |
| India |
| South Korea |
| ASEAN Countries |
| Australia and New Zealand |
| Rest of Asia-Pacific |
| By Capacity | Below 30 MW |
| 31 to 120 MW | |
| Above 120 MW | |
| By Turbine Cycle | Combined Cycle |
| Open/Simple Cycle | |
| By Service Type | Maintenance |
| Repair | |
| Overhaul | |
| By End-user Industry | Power Generation |
| Oil and Gas (Up-/Mid-/Down-stream) | |
| Industrial and Other | |
| By Geography | China |
| Japan | |
| India | |
| South Korea | |
| ASEAN Countries | |
| Australia and New Zealand | |
| Rest of Asia-Pacific |


Key Questions Answered in the Report
How large will Asia-Pacific gas turbine MRO spending be by 2031?
The market is forecast to reach USD 11.82 billion by 2031, rising at a 5.2% CAGR from 2026 to 2031.
Which segment grows fastest in regional MRO?
Overhaul services lead, expanding at 6.5% as 2005-2015 vintages hit the 100,000-hour overhaul trigger.
Why are digital twins critical for turbine owners?
Platforms like SmartSignal and GT Auto Tuner cut forced outages by up to 18% and extend hot-gas-path intervals by as much as 3,000 hours, lowering lifecycle costs.
How is hydrogen adoption affecting MRO demand?
Hydrogen-ready retrofits shorten inspection intervals and lift annual spend per unit by about USD 1.2 million, creating new service revenue streams.
What role do independent service providers play in China?
While OEMs still dominate, independents gain ground through faster remanufactured parts delivery and cost advantages of 20%-35% on post-warranty fleets.
Page last updated on:


