Asia-Pacific Fixed Broadband Market Size and Share
Market Overview
| Study Period | 2019 - 2030 |
|---|---|
| Forecast Data Period | 2025 - 2030 |
| Historical Data Period | 2019 - 2023 |
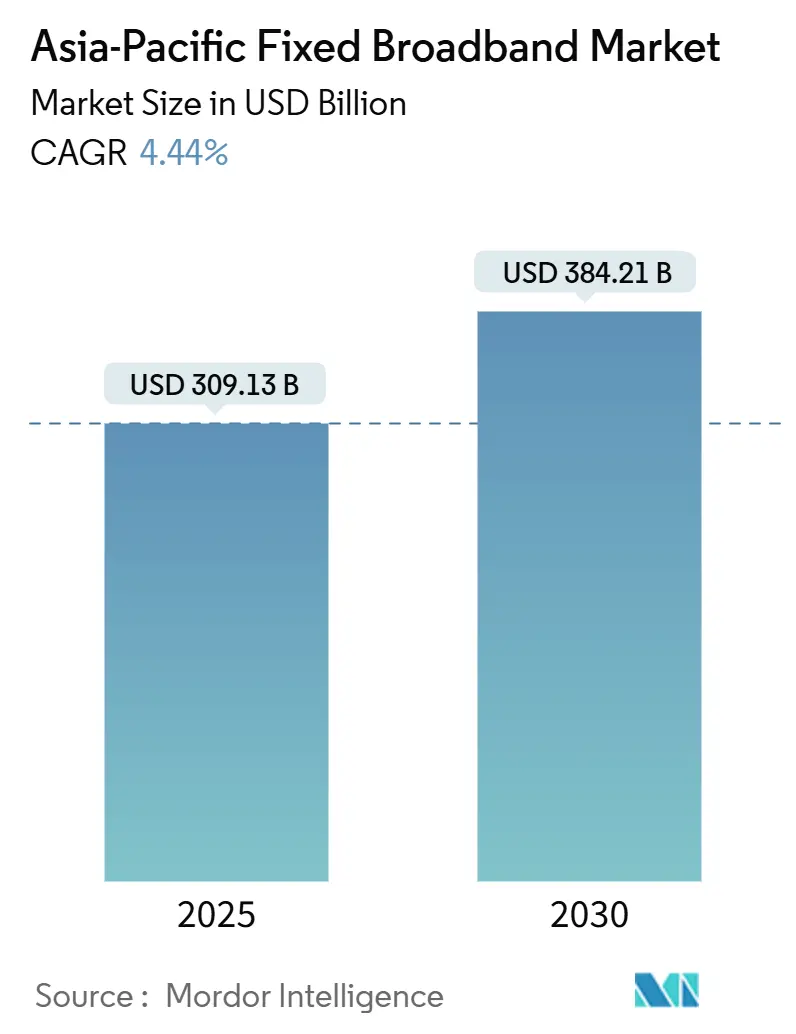
| Market Size (2025) | USD 309.13 Billion |
| Market Size (2030) | USD 384.21 Billion |
| Growth Rate (2025 - 2030) | 4.44% CAGR |
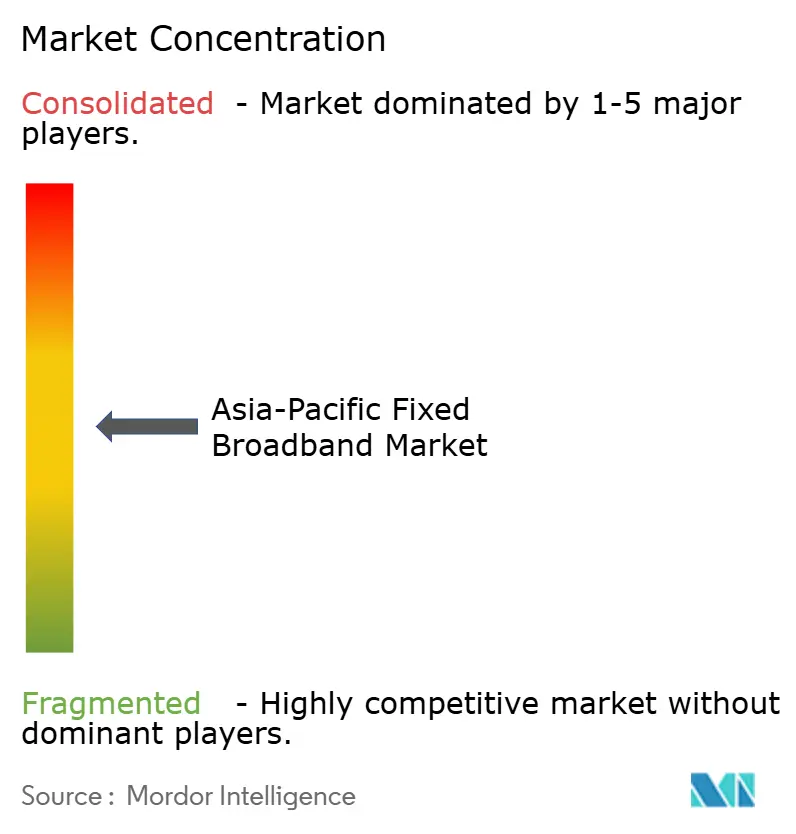
| Market Concentration | Medium |
Major Players *Disclaimer: Major Players sorted in no particular order Image © Mordor Intelligence. Reuse requires attribution under CC BY 4.0. | |
Asia-Pacific Fixed Broadband Market Analysis by Mordor Intelligence
The Asia-Pacific Fixed Broadband Market size is estimated at USD 309.13 billion in 2025, and is expected to reach USD 384.21 billion by 2030, at a CAGR of 4.44% during the forecast period (2025-2030). The growth outlook reflects fiber-first public-policy agendas, accelerating digitalization in households and enterprises, and intensifying service upgrades toward multi-gigabit tiers. China’s position as the largest revenue contributor anchors current scale, yet double-digit growth in emerging economies signals ample headroom for penetration uplift. The operator's focus on premium speed tiers, bundled content, and differentiated enterprise solutions is translating bandwidth demand into improved average revenue per user (ARPU), despite price competition pressures in value segments. Government subsidies, neutral-host infrastructure ventures, and 5G fixed wireless access rollouts are further widening the addressable base across difficult geographies while reshaping competitive dynamics.
Key Report Takeaways
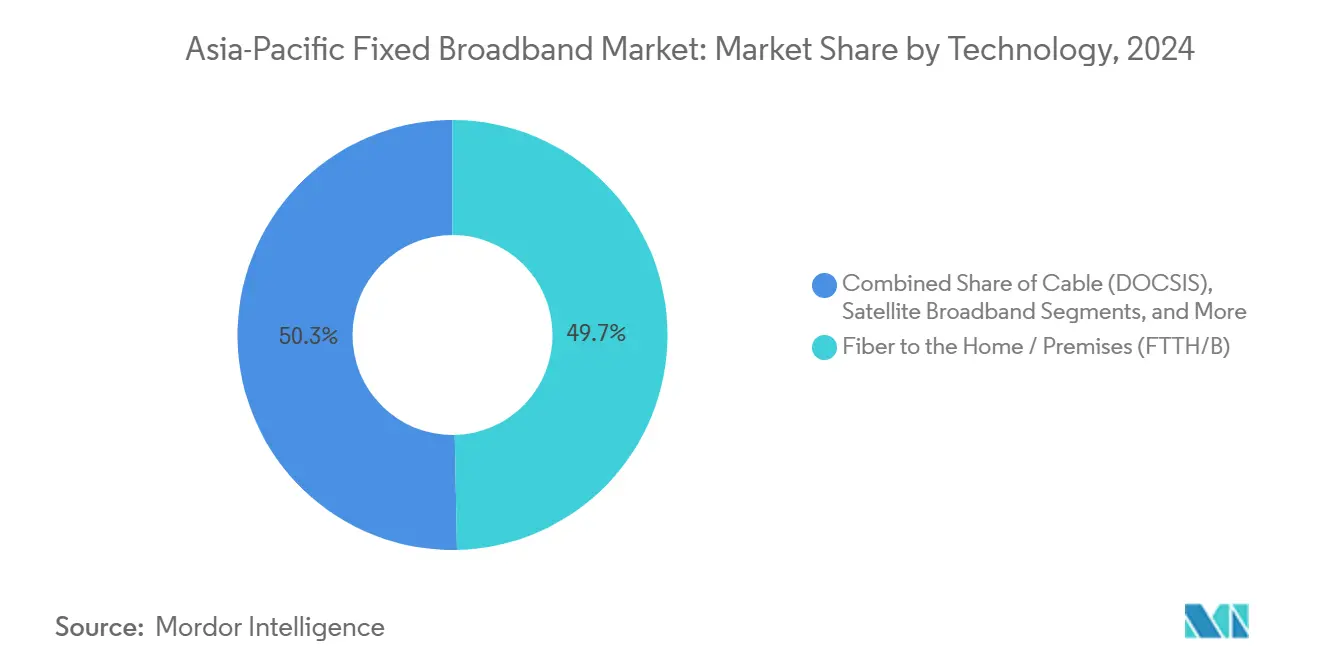
- By technology, fiber-to-the-home/premises led the Asia Pacific fixed broadband market with a 49.66% revenue share in 2024, and it is projected to grow at a 6.24% CAGR through 2030.
- By speed tier, the 100 Mbps-1 Gbps tier accounted for 56.23% of the Asia Pacific fixed broadband market in 2024, while the segment above 1 Gbps is forecast to advance at a 16.11% CAGR to 2030.
- By end-user, the residential segment is expected to account for 87.50% of the Asia Pacific fixed broadband market in 2024, while the commercial segment is anticipated to expand at a 6.41% CAGR through 2030.
- By application, video streaming and entertainment captured a 69.36% revenue share of the Asia Pacific fixed broadband market in 2024, whereas online gaming and immersive media applications are projected to post an 11.88% CAGR through 2030.
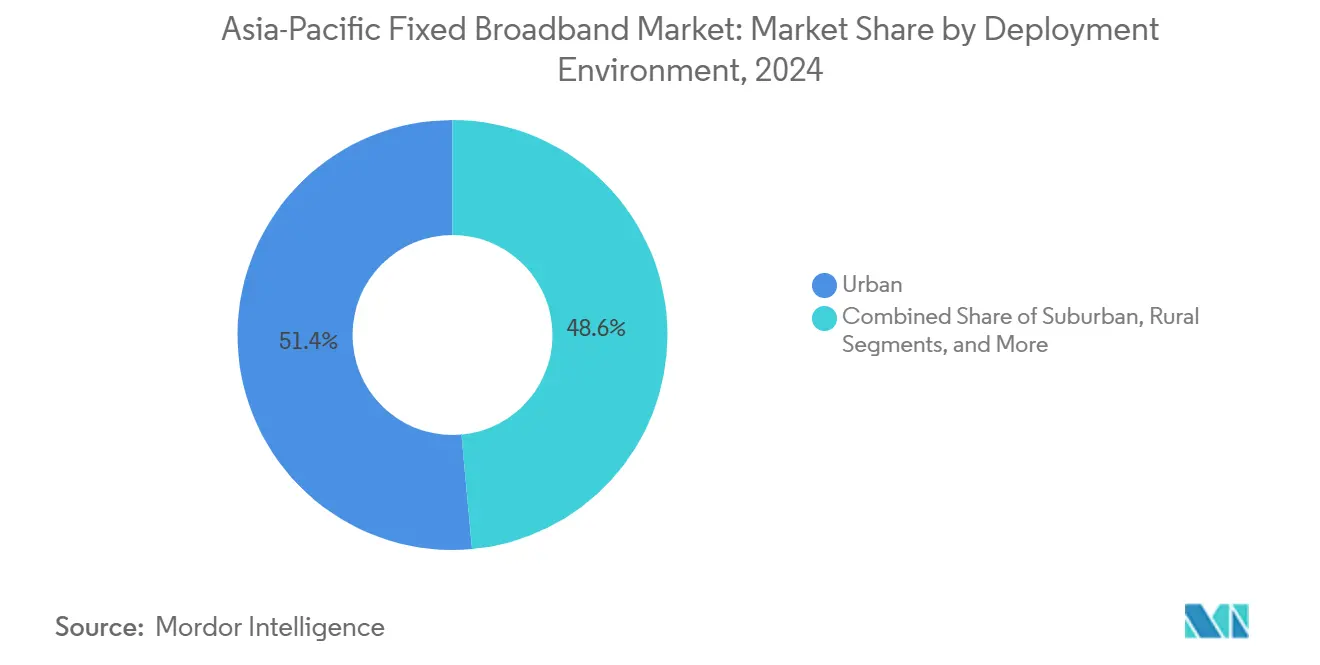
- By deployment environment, urban deployments accounted for a 51.44% share of the Asia Pacific fixed broadband market in 2024, and are forecasted to drive the segment at a 5.93% CAGR to 2030.
- By ownership, incumbent telcos held 46.93% revenue share of the Asia Pacific fixed broadband market in 2024, yet fixed wireless ISPs driven by 5G FWA are poised for a 6.64% CAGR to 2030.
- By country, China captured a 51.08% revenue share of the Asia Pacific fixed broadband market in 2024, whereas India is projected to post an 8.27% CAGR through 2030.
Note: Market size and forecast figures in this report are generated using Mordor Intelligence’s proprietary estimation framework, updated with the latest available data and insights as of January 2026.
Future direction is shaped by developments occurring across multiple regions, with Asia contributing to the overall trajectory. The outlook on worldwide fixed broadband market reflects how these are expected to evolve collectively.
Asia-Pacific Fixed Broadband Market Trends and Insights
Drivers Impact Analysis*
| Driver | (~) % Impact on CAGR Forecast | Geographic Relevance | Impact Timeline |
|---|---|---|---|
| Government-backed Fiber Broadband Initiatives and Universal Service Funds Across APAC | +1.2% | Global APAC, strongest in Malaysia, Singapore, Philippines | Medium term (2-4 years) |
| Surge in OTT Video Streaming and Cloud Gaming Driving High-bandwidth Demand | +0.8% | Global APAC, concentrated in urban China, Japan, South Korea | Short term (≤ 2 years) |
| Rapid 5G Fixed Wireless Access Rollouts Filling Last-mile Gaps in Dense Urban Zones | +0.6% | India, Thailand, Indonesia, urban APAC markets | Short term (≤ 2 years) |
| Declining Cost per FTTH Connection Due to Mature PON Tech and Bulk Fiber Procurement | +0.4% | China, India, Southeast Asia emerging markets | Long term (≥ 4 years) |
| Emergence of Open-access Neutral Fiber Infrastructure Models Unlocking Private Capital | +0.3% | Australia, New Zealand, Philippines, selective APAC markets | Long term (≥ 4 years) |
| Expansion of Tier-2 Subsea Cable Landing Stations Enabling Traffic Localization and Lower Latency | +0.2% | Southeast Asia, Pacific Island nations, coastal APAC | Medium term (2-4 years) |
| Source: Mordor Intelligence | |||
Government-Backed Fiber Broadband Initiatives Drive Infrastructure Transformation
Public spending continues to accelerate fiber build-outs across the Asia Pacific fixed broadband market, as authorities view ubiquitous high-speed connectivity as essential infrastructure for the digital economy. Malaysia’s MYR 21.6 billion National Fiberization and Connectivity Plan, the Philippines’ USD 287 million World Bank-financed rural broadband program, [1]World Bank Group, “Philippines Digital Infrastructure Project,” World Bank, worldbank.organd Singapore’s SGD 100 million push toward nationwide 10 Gbps links illustrate the scale of fiscal commitment. [2]Infocomm Media Development Authority, “Singapore’s Digital Infrastructure Development,” IMDA, imda.gov.sg Projects in archipelagic nations often blend fiber backbones with microwave or satellite middle-mile solutions, creating commercially viable footprints for private operators. Large-scale procurement reduces equipment costs, while mandated wholesale access ensures competitive service layers. Vietnam’s target of 100% fiber coverage by 2025 exemplifies how broadband policy is now closely aligned with national socioeconomic plans, providing investors with long-term demand visibility.
OTT Video Streaming and Cloud Gaming Intensify Bandwidth Competition
Content platforms are outpacing historical traffic forecasts as 4K streaming and latency-sensitive cloud gaming extend peak-time bandwidth curves. Netflix’s entry into mobile gaming bundles and Disney+ localization strategies accelerate heavy-bitrate consumption, forcing operators to prioritize network upgrades. [3]Netflix Inc., “Content and Gaming Strategy Update,” Netflix, about.netflix.comSouth Korea and Japan have already monetized low-latency premium tiers, and similar ARPU-uplift models are emerging in Southeast Asia, where console-quality cloud gaming reaches smartphone users over home Wi-Fi backhaul. These developments incentivize fiber investment due to the technology’s symmetric speeds and low-jitter profile, differentiating operators from legacy copper and coax rivals. Traffic localization initiatives, including regional caching nodes, further enhance streaming quality and encourage higher-tier subscriptions.
5G Fixed Wireless Access Disrupts Traditional Fiber Economics
5G FWA unlocks rapid time-to-market broadband in dense urban clusters and underserved peri-urban zones, challenging the assumption that fiber is the only future-proof medium. In India, Reliance Jio and Bharti Airtel aim to connect 5-10 million FWA subscribers by 2025, targeting tier-2 cities with starter packages that undercut entry-level fiber services. Early user-plane aggregation results indicate sub-10 millisecond latency in line-of-sight scenarios, thereby narrowing the performance gap versus gigabit-capable PON. Australia’s NBN Co is now integrating FWA into its multi-technology mix, using 5G to bridge remote gaps where fiber trenching costs are prohibitive. This modality also lowers market-entry barriers for greenfield ISPs, intensifying competitive churn.
Declining FTTH Deployment Costs Accelerate Market Penetration
According to China Telecom, the factory-scale production of optical fiber, particularly in China, and the maturation of 10G PON chipsets have driven down per-home-passed costs by 15-20% annually since 2024. Bulk purchases under national programs secure further discounts, while innovations such as micro-duct installation reduce civil works spending. Open-access business models let multiple virtual operators share a single passive network, amortizing capex across larger subscriber pools. These economics enable fiber projects in suburbs and smaller towns that were previously reliant on copper or wireless, enlarging the Asia Pacific fixed broadband market size and improving investment payback periods.
Restraints Impact Analysis*
| Restraint | (~) % Impact on CAGR Forecast | Geographic Relevance | Impact Timeline |
|---|---|---|---|
| High Deployment Costs and ROI Challenges in Rural/Remote and Archipelagic Regions | -0.7% | Indonesia, Philippines, rural Australia, Pacific Islands | Long term (≥ 4 years) |
| Intensifying Price Wars Lowering Broadband ARPU and Margins | -0.5% | India, China tier-2 cities, competitive APAC markets | Short term (≤ 2 years) |
| Municipal Right-of-way Approval Bottlenecks Causing Project Delays and Cost Overruns | -0.4% | Urban China, India, Southeast Asia metropolitan areas | Medium term (2-4 years) |
| Supply-chain Concentration Risk in Optical Fiber Preforms Driving Price Volatility | -0.3% | Global APAC, highest impact on smaller operators | Short term (≤ 2 years) |
| Source: Mordor Intelligence | |||
High Deployment Costs Challenge Rural Connectivity Economics
Archipelagic territories and mountainous interiors complicate trenching and backhaul design, often lifting per-premise costs to three to five times urban benchmarks. Indonesia’s 17,000-plus islands and the Philippines’ dispersed provinces rely on maritime fiber links and satellite uplift, inflating project budgets despite universal-service subsidies. Australia’s experience shows that capex overruns in sparsely populated areas can necessitate technology swaps toward satellite or FWA to maintain fiscal discipline. Low household incomes and modest ARPU potential lengthen payback horizons, discouraging private investment without guaranteed cost-recovery mechanisms.
Intensifying Price Competition Pressures Operator Margins
Aggressive discounting in India, where Jio Fiber and Airtel Xstream cut tariffs by 20-25% since 2024, illustrates how scale players trigger price cascades to lock in market share. Comparable skirmishes in China’s tier-2 cities force regional ISPs to chase volume at the expense of profitability, constraining upgrade capex. While bundle strategies and premium speed tiers partially offset declines, margin compression remains a structural restraint on the Asia Pacific fixed broadband market.
*Our forecasts treat driver/restraint impacts as directional, not additive. The impact forecasts reflect baseline growth, mix effects, and variable interactions.
Segment Analysis
By Technology: Fiber Dominance Accelerates Despite Multi-Modal Competition
Fiber to the home/premises (FTTH/B) commands 49.66% of revenue and drives a 6.24% CAGR, cementing its role as the performance benchmark in the Asia Pacific fixed broadband market size in 2024. Cable DOCSIS networks are migrating toward 4.0 upgrades, yet they face symmetric-speed limitations compared to PON. DSL and copper declines steepen as operators fast-track overbuilds. Meanwhile, 5G FWA is gaining traction by leveraging existing macro sites, thereby introducing service parity in markets where street-level fiber faces cost impediments. Satellite constellations add resiliency for remote zones, but latency sensitivities keep them complementary rather than substitutes in urban contexts.
Investment momentum favors fiber because its lifespan aligns with policy targets for 10 Gbps national grids. Government grants, vendor financing, and utility pole sharing agreements can shorten deployment timelines. However, technology heterogeneity persists, as operators in rugged Pacific Island terrain mesh microwave relays with subsea segments, while metropolitan players chase densification to support smart-city backhaul. Competitive neutrality laws in Australia and New Zealand encourage wholesale fiber builders that lease capacity to retail ISPs, enlarging commercial options for late-entrant brands.


By Speed Tier: Multi-Gigabit Adoption Signals Premium Service Evolution
The mainstream 100 Mbps-1 Gbps tier represented 56.23% of connections in 2024, yet multi-gigabit plans above 1 Gbps are projected to post a 16.11% CAGR, illustrating ARPU-uplift strategies across premium urban clusters. Early adoption is visible in Japan and South Korea, where households bundle 2 Gbps lines with cloud gaming subscriptions. Operators utilize high-tier packages to manage network load through tiered usage profiles, thereby maintaining headroom during peak streaming periods.
Up to 25 Mbps packages target price-sensitive rural users but will contract as migration incentives, including device subsidies, pull customers toward mid-tier offerings. From a capacity-planning perspective, the adoption of multi-gigabit services encourages fiber micro-segmentation and the wider use of XGS-PON. Enterprise packages mirror this trajectory, offering symmetric multi-gigabit pipes for small businesses adopting software-as-a-service solutions.
By End User: Commercial Segment Growth Outpaces Residential Maturation
Residential retains 87.50% dominance, underscoring fixed broadband’s consumer orientation, but commercial lines will grow faster at 6.41% as enterprises digitize supply chains. SMEs migrating workloads to the public cloud demand static IP addresses, service-level agreements, and symmetric throughput. Operators package managed Wi-Fi, security, and collaboration suites to lift effective ARPU. Campus networks in manufacturing clusters also require deterministic latency for robotics and quality-control video feeds, steering demand toward dedicated fiber loops. The commercial opportunity appeals to ISPs seeking diversification away from price-sensitive households.
Despite a lower volume, commercial churn is lower, and contract tenures are longer, which improves lifetime value metrics. Financial services and e-commerce hubs in Singapore, Tokyo, and Sydney favor multi-path connectivity, driving adoption of dual-carrier fiber. Government digital-economy grants encourage micro-enterprises to formalize business subscriptions, expanding the total addressable commercial base.
By Application: Gaming and Immersive Media Drive Next-Generation Demand
Video streaming accounts for 69.36% of traffic, but online gaming, virtual reality, and mixed-reality workloads are driving application-side growth at an 11.88% CAGR as studios launch cloud-native titles. Low-latency demands push ISPs to deploy edge nodes and prioritize quality-of-experience metrics. Remote work applications remain entrenched, sustaining higher daytime traffic and flattening daily demand curves. The proliferation of smart-home devices adds constant background traffic, requiring network slicing and device-level quality-of-service management.
Telehealth consults and distance education rely on symmetric uplinks, favoring fiber. Industrial IoT use cases, such as predictive maintenance in factories, expand application diversity for commercial circuits. These emerging segments incentivize operators to differentiate on latency and jitter rather than raw downstream throughput alone.
By Deployment Environment: Urban Concentration Masks Rural Opportunity Gaps
Urban clusters accounted for 51.44% of the Asia Pacific fixed broadband market size in 2024, with a 5.93% growth rate, reflecting dense housing and higher disposable incomes. Suburbs offer contiguous expansion zones benefiting from existing metro rings. Rural and remote regions remain underserved but feature untapped demand pools once affordability thresholds are met. Government subsidy auctions in Indonesia and Thailand prioritize fiber backbones that branch into microwave or satellite last-mile connections, balancing economic considerations and coverage.
Urban markets are increasingly competing on premium tiers, bundled content, and value-added home services, such as security monitoring. In contrast, rural rollouts focus on fulfilling baseline coverage obligations, with operators optimizing their cost structures through FWA and community Wi-Fi hubs. Open-access fiber corridors funded by multilateral agencies unlock third-party retail competition, thereby avoiding stranded-asset risks for early adopters.
By Ownership: Fixed Wireless ISPs Challenge Incumbent Advantages
Incumbent telcos hold a 46.93% share, leveraging their legacy copper and fiber plants, as well as quad-play bundles. Nevertheless, wireless ISPs using 5G achieve a forecast 6.64% CAGR, eroding incumbent defensibility in greenfield housing developments. Fiber overbuilders gain traction in markets where regulator-mandated duct access reduces barriers to entry. Cable MSOs upgrade to DOCSIS 4.0 to preserve relevance, while satellite operators exploit new LEO constellations to reach remote customer pockets.
Infrastructure-sharing consortia, such as Australia’s neutral-host pit and pipe systems, de-risk capex for smaller brands, widening consumer choice. Cross-border investors favor open-access wholesale models that separate network ownership from service provisioning, aligning with policy goals of maximizing utilization while sustaining price competition.
Geography Analysis
China supplied 51.08% of regional revenue in 2024, underpinned by massive state-directed fiber investment and one of the world’s largest subscriber bases. Its market now focuses on speed upgrades and enterprise verticals, with three state-owned carriers collectively allocating over USD 50 billion annually on network expansion and 5G convergence. India stands out as the fastest-growing market at an 8.27% CAGR through 2030, driven by affordable tariffs, expanding middle-class broadband adoption, and aggressive 5G FWA rollouts.
Japan and South Korea exhibit saturation yet maintain leadership in innovation through 10 Gbps services, edge-compute integration, and content partnerships. Operators leverage premium propositions to anchor customer retention in highly penetrated markets. Australia and New Zealand rely on government-led open-access networks that address geographic sparsity; ongoing fiber-to-the-premises upgrades reaffirm their commitment to universal service.
Singapore has near-universal gigabit coverage, while the Philippines accelerates rural builds through World Bank financing. Pacific Island economies rely heavily on international development funding and subsea cable consortia, underscoring the strategic importance of regional collaboration. Across the board, universal service funds, fiscal incentives, and infrastructure-sharing mandates remain critical in bridging the connectivity divide.
Analysis of the fixed broadband market by Mordor Intelligence spans multiple other regional evaluations across Middle East, South America, and Africa.
Competitive Landscape
The Asia Pacific fixed broadband market features moderate concentration, with market power distributed unevenly across subregions. State-backed giants in China and Vietnam contrast sharply with fragmented environments in Malaysia and Indonesia. Scale incumbents focus on differentiating themselves via network quality, integrated mobile and fixed bundles, and enterprise vertical expertise. New entrants harness 5G FWA, open-access fiber, or LEO satellites to carve out niches without incurring trenching costs.
Strategic priorities emphasize premium speed expansion, smart home ecosystem partnerships, and enterprise-managed services. For example, Singtel positions its regional subsidiaries to cross-sell edge-compute and cybersecurity services over converged connectivity pipes. Operator alliances with content platforms create exclusive bundles, raising switching costs. Vendor consolidation and bulk-buy contracts help counter price erosion by lowering unit capex. Regulatory oversight ensures wholesale access in key markets, sustaining multi-operator competition despite infrastructural economies of scale.
Capital expenditure intensity remains high, but financing profiles are diversifying through infrastructure fund spin-offs, real estate-style REIT structures, and green bonds targeting energy-efficient network upgrades. Supply-chain risks in fiber preforms and semiconductor optics spur procurement hedging strategies, encouraging collaboration among regional operators to secure volume discounts.
Asia-Pacific Fixed Broadband Industry Leaders
Reliance Jio Infocomm Ltd. (JioFiber)
Bharti Airtel Ltd. (Airtel Xstream Fiber)
Bharat Sanchar Nigam Ltd. (BSNL)
KT Corporation
China Telecom Corporation Limited
- *Disclaimer: Major Players sorted in no particular order

Recent Industry Developments
- October 2025: Bharat Sanchar Nigam Limited appointed Blue Cloud Softech Solutions as system integrator for 5G FWA in Andhra Pradesh and for nationwide 5G Internet Leased Line services.
- August 2025: NTT Corporation and NEC Corporation demonstrated 140 Gbps real-time bidirectional millimeter-wave transmission between 71 GHz and 86 GHz, showcasing OAM multiplexing for extended reach.


Asia-Pacific Fixed Broadband Market Report Scope
| Fiber to the Home / Premises (FTTH/B) |
| Cable (DOCSIS) |
| Digital Subscriber Line (DSL) and Copper |
| Fixed Wireless Access (5G/LTE) |
| Satellite Broadband |
| Up to 25 Mbps |
| 100 Mbps – 1 Gbps |
| Above 1 Gbps (Multi-Gig) |
| Residential |
| Commercial |
| Video Streaming and Entertainment |
| Online Gaming and Immersive Media |
| Remote Work and Cloud Collaboration |
| Smart Home and IoT Connectivity |
| Telehealth and Distance Learning |
| Industrial and Enterprise Automation |
| Urban |
| Suburban |
| Rural |
| Remote and Hard-to-Reach |
| Incumbent Telcos |
| Competitive Fiber Overbuilders |
| Cable Multiple System Operators (MSOs) |
| Fixed Wireless ISPs |
| Satellite Network Operators |
| China |
| Japan |
| India |
| South Korea |
| Australia and New Zealand |
| Rest of Asia Pacific |
| By Technology | Fiber to the Home / Premises (FTTH/B) |
| Cable (DOCSIS) | |
| Digital Subscriber Line (DSL) and Copper | |
| Fixed Wireless Access (5G/LTE) | |
| Satellite Broadband | |
| By Speed Tier | Up to 25 Mbps |
| 100 Mbps – 1 Gbps | |
| Above 1 Gbps (Multi-Gig) | |
| By End User | Residential |
| Commercial | |
| By Application | Video Streaming and Entertainment |
| Online Gaming and Immersive Media | |
| Remote Work and Cloud Collaboration | |
| Smart Home and IoT Connectivity | |
| Telehealth and Distance Learning | |
| Industrial and Enterprise Automation | |
| By Deployment Environment | Urban |
| Suburban | |
| Rural | |
| Remote and Hard-to-Reach | |
| By Ownership | Incumbent Telcos |
| Competitive Fiber Overbuilders | |
| Cable Multiple System Operators (MSOs) | |
| Fixed Wireless ISPs | |
| Satellite Network Operators | |
| By Country | China |
| Japan | |
| India | |
| South Korea | |
| Australia and New Zealand | |
| Rest of Asia Pacific |


Key Questions Answered in the Report
What is the projected value of the Asia Pacific fixed broadband market by 2030?
The market is forecast to reach USD 384.21 billion by 2030 based on a 4.44% CAGR.
Which technology segment leads revenue contribution across Asia Pacific?
Fiber to the Home/Premises currently contributes the highest revenue, holding 49.66% share in 2024 and growing at a 6.24% CAGR.
How fast is the multi-gigabit speed tier expected to grow?
Connections exceeding 1 Gbps are projected to register a 16.11% CAGR between 2025 and 2030 as operators promote premium packages.
Which country is forecast to be the fastest-growing broadband market in Asia Pacific?
India is expected to post the highest national growth rate at 8.27% CAGR through 2030 due to affordable tariffs and 5G FWA adoption.
How are 5G fixed wireless services affecting competitive dynamics?
5G FWA lowers entry barriers for new ISPs, enables rapid deployment in tier-2 cities, and is forecast to grow subscriber numbers significantly, eroding incumbent fiber market share.
What restrains broadband deployment in remote regions?
High civil-works costs, geographic dispersion, and lower ARPU potential extend investment payback periods, necessitating government subsidies and alternative technologies like satellite links.
Page last updated on:


