Array Instruments Market Size and Share
Market Overview
| Study Period | 2020 - 2031 |
|---|---|
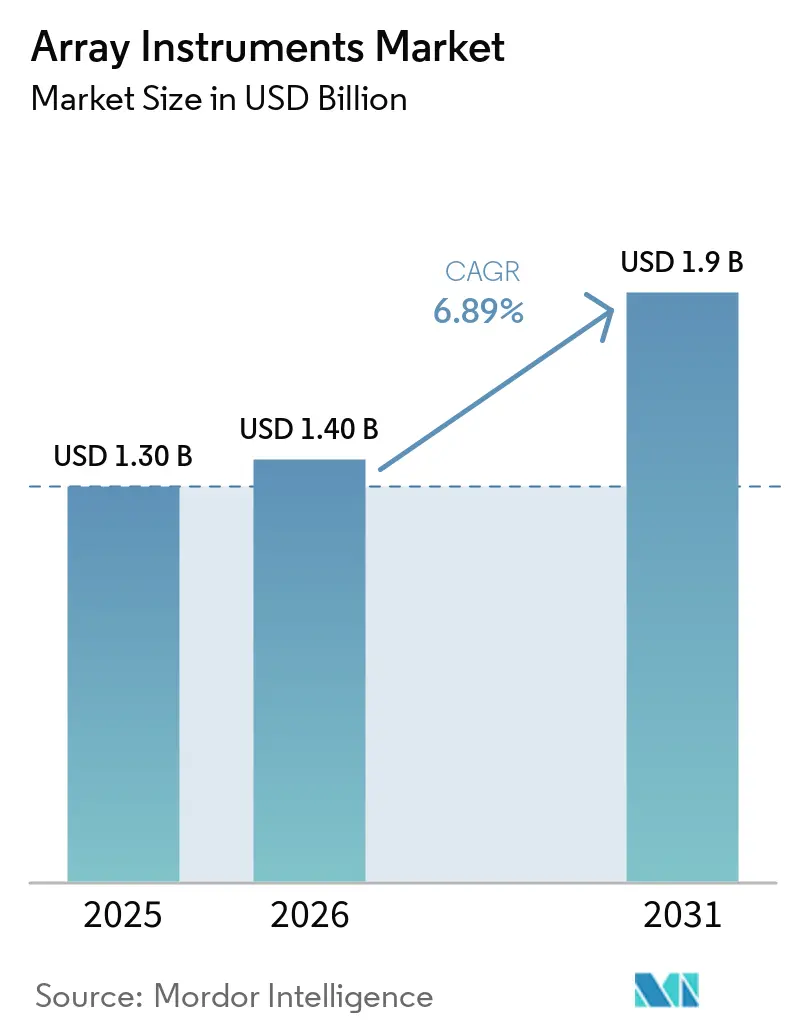
| Market Size (2026) | USD 1.40 Billion |
| Market Size (2031) | USD 1.9 Billion |
| Growth Rate (2026 - 2031) | 6.89% CAGR |
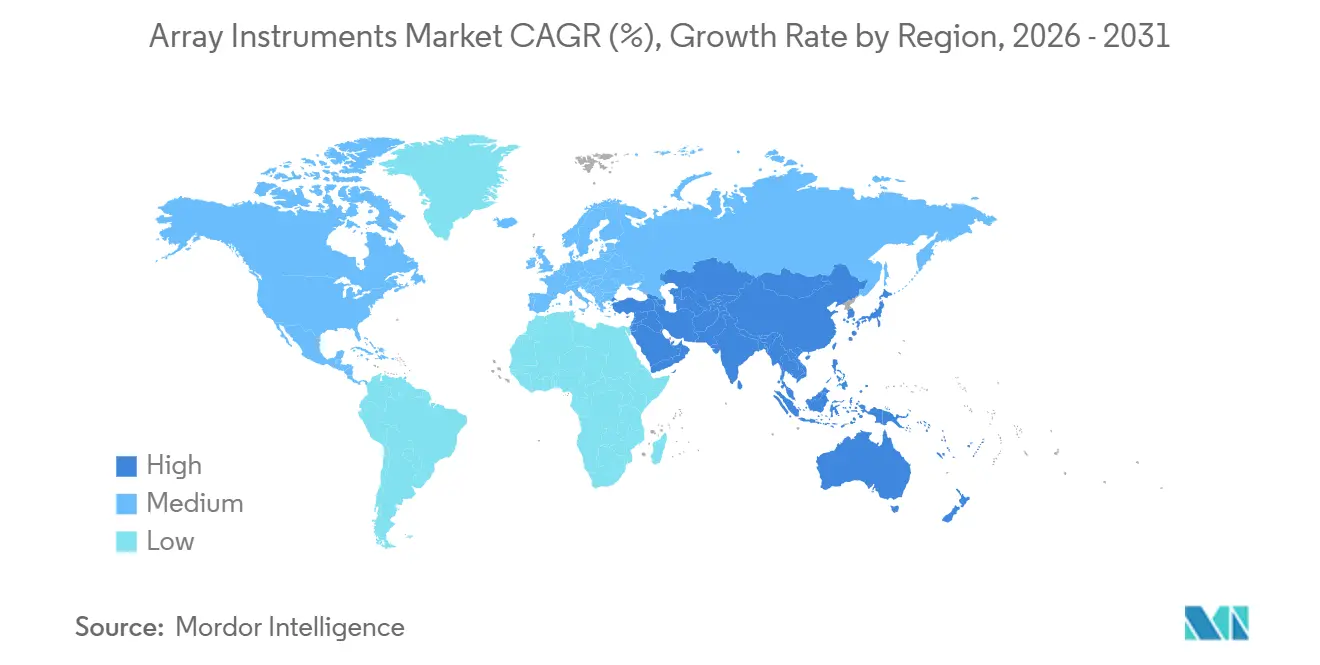
| Fastest Growing Market | Asia Pacific |
| Largest Market | North America |
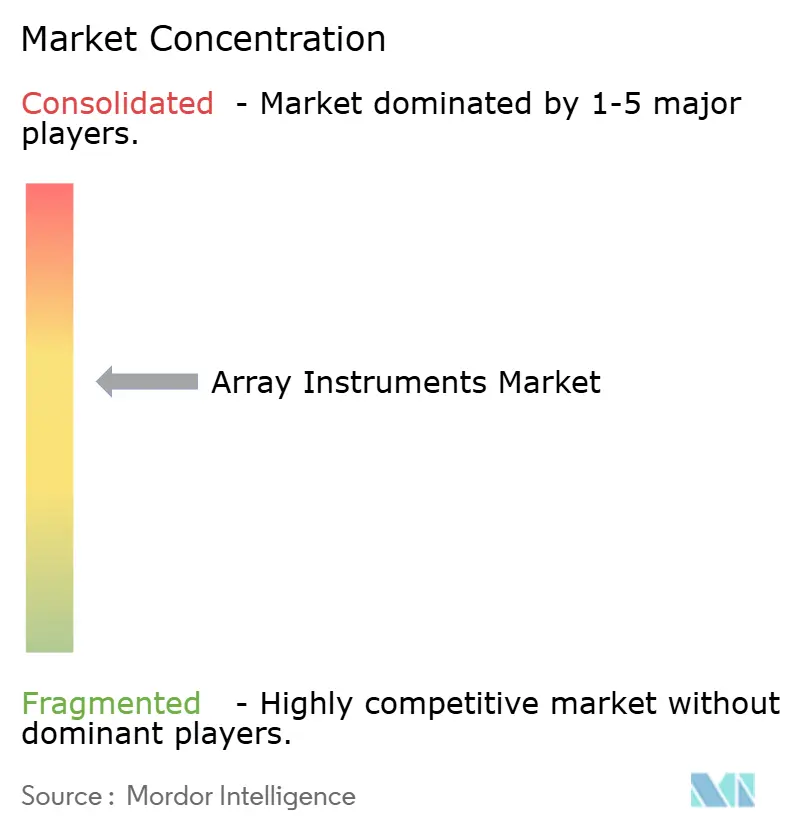
| Market Concentration | Medium |
Major Players *Disclaimer: Major Players sorted in no particular order Image © Mordor Intelligence. Reuse requires attribution under CC BY 4.0. | |
Array Instruments Market Analysis by Mordor Intelligence
The Array Instruments Market size was valued at USD 1.30 billion in 2025 and is estimated to grow from USD 1.40 billion in 2026 to reach USD 1.9 billion by 2031, at a CAGR of 6.89% during the forecast period (2026-2031).
Clinical uptake of chromosomal microarray (CMA) in pediatric genetics, persistent use of gene-expression arrays in translational research, and rapid expansion of multiplex protein arrays for vaccine quality control are anchoring near-term demand. Investments in automation that streamline hybridization, washing, and imaging workflows are keeping capital spending resilient even as next-generation sequencing (NGS) claims a larger share of discovery budgets. Hardware vendors are countering pricing pressure by embedding artificial-intelligence (AI) analytics, expanding vertical integration in oligonucleotide probe manufacturing, and promoting camera-based imagers with lower lifetime service costs. Regionally, infrastructure build-outs in India and China, backed by local device approvals and venture funding, are accelerating installs, while new European Union in-vitro diagnostic rules are lengthening sales cycles for small and mid-sized kit developers.
Key Report Takeaways
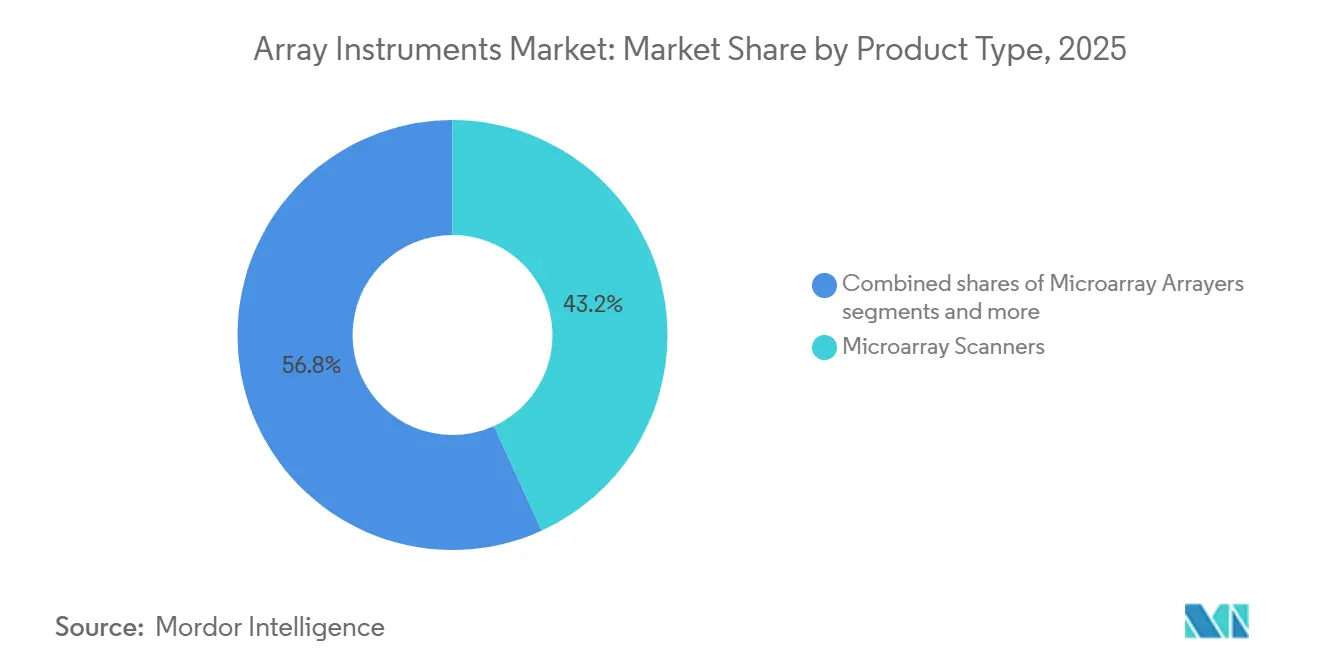
- By product type, microarray scanners led with 43.18% of the array instruments market share in 2025, yet hybridization and processing systems are projected to expand at a 7.31% CAGR through 2031.
- By application, gene-expression profiling accounted for 42.80% of the array instruments market in 2025, and protein microarray applications are advancing at a 7.56% CAGR to 2031.
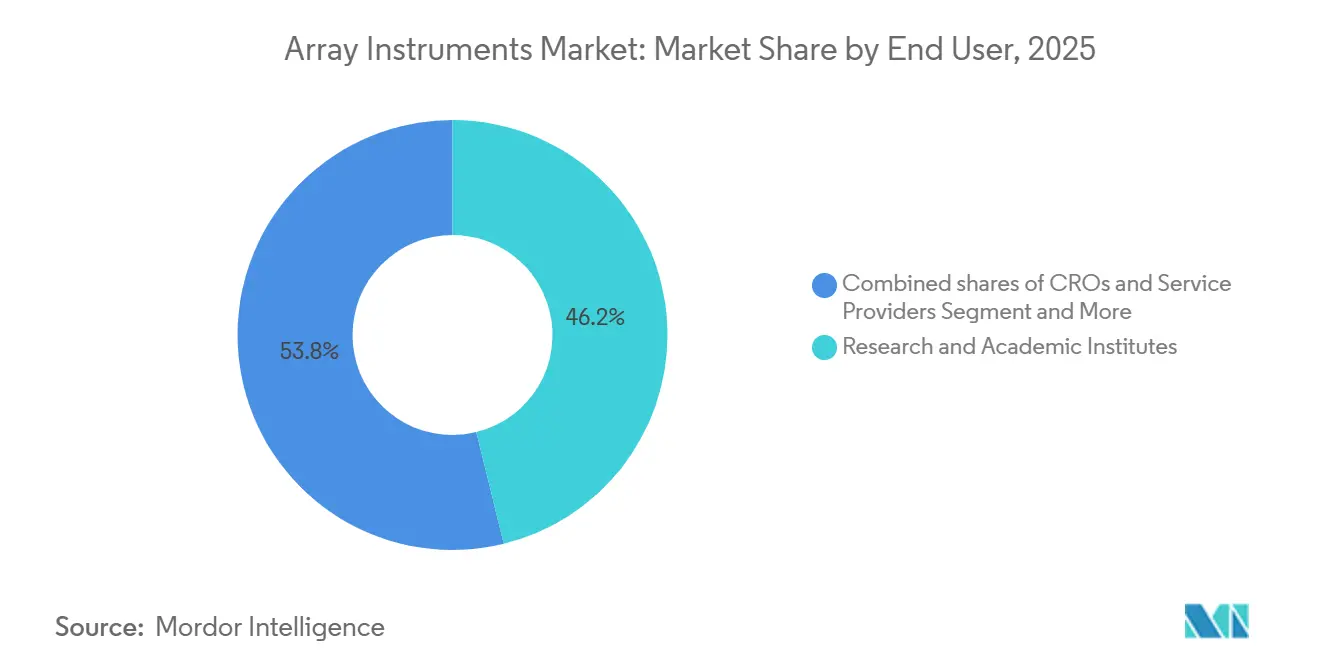
- By end user, research and academic institutes accounted for 46.17% of revenue in 2025, while clinical and diagnostic laboratories are rising at a 7.43% CAGR as reimbursement solidifies.
- By geography, North America accounted for 38.19% of the 2025 value, whereas Asia-Pacific is growing at a 7.39% CAGR as national genomics programs scale up instrument procurement.
Note: Market size and forecast figures in this report are generated using Mordor Intelligence’s proprietary estimation framework, updated with the latest available data and insights as of January 2026.
Global Array Instruments Market Trends and Insights
Drivers Impact Analysis*
| Driver | (~) % Impact on CAGR Forecast | Geographic Relevance | Impact Timeline |
|---|---|---|---|
| CMA first-tier adoption in pediatrics and cytogenetics accelerates scanner installs in clinical labs | +1.8% | North America, Europe, APAC clinical hubs (China Tier-1 cities, India metros) | Medium term (2-4 years) |
| Gene expression and genotyping arrays remain core in translational research workflows | +1.2% | Global, concentrated in North America and Europe academic/pharma R&D centers | Long term (≥ 4 years) |
| Academic and pharma R&D capex refresh cycles favor automated, higher-throughput microarray instruments | +1.0% | North America, Europe, APAC (China, Japan, South Korea) | Medium term (2-4 years) |
| APAC research expansion and molecular diagnostics uptake increase instrument demand | +1.5% | APAC core (China, India, Japan), spill-over to Southeast Asia | Long term (≥ 4 years) |
| Multiplexed proteomic microarrays in vaccine and immunology QA/QC expand need for arrayers and compact imagers | +0.9% | Global, early adoption in North America and Europe pharma/biotech QC labs | Short term (≤ 2 years) |
| Camera-based microarray imaging lowers TCO vs. laser-confocal scanners, aiding adoption in cost-constrained labs | +0.5% | Global, particularly APAC, MEA, South America emerging labs | Medium term (2-4 years) |
| Source: Mordor Intelligence | |||
CMA First-Tier Adoption in Pediatrics and Cytogenetics Accelerates Scanner Installs in Clinical Labs
Chromosomal microarray testing is entrenched as the first diagnostic step for developmental delay, autism spectrum disorder, and multiple congenital anomalies after reaffirmations by pediatric and genetics societies. Diagnostic yields reach 20% in intellectual-disability cohorts, a clear improvement over conventional karyotyping[1]John Moeschler, “Comprehensive Evaluation of the Child With Intellectual Disability,” Pediatrics, aappublications.org. FDA-cleared assays such as CytoScan Dx allow hospitals to internalize testing, cutting external send-outs in half and saving more than USD 250,000 annually, while also shrinking denial rates from U.S. payers. Leading reference labs like Baylor Genetics report two-week result cycles for custom 400K arrays covering over 5,000 genes, keeping scanner utilization high. As reimbursement clarity widens and capital budgets unlock, clinical labs are queuing follow-on purchases for replacement or additional scanners aligned with guideline-mandated volumes. These factors sustain the array instruments market even as sequencing gains share in other domains.
Gene Expression and Genotyping Arrays Remain Core in Translational Research Workflows
Despite the flexibility of RNA-seq, microarrays retain niche advantages such as mature pipelines, lower per-sample cost, and shorter analysis time. Comparative studies in oncology show microarray-based protein-prediction models perform on par with RNA-seq for selected cancers. Illumina logged USD 297 million in array consumables for fiscal 2025, underscoring a still-large installed base of iScan and NextSeq 550 hybrids that run BeadArray assays. The 930 K-probe EPIC v2.0 methylation array pushes weekly capacity over 3,000 samples on a single scanner, making microarrays indispensable for longitudinal cohort studies where platform continuity is critical. High probe counts coupled with flat pricing lock in laboratories that value predictable budgets. Collectively, these elements insulate a sizeable revenue stream within the array of instruments market from rapid substitution.
Academic and Pharma R&D Capex Refresh Cycles Favor Automated, Higher-Throughput Microarray Instruments
Large pharma budgets keep flowing into genomics infrastructure: Regeneron spent USD 5.85 billion on R&D in 2025, with multi-million-sample projects driving equipment orders. Although overall life-science instrument demand at Danaher dipped in 2025, mature drug developers are still replacing manual hybridization ovens with robotic processors that reduce error rates and reduce technician touchpoints. Modern workstations can run 96-well to 3,456-well formats, aligning microarray fabrication with high-content screening norms. Integration with laboratory information systems provides complete audit trails required for ISO 15189 accreditation. These refresh cycles, albeit stretched, add a steady backlog for autoloaders, arrayers, and imagers, underpinning the array instruments market.
Asia-Pacific Research Expansion and Molecular Diagnostics Uptake Increase Instrument Demand
India’s molecular diagnostics segment is projected to grow significantly, propelled by the decentralization of COVID-initiated laboratory capacity. Domestic champions such as MedGenome and Molbio are scaling CAP-accredited facilities and portable PCR platforms, building a customer base that later invests in microarrays for copy-number and methylation assays. In China, Berry Genomics secured NMPA clearance for the NovaSeq 6000Dx-CN-BG in 2025, a landmark approval that raised confidence in genomic-instrument regulation. Venture capital, exemplified by 4baseCare’s USD 6 million Series A, continues to fund precision-oncology labs that blend NGS and microarray services. The convergence of regulatory easing and capital inflows ensures that APAC will outpace mature markets in adding array scanners, processors, and ancillary automation.
Restraints Impact Analysis*
| Restraint | (~) % Impact on CAGR Forecast | Geographic Relevance | Impact Timeline |
|---|---|---|---|
| Substitution by NGS (RNA-seq, WES/WGS) in discovery and many genotyping/CNV applications | -1.3% | Global, most pronounced in North America and Europe research institutions | Long term (≥ 4 years) |
| High upfront instrument cost and total cost of ownership (scanners, automated processors) | -0.8% | Global, particularly constraining in APAC, MEA, South America emerging labs | Medium term (2-4 years) |
| Reimbursement variability and payer utilization controls slow clinical uptake outside select indications | -0.6% | North America (U.S. commercial payers), Europe (national health systems) | Medium term (2-4 years) |
| Export controls/sanctions limiting access to lasers/optics/electronics curb installs in Russia and select markets | -0.4% | Russia, China (D:1/D:5 entities), sanctioned jurisdictions | Short term (≤ 2 years) |
| Source: Mordor Intelligence | |||
Substitution by NGS in Discovery and Many Genotyping/CNV Applications
Sequencing’s declining cost and probe-independent breadth have shifted NIH funding and academic momentum toward RNA-seq, whole-exome, and whole-genome assays. The American College of Medical Genetics clarified in 2024 that genome sequencing may supersede CMA for some neurodevelopmental indications[2]American College of Medical Genetics, “2024 Addendum on CMA Testing,” nature.com. Illumina’s array revenue fell to 8% of total in 2025, while sequencing accounted for a significant share. Yet arrays remain preferred for large-scale methylation epidemiology and certain agrigenomics workflows due to lower sample cost. The balance yields gradual, not abrupt, erosion in the array instruments market.
High Upfront Instrument Cost and Total Cost of Ownership
Entry scanners start at USD 16,500, while six-color models cost USD 73,500 before hybridization ovens and washers. EU IVDR rules now place majority of devices under notified-body review, inflating certification costs for kit vendors and thereby elevating final instrument prices. Smaller manufacturers must amortize regulatory spend over fewer units, prolonging payback periods for buyers. Some vendors are responding with reagent-rental or pay-per-test models, but adoption outside North America remains modest.
*Our forecasts treat driver/restraint impacts as directional, not additive. The impact forecasts reflect baseline growth, mix effects, and variable interactions.
Segment Analysis
By Product Type: Automation Drives Hybridization System Growth
Hybridization and processing systems are expanding at a 7.31% CAGR as labs automate slide handling and washing to lift reproducibility. This segment’s faster pace contrasts with the mature scanner category, which still accounted for 43.18% of 2025 revenue in the array instruments market. Price dispersion ranges from refurbished USD 16,500 GenePix units to USD 73,500 SpotLight Turbo models, aligning budgets across resource tiers.
Automation bundling is now central to procurement; modern processing lines pair sCMOS imagers with bar-coded liquid handlers, feeding data directly to LIMS for IVDR audit trails. The array instruments market for hybridization systems is poised to capitalize on this compliance-driven demand, while camera innovations achieving high quantum efficiency keep total-cost curves favorable. Emerging markets in Southeast Asia and Africa often leapfrog to such imagers, bypassing laser-based predecessors and giving vendors new-unit upside.


By Application: Protein Microarrays Outpace Gene Expression
Protein arrays are forecast to grow 7.56% annually as vaccine and monoclonal antibody developers pivot to high-density, low-volume immunoassays. Gene expression accounted for 42.80% of 2025 revenue but faces RNA-seq encroachment. Notably, the array instruments market size gains in protein applications flow from faster turnaround: silicon pillar processing 192 samples in 2 hours versus a day-long process.
Agrigenomics safeguards baseline demand for genotyping arrays. Wheat and grapevine Axiom panels, each exceeding 20,000 SNP markers, maintain steady throughput on existing iScan fleets. As liquid-capture chips like Bra1K proliferate, labs integrate spotters and imagers optimized for mixed-format workflows, broadening the array of instruments in the market.
By End User: Clinical Labs Accelerate as Reimbursement Pathways Solidify
Research institutes accounted for 46.17% of 2025 revenue, yet growth momentum now tilts toward clinical laboratories, which posted a 7.43% CAGR. FDA-cleared CMA assays reduce payer denials, prompting children’s hospitals to acquire additional scanners and hybridizers. These transactions uplift the array instruments market size for the clinical segment, even as academic refresh cycles lengthen.
Pharma and biotech R&D keep autoloader volumes healthy. Regeneron’s multi-omics investments illustrate sustained capital allocation toward high-throughput array hardware. Contract research organizations, meanwhile, act as shock absorbers, filling capacity vacated by resource-strapped universities and driving consumables pull-through on existing scanners.
Geography Analysis
North America accounted for 38.19% of 2025 revenue, driven by FDA device clearances and established payer frameworks. Hospitals transitioning CMA in-house underpin recurring consumable demand. The array instruments market in the region is steady but mature, with replacement rather than greenfield installs driving unit sales.
Asia-Pacific is the locomotive, expanding at a 7.39% CAGR through 2031. India’s diagnostics boom, coupled with China’s NMPA approvals for medical instruments, unlocks pent-up demand for scanners and hybridizers[3]Scispot, “Molecular Diagnostics in India,” scispot.com. Funding influxes, such as Temasek’s backing of Molbio and Novo Holdings’ stake in MedGenome, ensure capital is available to outfit new labs with arrays and sequencers.
Europe faces IVDR-linked certification queues that are dampening near-term sales, though CE-marked platforms like QIAstat-Dx show compliance is achievable. Long-run upgrade cycles hinge on how swiftly small kit makers can revalidate under the tighter regime. Elsewhere, Latin America and Africa are adopting camera-based imagers bundled under reagent-rental deals that sidestep heavy capex, thereby expanding the future install base, albeit from a low baseline.

Competitive Landscape
The field shows moderate concentration. Illumina, Inc., Agilent, Thermo Fisher, and Danaher leverage extensive installed bases, but Illumina’s array revenue slipped in corporate sales in 2025, highlighting sequencing cannibalization. Agilent countered with a USD 915 million BIOVECTRA buy to consolidate probe-synthesis capabilities and protect margins. Thermo Fisher’s alliance with NVIDIA brings AI differentiation, while Danaher integrates Beckman Colter and Molecular Devices assets to cross-sell automation suites.
Niche players, including Innopsys, SCIENION, and Arrayjet, craft flexible spotters and compact imagers that slot into proteomic or agrigenomic niches. Their agility offsets scale disadvantages, allowing them to win application-specific tenders. White-space potential is largest in camera-based scanners that avoid export-controlled lasers, holding promise for emerging-market growth. Overall, vendor strategies revolve around bundling hardware, software, and consumables into data-rich ecosystems that lock clients in and stabilize the array of instruments market.
Array Instruments Industry Leaders
Agilent Technologies
Thermo Fisher Scientific
Danaher Corporation
SCIENION
Illumina, Inc.
- *Disclaimer: Major Players sorted in no particular order

Recent Industry Developments
- January 2026: Thermo Fisher and NVIDIA began embedding AI in lab instruments, signaling a software-centric pivot.
- January 2025: Vibrant Sciences launched a silicon protein array designed to process 192 samples in two hours, featuring 400 antigens.


Global Array Instruments Market Report Scope
As per the scope of the report, array instruments are essential laboratory tools used to detect and quantify biological molecules, such as DNA, RNA, or proteins, by measuring hybridization across thousands of microscopic spots simultaneously. These systems typically comprise specialized hardware for fabrication, processing, and data acquisition.
The array instruments market is segmented by product type, applications, end users, and geography. Based on product type, the market is segmented into microarray scanners, microarray arrayers/spotters, hybridization/processing systems, and automated workstations & autoloaders. Based on applications, the market is segmented into gene expression profiling, genotyping / SNP analysis, chromosomal microarray analysis (aCGH/CMA), DNA methylation/epigenetics, protein microarray applications, drug discovery & biomarker discovery. By end users, the market is segmented into research & academic institutes, pharmaceutical & biotechnology companies, clinical/diagnostic laboratories, CROs & service providers, government & non-profit laboratories. By geography, the market is segmented into North America, Europe, Asia-Pacific, the Middle East & Africa, and South America. The market report also covers the estimated market sizes and trends for 17 countries across major regions globally. For each segment, the market size and forecast are provided in terms of value (USD).
| Microarray Scanners |
| Microarray Arrayers / Spotters |
| Hybridization / Processing Systems (washers, ovens, processors) |
| Automated Workstations & Autoloaders |
| Gene Expression Profiling |
| Genotyping / SNP Analysis |
| Chromosomal Microarray Analysis (aCGH/CMA) |
| DNA Methylation / Epigenetics |
| Protein Microarray Applications (proteomics, immunoassay) |
| Drug Discovery & Biomarker Discovery |
| Research & Academic Institutes |
| Pharmaceutical & Biotechnology Companies |
| Clinical / Diagnostic Laboratories |
| CROs & Service Providers |
| Government & Non-profit Laboratories |
| North America | United States |
| Canada | |
| Mexico | |
| Europe | Germany |
| United Kingdom | |
| France | |
| Italy | |
| Spain | |
| Rest of Europe | |
| Asia-Pacific | China |
| India | |
| Japan | |
| South Korea | |
| Australia | |
| Rest of Asia-Pacific | |
| Middle East and Africa | GCC |
| South Africa | |
| Rest of Middle East and Africa | |
| South America | Brazil |
| Argentina | |
| Rest of South America |
| By Product Type | Microarray Scanners | |
| Microarray Arrayers / Spotters | ||
| Hybridization / Processing Systems (washers, ovens, processors) | ||
| Automated Workstations & Autoloaders | ||
| By Application | Gene Expression Profiling | |
| Genotyping / SNP Analysis | ||
| Chromosomal Microarray Analysis (aCGH/CMA) | ||
| DNA Methylation / Epigenetics | ||
| Protein Microarray Applications (proteomics, immunoassay) | ||
| Drug Discovery & Biomarker Discovery | ||
| By End User | Research & Academic Institutes | |
| Pharmaceutical & Biotechnology Companies | ||
| Clinical / Diagnostic Laboratories | ||
| CROs & Service Providers | ||
| Government & Non-profit Laboratories | ||
| By Geography | North America | United States |
| Canada | ||
| Mexico | ||
| Europe | Germany | |
| United Kingdom | ||
| France | ||
| Italy | ||
| Spain | ||
| Rest of Europe | ||
| Asia-Pacific | China | |
| India | ||
| Japan | ||
| South Korea | ||
| Australia | ||
| Rest of Asia-Pacific | ||
| Middle East and Africa | GCC | |
| South Africa | ||
| Rest of Middle East and Africa | ||
| South America | Brazil | |
| Argentina | ||
| Rest of South America | ||


Key Questions Answered in the Report
What is the projected growth of the array instruments market during the forecast period?
The array instruments market, valued at USD 1.30 billion in 2025, is projected to grow to USD 1.9 billion by 2031, starting from an estimated USD 1.40 billion in 2026, marking a CAGR of 6.89% during the forecast period.
Which product category is posting the quickest gains?
Hybridization and processing systems lead growth at 7.31% annually because labs are automating washing and incubation to raise throughput.
Are protein microarrays displacing ELISA in vaccine testing?
Yes, silicon-based arrays processing 192 samples in two hours are replacing lengthy ELISA runs, driving a 7.56% CAGR to 2031 for protein-array applications.
Why are APAC markets critical to future sales?
China and India are scaling molecular-diagnostic infrastructure and securing local regulatory approvals, pushing Asia-Pacific revenue up by 7.39% yearly.
Page last updated on:


