Market Overview
| Study Period | 2019 - 2030 |
| Market Size (2025) | USD 19.93 Billion |
| Market Size (2030) | USD 31.18 Billion |
| Growth Rate (2025 - 2030) | 9.37% CAGR |
| Fastest Growing Market | Asia Pacific |
| Largest Market | Asia Pacific |
| Market Concentration | Medium |
Major Players
*Disclaimer: Major Players sorted in no particular order Image © Mordor Intelligence. Reuse requires attribution under CC BY 4.0. |
|

Pressure Sensors Industry Market Analysis by Mordor Intelligence
The pressure sensors market size is valued at USD 19.93 billion in 2025 and is forecast to reach USD 31.18 billion by 2030, advancing at a 9.37% CAGR. Strong demand stems from electrified power-train control, smart-factory retrofits, and disposable medical devices that require precise pressure monitoring for safety and efficiency. Electrification mandates in Asia-Pacific are accelerating adoption of high-accuracy barometric sensors in xEV battery-thermal systems, while Industry 4.0 upgrades across Europe and North America favor wireless nodes that cut installation cost. Medical device miniaturization, especially in cardiovascular catheters, is opening a sizeable opportunity for single-use MEMS designs that meet sterilization standards. At the same time, harsh-environment exploration—such as LNG carrier fleets—creates premium demand for silicon-carbide and optical technologies capable of surviving >175 °C process lines. Competitive intensity is rising: incumbents embed AI engines at the edge to defend margins, whereas Chinese white-label MEMS foundries scale volume and depress average selling prices.
Key Report Takeaways
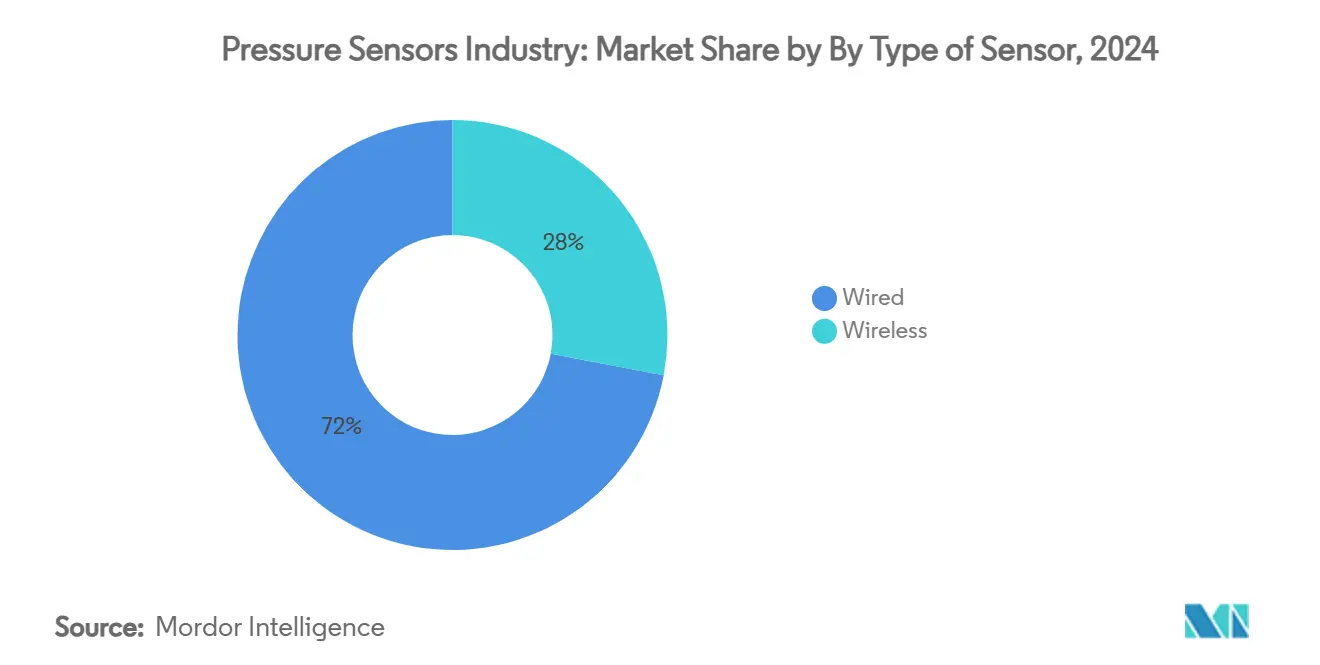
- By type of connectivity, wired sensors dominated with 72% revenue share in 2024; wireless nodes are projected to expand at a 12.8% CAGR through 2030.
- By application, automotive accounted for 21% of the pressure sensors market share in 2024, while medical devices are poised to grow fastest at 11.5% CAGR to 2030.
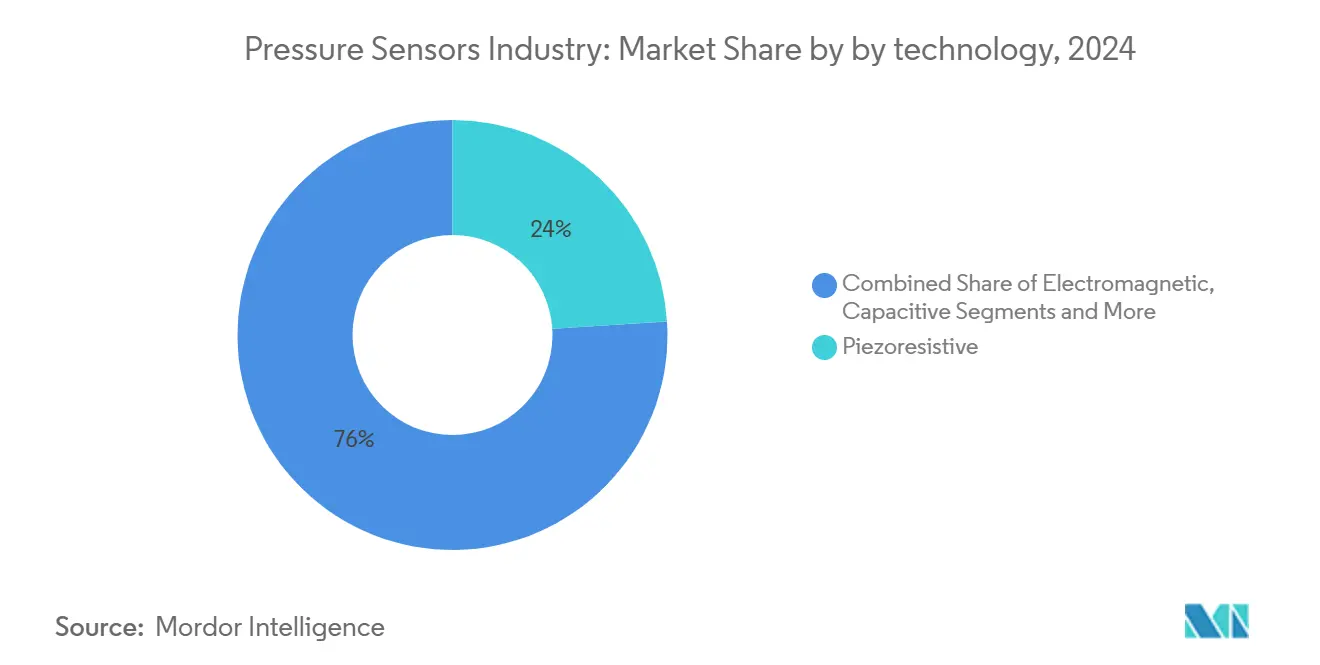
- By technology, piezoresistive designs led with 24% revenue share in 2024; optical devices are set to register the highest CAGR of 14.2% to 2030.
- By geography, Asia-Pacific held 36% of global revenue in 2024, whereas the Middle East & Africa region is forecast to post the fastest 12.22% CAGR by 2030.
- Recent M&A shows rising consolidation: Crane Company, Druck brand parent, acquired Baker Hughes’ Precision Sensors & Instrumentation unit for USD 1.06 billion in September 2025, strengthening aerospace coverage.
Global Pressure Sensors Industry Market Trends and Insights
Drivers Impact Analysis
| DRIVER | (~) % IMPACT ON CAGR FORECAST | GEOGRAPHIC RELEVANCE | IMPACT TIMELINE |
|---|---|---|---|
| Rapid electrification of xEV power-train control systems driving high-accuracy barometric sensing | +1.8% | Asia-Pacific core, spill-over to Europe & North America | Medium term (2-4 years) |
| Expansion of smart factory retrofits boosting wireless sensor node demand | +1.2% | Europe & North America, expanding to APAC | Short term (≤ 2 years) |
| Mandatory tyre-pressure monitoring adoption waves in India & ASEAN two-wheelers | +0.9% | India & ASEAN markets, potential global expansion | Medium term (2-4 years) |
| Accelerated rollout of 5G mmWave radios requiring precision thermo-mechanical pressure control | +0.7% | Global, with early deployment in developed markets | Long term (≥ 4 years) |
| Adoption of disposable MEMS pressure catheters in outpatient cardiovascular clinics | +0.6% | United States core, expanding to Europe | Short term (≤ 2 years) |
| LNG carrier fleet build-up elevating harsh-environment subsea pressure instrumentation | +0.4% | Middle East core, global maritime applications | Long term (≥ 4 years) |
Source: Mordor Intelligence
Understand The Key Trends Shaping This Market
Download PDF
Rapid electrification of xEV power-train control systems driving high-accuracy barometric sensing
Electric vehicles use precision barometric sensors to detect cell swelling and manage heat, avoiding thermal runaway events that can cost OEMs up to USD 3,000 per vehicle. Sensor suppliers are hardening designs for >175 °C operation because silicon-carbide traction inverters will reach 50% penetration by 2027. Automotive demand is strongest in China, Japan, and South Korea where gigafactory capacity and government subsidies intersect to accelerate adoption.
Expansion of smart-factory retrofits boosting wireless sensor node demand
European and North American manufacturers are layering LoRaWAN and NB-IoT pressure nodes onto legacy equipment to enable predictive maintenance; low-power wide-area connections are forecast to exceed 3.5 billion by 2030. Assembly lines such as WIKA’s gauge facility now incorporate more than 10,000 sensor variants in a single automated cell. Retrofit projects prioritize battery-powered nodes to avoid expensive conduit runs, a key factor behind the 12.8% CAGR in wireless uptake.[2]RCR Wireless News, “NB-IoT and LoRa crowned kings of IoT – to hit 3.5 bn connections by 2030,” rcrwireless.com
Mandatory tyre-pressure monitoring adoption waves in India & ASEAN two-wheelers
India’s Bureau of Indian Standards released IS 18590: 2024 and IS 18606: 2024 to tighten EV safety, indirectly accelerating TPMS installation in motorcycles and scooters. The Ministry of Road Transport & Highways also expanded the national highway network to 146,126 km by July 2024, bolstering higher-speed corridors that demand advanced safety features.[3]Ministry of Road Transport & Highways, “Transforming India’s Road Infrastructure,” pib.gov.in
Accelerated rollout of 5G mmWave radios requiring precision thermo-mechanical pressure control
DARPA funded Honeywell’s atomic-vapor sensor program for millimeter-wave base-stations, illustrating how precision pressure monitoring underpins RF device thermal stability. Even micro-kelvin shifts can distort mmWave signals, creating niche demand for high-accuracy industrial sensors that thrive outdoors.
Restraints Impact Analysis
| RESTRAINTS | (~) % IMPACT ON CAGR FORECAST | GEOGRAPHIC RELEVANCE | IMPACT TIMELINE |
|---|---|---|---|
| ASP erosion from Chinese white-label MEMS foundries | -1.4% | Global, with strongest impact in price-sensitive segments | Short term (≤ 2 years) |
| Fragmented wireless protocol landscape inflating integration cost | -0.8% | Global, particularly affecting IoT deployments | Medium term (2-4 years) |
| Reliability concerns in optical pressure chips beyond 175°C process lines | -0.6% | Industrial & automotive applications globally | Long term (≥ 4 years) |
| Supply-chain exposure to bulk piezoresistive wafer shortages | -0.5% | Global, with Asia-Pacific manufacturing concentration | Medium term (2-4 years) |
Source: Mordor Intelligence
ASP erosion from Chinese white-label MEMS foundries
Firms such as MEMSensing posted 28.8%–36.85% revenue growth in 2024 while still running at a loss, underscoring aggressive pricing tactics that compress margins for global incumbents. Western vendors answer by pivoting toward high-temperature silicon-carbide and AI-enabled packages.
Fragmented wireless protocol landscape inflating integration cost
NB-IoT dominance in China clashes with LoRaWAN preference in private networks, forcing sensor OEMs to design multi-stack radios and raising BOM cost. Healthcare deployments struggle to reconcile battery lifetime with high-bandwidth IEEE 802.15.6 requirements.
Segment Analysis
By Connectivity: Wired dominance faces wireless disruption
Wired devices retained 72% revenue in 2024 due to deterministic data delivery in power-rich settings such as engine control units and surgical theaters. However, wireless nodes will outpace with a 12.8% CAGR as factories retrofit to Industry 4.0. Smart Control retrofit kits cut installation expense by 40% while enabling predictive shutdowns for pressure vessels. Power-over-Ethernet upgrades are keeping wired sensors relevant by multiplexing power and data on a single line. Wireless nodes leverage energy harvesting and edge compute, allowing placement on rotating shafts or sealed chambers once considered unreachable.
By Product Type: Absolute sensors lead despite differential growth
Absolute designs held 46% share in 2024 because manifold pressure, weather logging, and drone altimetry require vacuum-referenced readings. Differential units will see a 10.4% CAGR thanks to HVAC retrofits and filtration monitoring in cleanrooms. Recent wet-etch silicon fabrication pushed sensitivity to 5.07 mV/V/MPa with 0.67% FS linearity. Gauge units remain staple devices in hydraulics but exhibit only mid-single-digit growth.[3]MDPI, “IEEE 802.15.6 and LoRaWAN for WBAN in Healthcare: A Comparative Study,” mdpi.com
By Technology: Piezoresistive leadership challenged by optical innovation
Piezoresistive chips captured 24% revenue in 2024 through cost-effective CMOS line sharing. Optical devices, growing at 14.2% CAGR, attract subsea and medical OEMs seeking EMI immunity. Leadless silicon-carbide variants now survive from –50 °C to 600 °C while holding 0.18% FSO stability. AI micro-controllers inside piezoresistive MEMS enable on-die calibration, shrinking offset drift and creating self-healing firmware updates.
Note: Segment shares of all individual segments available upon report purchase
By Application: Automotive dominance yields to medical innovation
Automotive consumed 21% of 2024 revenue as TPMS, EGR, and battery packs relied on robust sensing. Yet medical devices are set to expand 11.5% each year because single-use catheters reduce infection risk and meet outpatient reimbursement models. Soft 3-D piezoresistive patches paired with Bluetooth modules now monitor blood pressure post-angioplasty from the patient’s home.
Geography Analysis
Asia-Pacific’s 36% leadership stems from China’s MEMS fabs and India’s TPMS mandates. The National Highways expansion and 5,293 EV charging stations catalyze sensor content per vehicle. Local producers are closing the technology gap; Major players notes domestic suppliers are integrating AI into automotive perception stacks. Europe leverages its industrial automation heritage; Infineon’s EUR 5 billion Dresden Smart Power Fab underscores strategic semiconductor self-reliance. North America excels in aerospace and medical segments, with DARPA-funded research pushing sensing frontiers. The Middle East & Africa posts the fastest 12.22% CAGR on LNG projects needing subsea instrumentation, complemented by smart-city infrastructure that seeds wireless deployments.

Note: Segment shares of all individual segments available upon report purchase
Competitive Landscape
Market fragmentation remains moderate. Top five vendors control around 45% of revenue, leaving room for specialists. Crane Company’s USD 1.06 billion cash purchase of Baker Hughes’ PSI unit delivered the Druck brand into its portfolio, strengthening aerospace and nuclear coverage. Infineon consolidated sensing and RF into its SURF division to accelerate AI-integrated packages, while Bosch Sensortec partnered with NextNav to refine barometric altitude for smartphones. Chinese entrants such as Senmol scale quickly after Series B funding, targeting cost-sensitive segments and exerting ASP pressure. Strategic responses include AI on the sensor edge, silicon-carbide platforms for >600 °C, and vertically integrated software ecosystems that bundle analytics with hardware.
Pressure Sensors Industry Industry Leaders
-
Honeywell International Inc.
-
Bosch Sensortec GmbH
-
TE Connectivity
-
Sensata Technologies Inc.
-
Emerson Electric Co.
- *Disclaimer: Major Players sorted in no particular order

Need More Details on Market Players and Competitors?
Download PDF
Recent Industry Developments
- February 2025: Infineon Technologies received EU funding approval under the European Chips Act for its Smart Power Fab in Dresden, with total funding of around EUR 1 billion to enhance semiconductor capacity in automotive, security, and industrial sectors. The investment supports sensor technology development and creates up to 1,000 jobs while promoting collaboration with European universities and research institutions.
- January 2025: Infineon Technologies formed a new business unit, SURF (Sensor Units & Radio Frequency), to enhance sensor and RF capabilities effective January 1, 2025. The strategic move leverages synergies in R&D and cost to address growing sensor demand driven by green energy, mobility, and IoT trends.
- September 2025: Crane Company announced acquisition of Precision Sensors & Instrumentation from Baker Hughes for USD 1.06 billion. PSI generates USD 390 million in sales and strengthens Crane's pressure sensing capabilities through the Druck brand for aerospace applications.
Global Pressure Sensors Industry Report Scope
The pressure sensor detects, measures, and transmits the information, which helps analyze the performance of a device. It uses IC fabrication technology made on silicon wafers, monitors and controls the pressure of gases and liquids, and measures different pressures, such as absolute, gauge, and differential pressure. Pressure sensors are used in numerous applications, which include medical, automotive, industrial, aerospace and defense, consumer electronics, food and beverage, HVAC, etc.
The pressure sensor market is segmented by type of sensor (wired and wireless), by product type (absolute, differential, and gauge), by technology (piezoresistive, electromagnetic, capacitive, resonant solid-state, optical, and other pressure sensors), by application (automotive, medical, consumer electronics, industrial, aerospace and defense, food and beverage, and HVAC) and geography (North America (United States, Canada), Europe (United Kingdom, Germany, France, Rest of Europe), Asia-Pacific (China, Japan, India, Rest of Asia Pacific), Latin America, Middle East and Africa). The market sizes and forecasts are provided in terms of value (USD) for all the above segments.
| By Type of Sensor | Wired | ||
| Wireless | |||
| By Product Type | Absolute | ||
| Differential | |||
| Gauge | |||
| By Technology | Piezoresistive | ||
| Electromagnetic | |||
| Capacitive | |||
| Resonant Solid-State | |||
| Optical | |||
| Other Pressure Sensors | |||
| By Application | Automotive | ||
| Medical | |||
| Consumer Electronics | |||
| Industrial | |||
| Aerospace and Defense | |||
| Food and Beverage | |||
| HVAC | |||
| By Geography | North America | United States | |
| Canada | |||
| Mexico | |||
| Europe | United Kingdom | ||
| Germany | |||
| France | |||
| Italy | |||
| Rest of Europe | |||
| Asia-Pacific | China | ||
| Japan | |||
| India | |||
| South Korea | |||
| Rest of Asia-Pacific | |||
| Middle East | Israel | ||
| Saudi Arabia | |||
| United Arab Emirates | |||
| Turkey | |||
| Rest of Middle East | |||
| Africa | South Africa | ||
| Egypt | |||
| Rest of Africa | |||
| South America | Brazil | ||
| Argentina | |||
| Rest of South America | |||
By Type of Sensor
| Wired |
| Wireless |
By Product Type
| Absolute |
| Differential |
| Gauge |
By Technology
| Piezoresistive |
| Electromagnetic |
| Capacitive |
| Resonant Solid-State |
| Optical |
| Other Pressure Sensors |
By Application
| Automotive |
| Medical |
| Consumer Electronics |
| Industrial |
| Aerospace and Defense |
| Food and Beverage |
| HVAC |
By Geography
| North America | United States |
| Canada | |
| Mexico | |
| Europe | United Kingdom |
| Germany | |
| France | |
| Italy | |
| Rest of Europe | |
| Asia-Pacific | China |
| Japan | |
| India | |
| South Korea | |
| Rest of Asia-Pacific | |
| Middle East | Israel |
| Saudi Arabia | |
| United Arab Emirates | |
| Turkey | |
| Rest of Middle East | |
| Africa | South Africa |
| Egypt | |
| Rest of Africa | |
| South America | Brazil |
| Argentina | |
| Rest of South America |
Need A Different Region or Segment?
Customize Now
Key Questions Answered in the Report
What is the current size of the pressure sensors market?
The market is valued at USD 19.93 billion in 2025.
How fast will the pressure sensors market grow through 2030?
Revenue is projected to expand at a 9.37% CAGR, reaching USD 31.18 billion by 2030.
Which application segment is forecast to grow fastest?
Medical devices—particularly disposable MEMS pressure catheters—are expected to post the highest 11.5% CAGR.
Why are wireless pressure sensors gaining traction in factories?
Industry 4.0 retrofits favor wireless nodes because they cut wiring costs and allow flexible sensor placement without disrupting production.
Which region currently generates the largest share of revenue?
Asia-Pacific leads with 36% of global pressure-sensor sales thanks to strong xEV production and mandatory TPMS adoption.
How concentrated is the competitive landscape?
The top five suppliers control roughly 45% of global revenue, giving the market a moderate concentration score of 6 on a 1–10 scale.
Page last updated on: July 5, 2025

