Applied AI Service Market Size and Share
Market Overview
| Study Period | 2019 - 2030 |
|---|---|
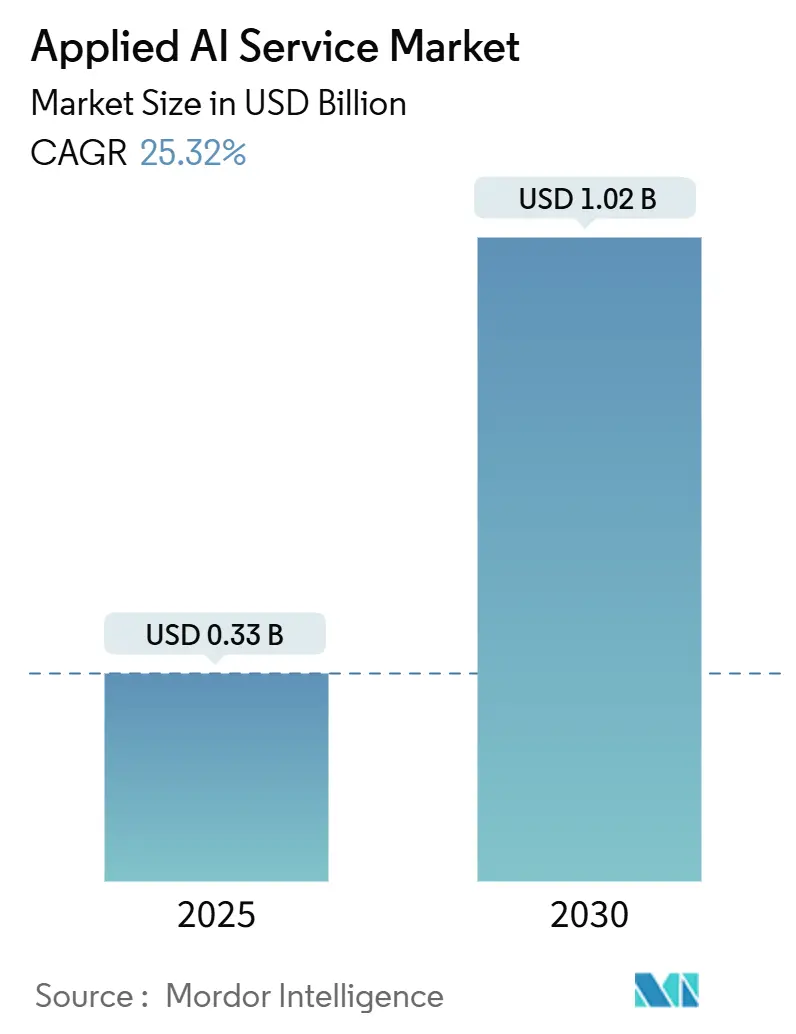
| Market Size (2025) | USD 0.33 Billion |
| Market Size (2030) | USD 1.02 Billion |
| Growth Rate (2025 - 2030) | 25.32% CAGR |
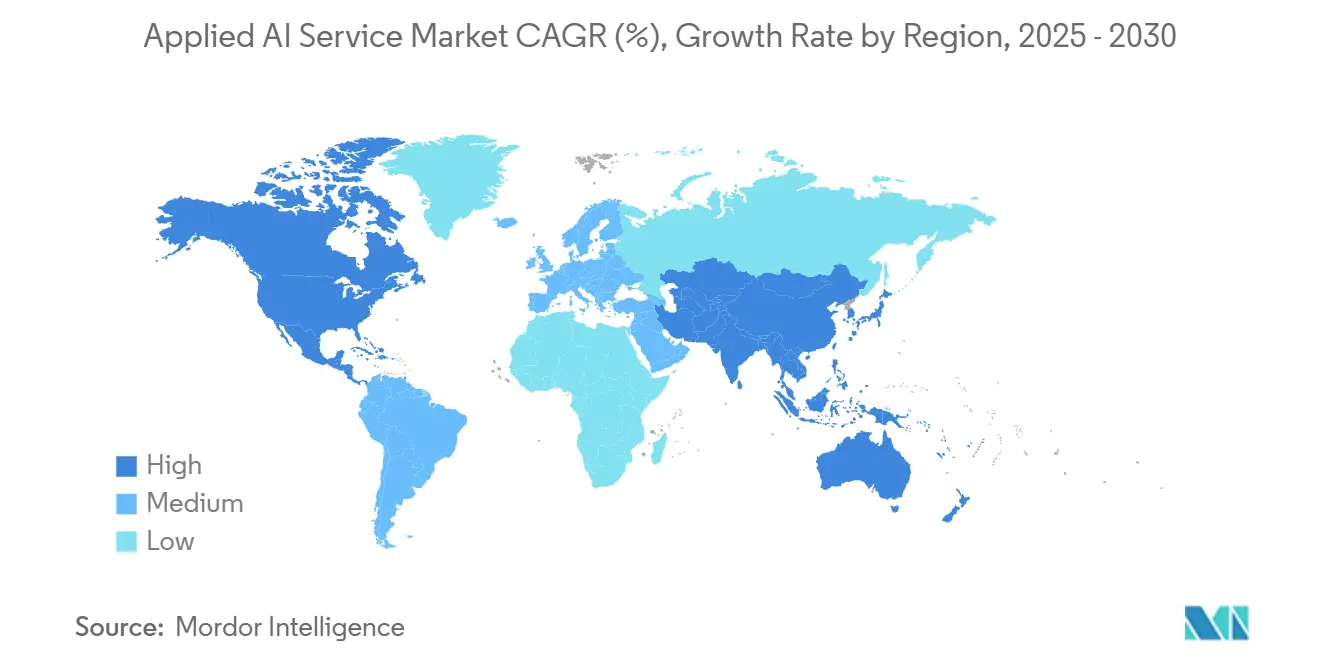
| Fastest Growing Market | Asia Pacific |
| Largest Market | North America |
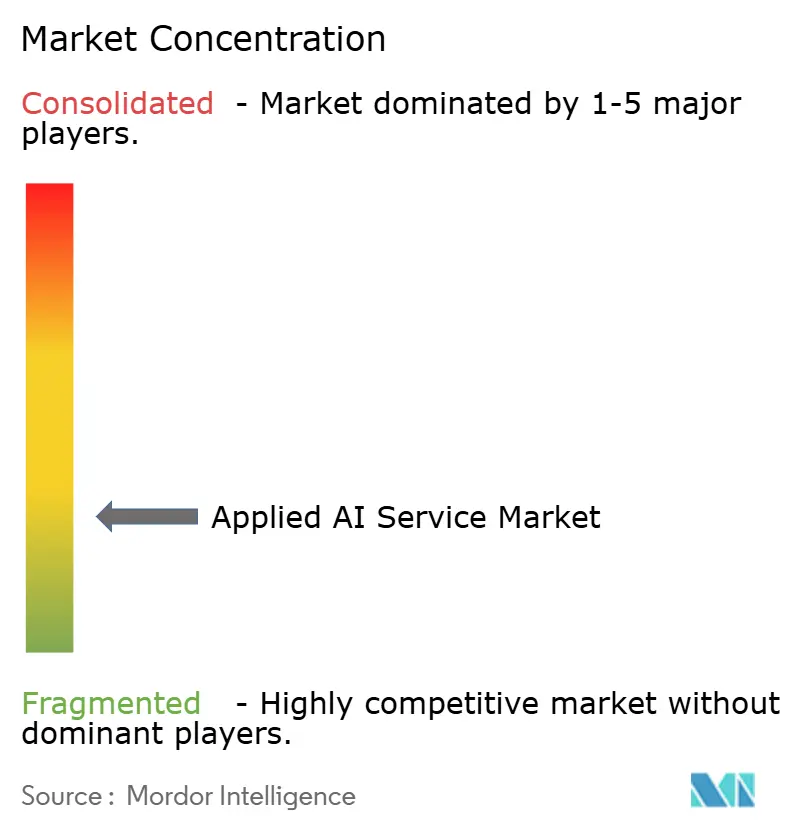
| Market Concentration | Low |
Major Players *Disclaimer: Major Players sorted in no particular order Image © Mordor Intelligence. Reuse requires attribution under CC BY 4.0. | |
Applied AI Service Market Analysis by Mordor Intelligence
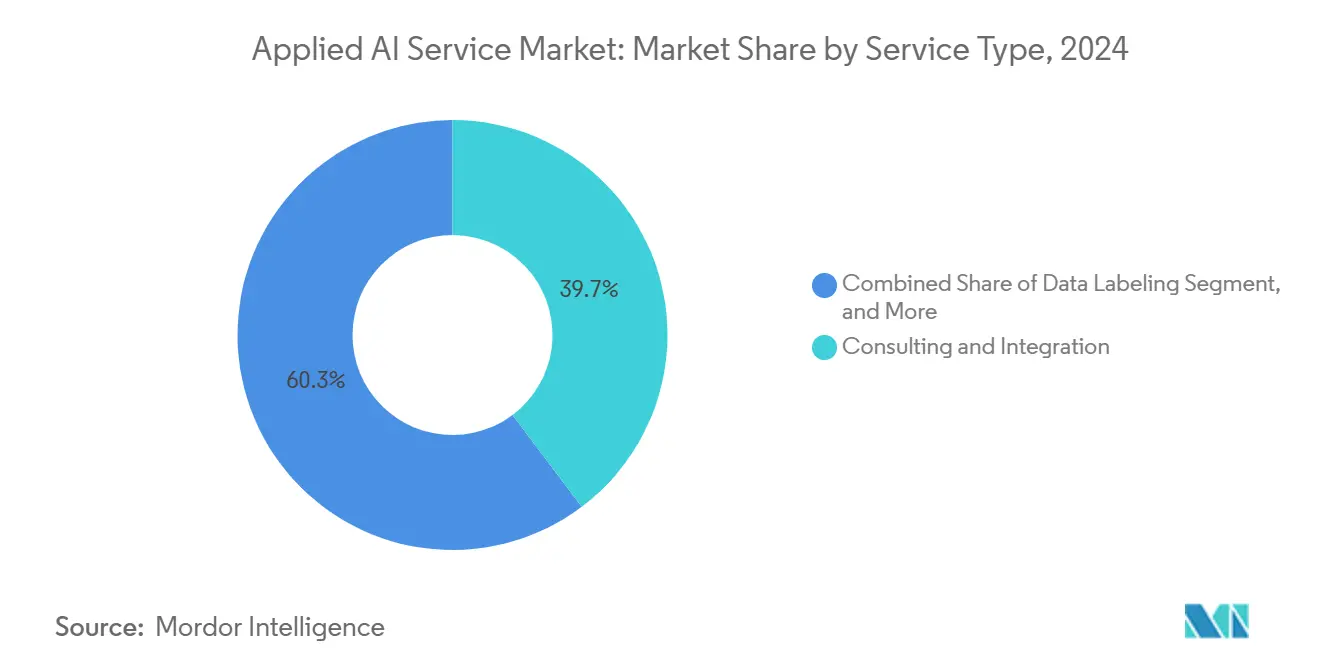
The Applied AI Service market size is projected to reach USD 1.02 billion by 2030, advancing at a 25.32% CAGR from USD 330 million in 2025. Enterprises are transitioning from pilots to production rollouts that require mature consulting, integration, and governance skills. Investment momentum favors firms that can operationalize cloud-native AI, optimize model performance under energy constraints, and comply with data-sovereignty rules. Consulting and integration services held the largest 39.74% share in 2024, as organizations required strategy roadmaps and multi-cloud orchestration capabilities. Inference and deployment services recorded the fastest trajectory with a 26.78% CAGR, reflecting the move toward always-on AI pipelines. North America led with 38.97% of revenue, due to a sophisticated buyer base and clear governance frameworks, while the Asia-Pacific region delivered the highest 26.19% CAGR, as sovereign AI programs boosted local engagement. Machine-learning-based offerings commanded a 43.76% share, yet natural language processing services expanded at a 26.64% CAGR on surging demand for conversational agents and document-understanding tools. Pressure points include rising infrastructure energy costs and fragmented cross-border data residency rules; however, cloud-delivered managed services continue to lower adoption barriers for small and medium-sized enterprises.
Key Report Takeaways
- By service type, consulting and integration accounted for 39.74% of the Applied AI Service market share in 2024; inference and deployment are forecast to grow at 26.78% CAGR through 2030.
- By technology, machine-learning services led with 43.76% revenue share in 2024, while natural language processing is projected to expand at a 26.64% CAGR to 2030.
- By deployment mode, cloud accounted for 79.42% of the Applied AI Service market size in 2024; hybrid deployment is projected to advance at a 25.74% CAGR through 2030.
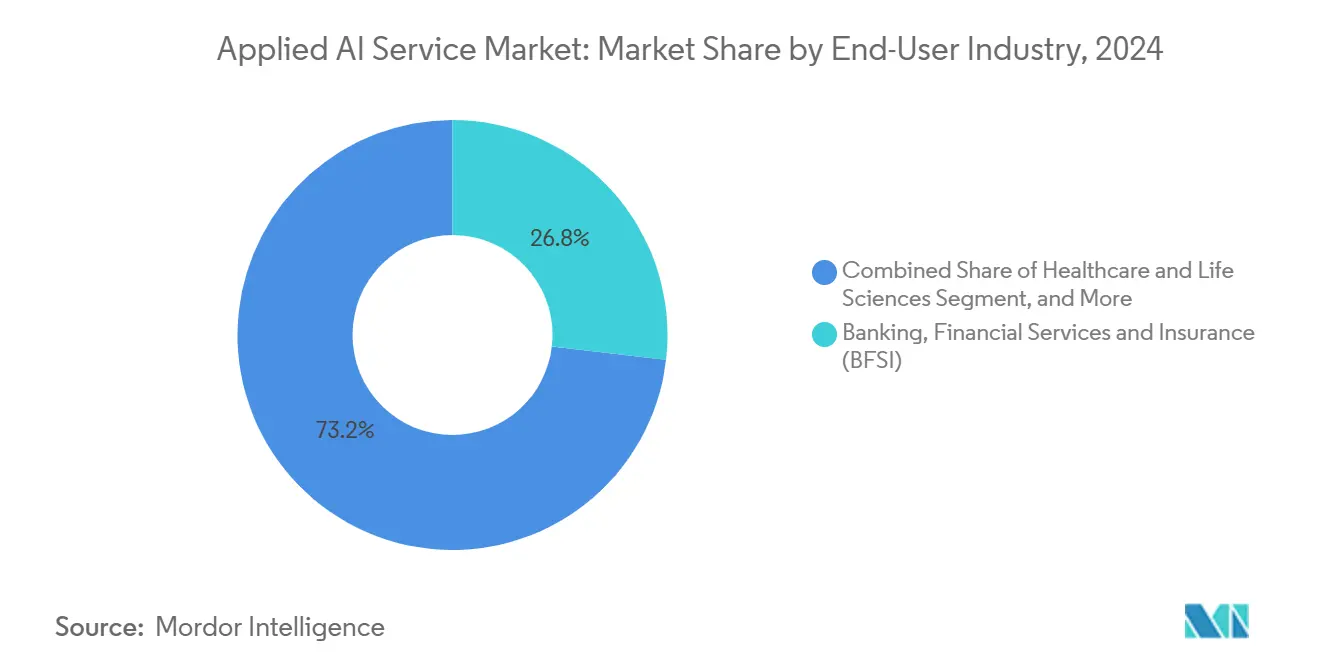
- By end-user industry, banking, financial services, and insurance held 26.83% of the revenue in 2024, whereas the healthcare and life sciences sector is growing fastest at a 26.89% CAGR through 2030.
- By organization size, large enterprises held 62.19% of the revenue in 2024, whereas the Small and Medium Enterprises (SMEs) are growing fastest at a 25.47% CAGR through 2030.
- By geography, North America captured a 38.97% market share in 2024, and the Asia-Pacific region is projected to have the highest 26.19% CAGR from 2024 to 2030.
Note: Market size and forecast figures in this report are generated using Mordor Intelligence’s proprietary estimation framework, updated with the latest available data and insights as of January 2026.
Global Applied AI Service Market Trends and Insights
Drivers Impact Analysis*
| Driver | (~) % Impact on CAGR Forecast | Geographic Relevance | Impact Timeline |
|---|---|---|---|
| Accelerated Cloud-Native AI Adoption | +4.2% | Global, concentrated in North America and Europe | Short term (≤ 2 years) |
| Explosion of Industry-Specific Foundation Models | +3.8% | Global, early BFSI and healthcare gains | Medium term (2-4 years) |
| Shift Toward Outcome-Based AI Service Contracts | +3.5% | North America and Europe, expanding to Asia-Pacific | Medium term (2-4 years) |
| Open-Source AI Framework Maturation | +2.9% | Global, regulatory influence from FDA, EMA, GDPR | Long term (≥ 4 years) |
| Sovereign AI Initiatives | +4.1% | Asia-Pacific core, spill-over to Middle East and Africa | Long term (≥ 4 years) |
| Rapid Democratization of Generative AI | +3.7% | Global, SME concentration in developed markets | Short term (≤ 2 years) |
| Source: Mordor Intelligence | |||
Accelerated Cloud-Native AI Adoption by Enterprises
Spending on scalable cloud platforms continues to rise as containerized AI workloads allow rapid iteration and simplified governance. Microsoft reported that revenue from Azure AI services climbed 45% year over year in Q3 2024, while Amazon Web Services logged 38% growth in AI offerings.[1]Microsoft Corp., “Microsoft Cloud Strength Fuels Third Quarter Results,” microsoft.com Enterprises leverage managed orchestration, latency-aware inference, and multi-cloud failover to meet their uptime needs. Standardized compliance controls, including SOC 2 and ISO 27001 attestations, reduce due diligence cycles and expedite procurement. Service providers that master hybrid networking, model lineage tracking, and performance tuning capture premium engagements. Because AI platform complexity now exceeds typical IT skill sets, organizations increasingly outsource day-two operations, underpinning steady demand for specialized integration expertise.
Explosion of Industry-Specific Foundation Models
Large enterprises want models pre-trained on domain-rich corpora that address jargon, process context, and compliance mandates. Financial institutions such as JPMorgan Chase rolled out IndexGPT for research, and Goldman Sachs partnered with Anthropic to parse regulatory filings.[2]Bloomberg, “Goldman Sachs Partners with Anthropic on AI Tools,” bloomberg.com In healthcare, partnerships between Roche and Recursion Pharmaceuticals demonstrate how molecular-aware models accelerate target discovery. Service providers win projects by combining vertical data engineering, transparent fine-tuning, and compliance documentation. Successful delivery requires in-house clinicians, actuaries, or chemists who guide prompt design and validation, building defensible moats for firms with deep domain staffing.
Shift Toward Outcome-Based AI Service Contracts
More buyers link vendor payment to operational metrics, aligning incentives and transferring risk to suppliers. Accenture disclosed that 67% of its 2024 AI projects used gain-share or metric-tethered fees.[3]Accenture, “AI Investments and Business Value,” accenture.com Typical key performance indicators include incident resolution time, underwriting accuracy, or revenue lift. Vendors invest in robust baseline measurement, continuous value dashboards, and turn-key model-ops to safeguard margins. Outcome-based deals promote longer-term renewals and higher switching costs, but force providers to absorb performance volatility, favoring established players with strong delivery track records and proprietary reference architectures.
Sovereign AI Initiatives Driving Local Service Demand
Governments across China, Japan, and India are now requiring localized data processing and algorithm audits, which is spurring investment in domestic data centers and compliance advisory services. Policy support includes grants for on-shore model training farms and public-sector pilot budgets. Providers that build local partnerships and obtain security clearances secure priority access to high-value public projects. The rush to satisfy residency clauses accelerates regional spending on hybrid-edge deployments and trusted model marketplaces, creating pull-through revenue for system integrators, infrastructure vendors, and managed-service partners.
Restraints Impact Analysis*
| Restraint | (~) % Impact on CAGR Forecast | Geographic Relevance | Impact Timeline |
|---|---|---|---|
| Escalating AI Infrastructure Energy Costs | -2.1% | Global, acute in Europe | Short term (≤ 2 years) |
| Emerging Cross-Border AI Data Residency Mandates | -1.8% | Global, driven by GDPR and national laws | Medium term (2-4 years) |
| Talent Retention Challenges | -1.5% | Asia-Pacific and North America tech hubs | Long term (≥ 4 years) |
| Growing Customer Skepticism on AI Ethics | -1.3% | Global, focus in regulated industries | Medium term (2-4 years) |
| Source: Mordor Intelligence | |||
Escalating AI Infrastructure Energy Costs
Training a single large language model can consume 1,287 megawatt-hours (MWh), roughly equivalent to the annual electricity use of 120 U.S. homes. Europe faces sharper pressure as wholesale power prices surged 40% in 2024, compelling providers to invest in model compression, quantization, and workload scheduling. Edge-optimized deployments and federated learning distribute energy draw, but capital expenditure rises when clients demand on-premise accelerators. Energy pricing volatility may slow adoption of compute-intensive generative applications in price-sensitive sectors until efficiency gains offset power bills.
Emerging Cross-Border AI Data Residency Mandates
The European Union AI Act requires high-risk systems that use citizen data to train or infer inside EU borders. China’s draft rules require foreign vendors to partner locally, and similar statutes are being advanced in Brazil and Indonesia. Compliance involves regional cloud points of presence, localized model retraining, and intricate audit trails, which can raise costs for global rollouts. Smaller providers may struggle to finance parallel infrastructure footprints, potentially foreshadowing consolidation or white-label alliances with local hosts.
*Our forecasts treat driver/restraint impacts as directional, not additive. The impact forecasts reflect baseline growth, mix effects, and variable interactions.
Segment Analysis
By Service Type: Integration Services Lead Market Transformation
Consulting and integration services accounted for 39.74% of 2024 revenue, as enterprises sought guidance on governance frameworks, architecture blueprints, and change management. Large multilayer programs required harmonizing legacy ERP, CRM, and data-lake assets with modern model-ops workflows, which elevated ticket sizes. Custom development remained vital for regulated verticals that reject one-size solutions.
Data-labeling specialists delivered domain-specific annotation that sharpened model precision, especially in medical imaging and autonomous driving datasets. The Applied AI Service market size attributable to inference and deployment is forecast to expand at a 26.78% CAGR, powered by tooling for canary releases, rollback automation, and real-time monitoring. Vendors that package reference pipelines for model versioning, drift alerting, and A/B routing shorten time to value and unlock recurring service revenue. The Applied AI Service market demonstrates a clear pivot from proof-of-concept engagement toward production resilience, where uptime, audit-ready logging, and optimization drive spending.


By Technology: Machine Learning Dominance Faces NLP Challenge
Machine-learning services accounted for 43.76% of 2024 revenue because predictive analytics, recommendation engines, and anomaly detection delivered tangible ROI in fraud prevention and supply-chain planning. Mature cross-industry libraries, automated feature engineering, and cloud-native notebook environments lower adoption hurdles. However, natural language processing services are projected to track a 26.64% CAGR through 2030, driven by enterprise chatbots, knowledge-base summarization, and contract analysis workflows.
Breakthroughs in transformer-based architectures and retrieval-augmented generation increase acceptance in customer support and back-office automation. The Applied AI Service market share differential may tighten as NLP solutions integrate retrieval governance, context windows expand, and instruction-fine-tuning lowers prompt engineering costs. Vendors bundling transfer learning, domain-specific ontologies, and post-deployment red-team services differentiate in this fast-growing sub-segment.
By Deployment Mode: Cloud Supremacy With Hybrid Growth
Cloud platforms captured 79.42% of the 2024 spend, as clients value elastic scaling and pay-as-you-go billing for experimentation. Major hyperscalers continue to roll out purpose-built inference chips that reduce the total cost of ownership and accelerate throughput, further entrenching their role in development cycles. Hybrid architectures, however, are posting a 25.74% CAGR because organizations must reconcile local data-residency clauses with the need for burst capacity.
The Applied AI Service market size tied to hybrid solutions benefits from new orchestration stacks that enable seamless movement of container-wrapped models between on-premise clusters and cloud nodes. Providers offering blueprint-driven reference architectures, zero-trust interconnects, and automated policy enforcement dominate contract shortlists. On-premise deployments persist in defense, healthcare, and ultra-low-latency manufacturing lines, but their share declines as cloud security certifications become more prevalent.
By End-User Industry: BFSI Leadership Challenged by Healthcare Surge
Banking, financial services, and insurance segments controlled 26.83% of 2024 revenue based on long-standing use cases in credit scoring, anti-money-laundering, and algorithmic trading. Mature regulatory sandboxes allow faster approvals, and quant-savvy teams accelerate adoption of bespoke models. However, healthcare and life sciences are projected to grow at a 26.89% CAGR through 2030, driven by FDA-approved diagnostic algorithms and AI-assisted protein design.
Hospitals enter into multi-year service agreements for radiology triage, clinical decision support, and patient flow optimization. The energy, utilities, transportation, and government sectors also amplify demand by implementing predictive maintenance, intelligent routing, and citizen-service chatbots. The Applied AI Service market thrives where domain regulators publish sandbox guidance, enabling providers to compartmentalize risk and accelerate proof of value.
By Organization Size: SME Acceleration Challenges, Enterprise Dominance
Large enterprises accounted for 62.19% of 2024 outlays, as complex, multi-business-unit transformations require extensive consulting and bespoke integration. They pursue horizontal data fabrics, model catalogs, and automated governance workflows to unlock scale economies across functions. Nevertheless, SMEs are expanding spend at a 25.47% CAGR, catalyzed by plug-and-play APIs, no-code model builders, and consumption-based billing.
Easy-to-embed embeddings, fine-tuning sandboxes, and marketplace models from vendors like Hugging Face enable lean teams to address targeted pain points. Providers catering to SMEs with packaged industry solutions, template data pipelines, and managed liability insurance will tap an under-penetrated growth pool. The Applied AI Service market demonstrates democratization as skill gaps narrow through the use of automated tooling and community-created best practices.
Geography Analysis
North America generated 38.97% of 2024 revenue, buoyed by venture-capital-funded innovation, deep cloud adoption, and well-defined governance frameworks. United States enterprises invested USD 67.2 billion in AI projects in 2024, while Canada focused on natural-resource analytics and fintech use cases. Federal executive orders encourage trustworthy AI without blanket restrictions, fostering experimentation. Extensive partner ecosystems among hyperscalers, boutique integrators, and open-source communities accelerate project timelines and reinforce regional dominance.
Asia-Pacific is forecast to deliver a 26.19% CAGR through 2030, underpinned by sovereign AI investments, public-sector procurement quotas, and expanding domestic cloud infrastructure. China’s emphasis on security reviews and algorithm registries catalyzes local service alliances. Japan’s Society 5.0 roadmap funds manufacturing AI testbeds, while India’s national strategy promotes healthcare diagnostics and agri-tech pilots. Regional customers often demand bilingual language models, lightweight edge inferencing, and localized compliance reporting, driving nuanced service opportunities.
Europe advances steadily as organizations balance innovation with stringent data protection laws. Germany focuses on industrial automation and predictive maintenance, whereas the United Kingdom scales AI-enabled fin-serv platforms. The AI Act’s risk-based taxonomy influences vendor roadmaps, positioning compliance consulting as a high-margin niche. France commits significant public funding to translational research that spins out service engagements in med-tech and climatetech. Middle East and African pilots focus on smart-city initiatives, while Latin America is increasingly deploying AI for precision agriculture and digital banking.

Competitive Landscape
The market exhibits moderate fragmentation because enterprises prefer best-of-breed specialists over monolithic suites. Tier-one technology players leverage proprietary orchestration platforms and large global workforces. Palantir focuses on defense, intelligence, and critical infrastructure analytics, securing multi-year federal contracts.
C3.ai aligns with industrial firms through pre-packaged predictive maintenance modules and has recently integrated Azure OpenAI models into its portfolio. Scale AI leverages high-quality data labeling and synthetic data generation to reduce training cycles in the automotive and retail segments. Niche providers differentiate themselves by vertical focus; for instance, H2O.ai offers explainable AI for banking and healthcare, while Appen targets medical imaging annotations.
Consolidation is expected as rising compliance costs, energy efficiency investments, and localization requirements strain small providers. Strategic alliances, venture funding inflows, and intellectual-property cross-licensing shape competitive boundaries as vendors race to embed outcome guarantees and governance toolkits.
Applied AI Service Industry Leaders
C3.ai, Inc.
Palantir Technologies Inc.
DataRobot, Inc.
H2O.ai, Inc.
Dataiku SAS
- *Disclaimer: Major Players sorted in no particular order

Recent Industry Developments
- October 2025: OpenAI and Roche formed a strategic alliance to co-develop foundation models for small-molecule drug discovery, establishing a multi-year joint research lab in Basel.
- July 2025: Scale AI launched a federated data-labeling platform that enables on-premise annotation for regulated sectors across Europe and Asia-Pacific, reducing data-transfer compliance costs.
- May 2025: C3.ai introduced Generative ERP Assist, embedding Azure OpenAI services within its manufacturing suite to automate production scheduling and supplier-risk analysis.
- March 2025: Palantir Technologies unveiled Apollo AI Control Plane v2.0, adding zero-trust model registry, automated compliance reporting, and real-time energy-usage telemetry for defense and critical-infrastructure clients.


Global Applied AI Service Market Report Scope
The Applied AI Service Market Report is Segmented by Service Type (Consulting and Integration, Managed Services, Custom Development, Data Labeling, Model Training, Inference and Deployment, Other Service Type), Technology (Machine Learning, Natural Language Processing, Computer Vision, Speech Recognition, Reinforcement Learning, Anomaly Detection), Deployment Mode (Cloud, On-Premises, Hybrid), End-User Industry (Banking Financial Services and Insurance, Healthcare and Life Sciences, Retail and E-Commerce, Manufacturing, Energy and Utilities, Transportation and Logistics, Government and Public Sector, Telecom and Media, Other End-User Industry), Organization Size (Large Enterprises, Small and Medium Enterprises), and Geography (North America, Europe, Asia-Pacific, Middle East and Africa, South America). The Market Forecasts are Provided in Terms of Value (USD), Based on Availability.
| Consulting and Integration |
| Managed Services |
| Custom Development |
| Data Labeling |
| Model Training |
| Inference and Deployment |
| Other Service Type |
| Machine Learning |
| Natural Language Processing |
| Computer Vision |
| Speech Recognition |
| Reinforcement Learning |
| Anomaly Detection |
| Cloud |
| On-Premises |
| Hybrid |
| Banking, Financial Services and Insurance (BFSI) |
| Healthcare and Life Sciences |
| Retail and E-Commerce |
| Manufacturing |
| Energy and Utilities |
| Transportation and Logistics |
| Government and Public Sector |
| Telecom and Media |
| Other End-User Industry |
| Large Enterprises |
| Small and Medium Enterprises (SMEs) |
| North America | United States | |
| Canada | ||
| Mexico | ||
| Europe | Germany | |
| United Kingdom | ||
| France | ||
| Russia | ||
| Rest of Europe | ||
| Asia-Pacific | China | |
| Japan | ||
| India | ||
| South Korea | ||
| Australia | ||
| Rest of Asia-Pacific | ||
| Middle East and Africa | Middle East | Saudi Arabia |
| United Arab Emirates | ||
| Rest of Middle East | ||
| Africa | South Africa | |
| Egypt | ||
| Rest of Africa | ||
| South America | Brazil | |
| Argentina | ||
| Rest of South America | ||
| By Service Type | Consulting and Integration | ||
| Managed Services | |||
| Custom Development | |||
| Data Labeling | |||
| Model Training | |||
| Inference and Deployment | |||
| Other Service Type | |||
| By Technology | Machine Learning | ||
| Natural Language Processing | |||
| Computer Vision | |||
| Speech Recognition | |||
| Reinforcement Learning | |||
| Anomaly Detection | |||
| By Deployment Mode | Cloud | ||
| On-Premises | |||
| Hybrid | |||
| By End-User Industry | Banking, Financial Services and Insurance (BFSI) | ||
| Healthcare and Life Sciences | |||
| Retail and E-Commerce | |||
| Manufacturing | |||
| Energy and Utilities | |||
| Transportation and Logistics | |||
| Government and Public Sector | |||
| Telecom and Media | |||
| Other End-User Industry | |||
| By Organization Size | Large Enterprises | ||
| Small and Medium Enterprises (SMEs) | |||
| By Geography | North America | United States | |
| Canada | |||
| Mexico | |||
| Europe | Germany | ||
| United Kingdom | |||
| France | |||
| Russia | |||
| Rest of Europe | |||
| Asia-Pacific | China | ||
| Japan | |||
| India | |||
| South Korea | |||
| Australia | |||
| Rest of Asia-Pacific | |||
| Middle East and Africa | Middle East | Saudi Arabia | |
| United Arab Emirates | |||
| Rest of Middle East | |||
| Africa | South Africa | ||
| Egypt | |||
| Rest of Africa | |||
| South America | Brazil | ||
| Argentina | |||
| Rest of South America | |||


Key Questions Answered in the Report
How large is the Applied AI Service market in 2025?
The market is valued at USD 330 million in 2025 and is forecast to hit USD 1.02 billion by 2030.
Which service type owns the biggest revenue slice?
Consulting and integration services lead with 39.74% of 2024 revenue thanks to demand for strategy and multi-cloud orchestration support.
What segment of the Applied AI Service market is growing fastest?
Inference and deployment services are projected to expand at 26.78% CAGR as enterprises shift models from labs to production.
Which region shows the highest growth outlook?
Asia-Pacific carries the fastest 26.19% CAGR through 2030, backed by sovereign AI policies and expanding local cloud capacity.
Why are hybrid deployments gaining traction?
Hybrid models balance cloud scalability with data-sovereignty mandates, attracting industries that must keep sensitive data on premises while using cloud resources for training.
Which vertical is projected to grow quickest?
Healthcare and life sciences demonstrate a 26.89% CAGR aided by regulatory approvals for AI-enabled diagnostics and accelerated drug-discovery programs.
Page last updated on:


