
AI Oncology Vibe CT Scanners Market Size and Share
Market Overview
| Study Period | 2020 - 2031 |
|---|---|
| Market Size (2026) | USD 1.05 Billion |
| Market Size (2031) | USD 2.92 Billion |
| Growth Rate (2026 - 2031) | 22.70 % |
| Fastest Growing Market | Asia-Pacific |
| Largest Market | North America |
| Market Concentration | Medium |
Major Players *Disclaimer: Major Players sorted in no particular order Image © Mordor Intelligence. Reuse requires attribution under CC BY 4.0. | |
AI Oncology Vibe CT Scanners Market Analysis by Mordor Intelligence
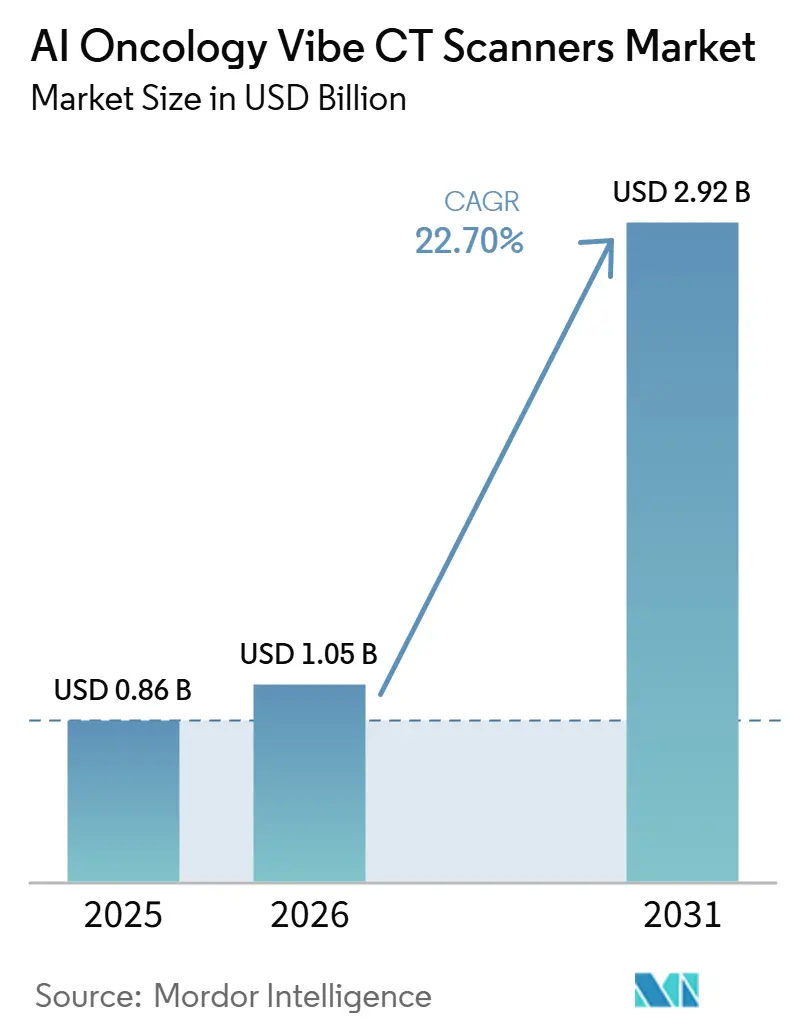
The AI Oncology Vibe CT Scanners Market size is projected to expand from USD 0.86 billion in 2025 and USD 1.05 billion in 2026 to USD 2.92 billion by 2031, registering a CAGR of 22.70% between 2026 to 2031.
Rising cancer incidence continues to set the base level of demand because CT remains central to tumor staging, treatment planning, and follow-up imaging across major solid tumor pathways. The widening gap in diagnostic capacity between high-income and low-income systems is also pushing procurement toward advanced platforms that can deliver more output from each imaging session. The AI oncology vibe CT scanners market is also moving toward detector-based spectral and photon-counting platforms because hospitals increasingly want better lesion characterization, lower dose pathways, and stronger quantitative imaging support in one system. Competitive strategy is now shaped by a mix of hardware launches, software ecosystem expansion, and long-term health system partnerships, while capital cost and integration complexity continue to slow full replacement cycles in parts of the installed base. The AI oncology vibe CT scanners market, therefore, presents the strongest near-term opportunity where vendors can combine premium imaging performance with workflow gains, vendor-neutral software deployment, and financing models that widen adoption beyond top-tier hospitals.
Key Report Takeaways
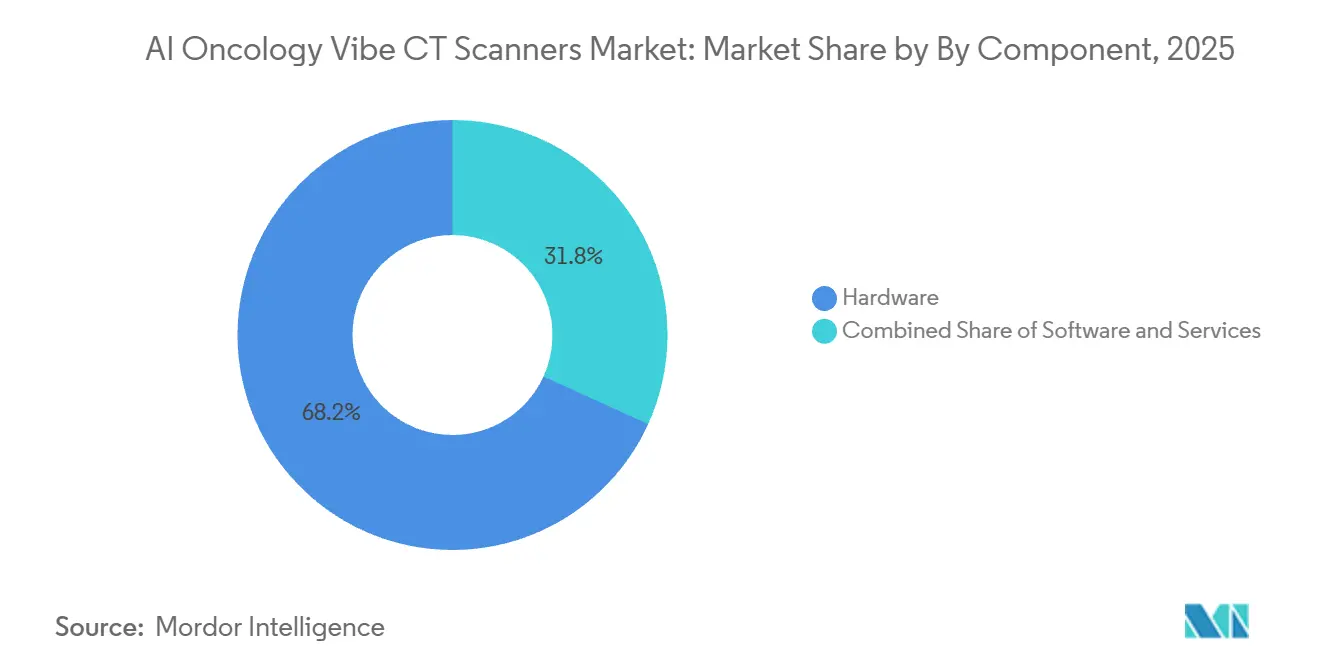
By component, hardware held 68.2% of the AI oncology vibe CT scanners market size in 2025, while software is projected to expand at a 23.2% CAGR through 2031.
By deployment mode, conventional AI-enhanced CT accounted for 58.2% of the AI oncology vibe CT scanners market share in 2025, while photon-counting CT is forecast to grow at a 23.8% CAGR through 2031.
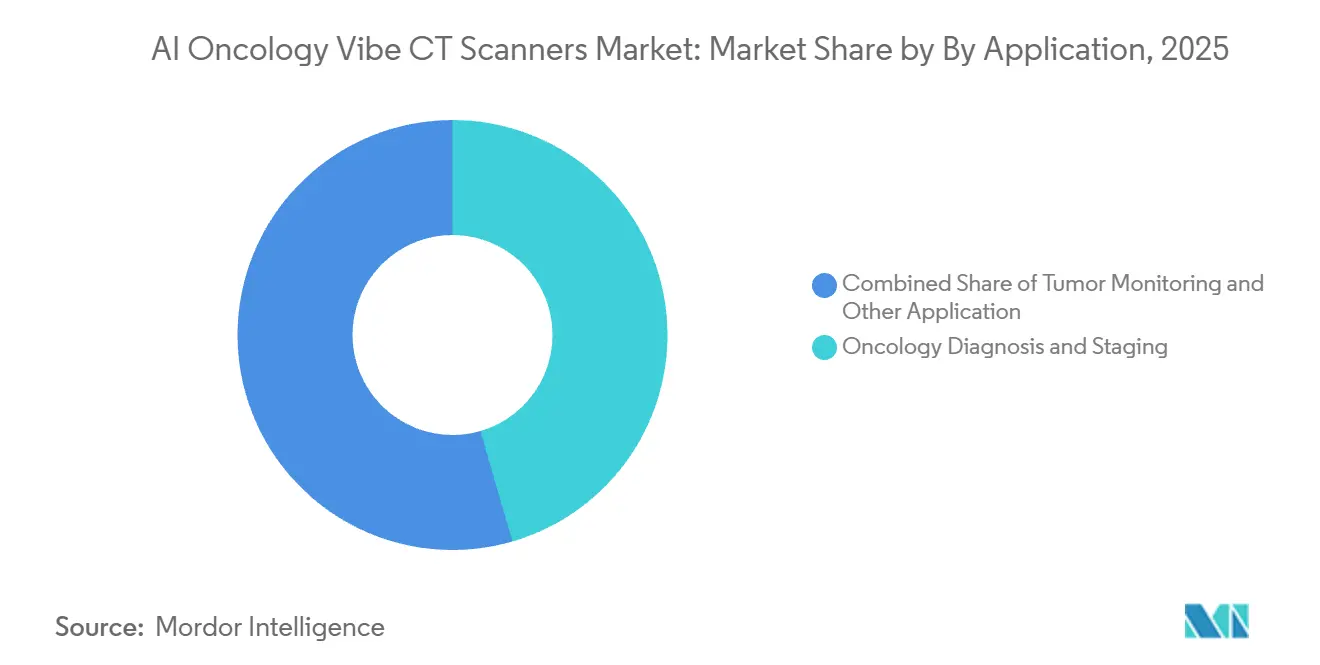
By application, oncology diagnosis and staging captured 45.5% of the AI oncology vibe CT scanners market size in 2025, while tumor monitoring and treatment response is projected to advance at a 24.1% CAGR through 2031.
By end user, hospitals held 45.5% of revenue in 2025, while cancer treatment centers are expected to record the fastest growth at a 23.6% CAGR through 2031.
By geography, North America led with 39.4% share in 2025, while Asia Pacific is expected to expand at a 24.2% CAGR through 2031.
Note: Market size and forecast figures in this report are generated using Mordor Intelligence’s proprietary estimation framework, updated with the latest available data and insights as of January 2026.
Market Trends and Insights
Drivers Impact Analysis of AI Oncology Vibe CT Scanners Market*
| Driver | (~) % Impact on CAGR Forecast | Geographic Relevance | Impact Timeline |
|---|---|---|---|
| Rising Oncology Imaging Demand | +4.5% | Global | Short term (≤ 2 years) |
| AI-Assisted Protocol Optimization | +3.8% | Global, North America and Europe lead | Medium term (2-4 years) |
| Photon-Counting And Spectral Precision Gains | +3.2% | North America and Europe, early-adopter APAC | Long term (≥ 4 years) |
| Radiation Dose Reduction Pressure | +2.5% | Global | Medium term (2-4 years) |
| Oncology Workflow Automation And Triage | +2.3% | North America and APAC core | Medium term (2-4 years) |
| Reimbursement Support For Quantitative Imaging | +1.8% | North America, spillover to Europe | Short term (≤ 2 years) to Medium term (2-4 years) |
| Source: Mordor Intelligence | |||
Rising Oncology Imaging Demand: Global Cancer Incidence Sets the Baseline
The AI oncology vibe CT scanners market is being lifted by the sheer scale of global cancer incidence. GLOBOCAN 2024[1] reported 20.6 million new cancer diagnoses and 9.8 million cancer deaths worldwide, and the same release projected incidence to reach 34.4 million cases by 2050. Lung cancer remained the highest-incidence cancer with 2.6 million new cases and the leading cause of cancer mortality with 1.9 million deaths, which reinforces CT use across initial diagnosis, staging, and follow-up care. The Lancet Oncology also projected diagnosed cancer incidence to rise from 13.58 million cases in 2025 to 19.32 million cases by 2050, with the largest burden growth expected in lower-resource settings. In the United States alone, the National Cancer Institute estimated 2.04 million new cancer cases in 2025, which supports continued imaging investment even when hospital capital budgets remain tight. This pattern means the AI oncology vibe CT scanners market is not only expanding in premium hospitals, but is also drawing more demand for capable mid-tier systems in countries that need oncology-grade image quality at more practical procurement levels.
AI Assisted Protocol Optimization: Closing the Radiologist Productivity Gap
The AI oncology vibe CT scanners market is also gaining from tools that reduce the workload on radiologists and imaging teams. The World Health Organization reported acute workforce shortages in 70% of low- and middle-income countries, which makes automation in scan selection, reconstruction, and reporting more valuable in day-to-day oncology imaging. In November 2025, Mosaic Clinical Technologies[2] said early reader studies tied to its Cognita Imaging acquisition showed up to 52% higher cancer detection, up to 4 times fewer significant diagnostic errors, and up to 76% lower radiologist read time with AI-radiologist collaboration. United Imaging Intelligence presented its uAI Insight Image-to-Report agent at ECR 2026 and said it could detect up to 73 thoracic findings from a single chest CT scan while generating a structured preliminary report automatically. As a result, the AI oncology vibe CT scanners market is increasingly being evaluated not only on image quality, but also on whether a platform can help facilities recruit, retain, and support radiologists in a tight labor environment. That shift gives vendors with integrated workflow tools a stronger position in procurement discussions than vendors offering imaging gains alone.
Photon Counting and Spectral Precision Gains: Detector Physics Rewrites Oncology Staging
The AI oncology vibe CT scanners market is moving into a new performance cycle as photon-counting and spectral systems show clinical advantages over conventional detector designs. Research published in Insights into Imaging in 2025 stated that photon-counting detector CT offers ultra-high spatial resolution, better contrast-to-noise performance, and intrinsic spectral data for tissue characterization and quantitative imaging. A 2025 head-to-head study in the Journal of Computer Assisted Tomography found that photon-counting CT used less intravenous contrast while still delivering equivalent or better diagnostic confidence for peritoneal malignancy assessment. In thoracic oncology, a 2025 study in Radiologia reported equivalent or better image quality than second-generation dual-source DECT while reducing radiation dose by 43% in oncology patients. Philips received FDA 510(k) clearance for Verida in April 2026 and said the system reconstructs 145 images per second and supports up to 270 exams daily, which shows that the AI oncology vibe CT scanners market is rewarding platforms that pair clinical precision with throughput gains. That combination is important because centers do not want to choose between better tumor characterization and usable daily scanner economics.
Radiation Dose Reduction Pressure: ALARA Standards Drive AI Reconstruction Adoption
The AI oncology vibe CT scanners market is also being shaped by stronger pressure to cut dose exposure without giving up diagnostic quality. A 2025 systematic review in Applied Sciences found that deep learning image reconstruction reduced dose by 34% to 89%, with a mean reduction near 58%, compared with iterative reconstruction while maintaining or improving image quality. In pediatric musculoskeletal malignancy, a 2025 study in the European Journal of Radiology Open reported effective dose reductions of 87% to 93% for photon-counting CT versus conventional energy-integrating detector CT without harming pulmonary metastasis detection. Another 2025 study in Scientific Reports found that deep learning reconstruction paired with a silver filter reduced radiation dose while keeping image quality non-inferior in abdominopelvic oncology imaging. Subtle Medical received FDA clearance in June 2026 for SubtleHD(CT) and said the software is deployed across more than 1,300 scanners globally, which shows that lower-dose AI tools are spreading even across older scanner fleets. This matters because the AI oncology vibe CT scanners market is now being influenced by compliance-minded buyers who treat dose optimization as a routine procurement requirement rather than a premium add-on.
Oncology Workflow Automation and Triage: Faster Throughput Becomes a Buying Criterion
The AI oncology vibe CT scanners market is benefiting from workflow automation because oncology imaging often involves repeated exams, complex follow-up, and high reporting urgency. Platforms that automate report drafting, triage support, structured outputs, and quantitative measurements can reduce delays between scan acquisition and treatment decisions. The Image-to-Report model introduced by United Imaging Intelligence in 2026 reflects this direction by combining finding detection with structured reporting from a single CT workflow. Philips also positioned Verida as a system that supports high daily exam volume, which shows that vendors now market oncology CT platforms on operational efficiency as much as imaging performance. As a result, the AI oncology vibe CT scanners market is giving more weight to solutions that shorten scan-to-decision time inside busy cancer programs. This is especially relevant in centers where imaging, radiation planning, and treatment response review need to move in tighter coordination.
Reimbursement Support for Quantitative Imaging: Documentation Value Moves Closer to Revenue Value
The AI oncology vibe CT scanners market is also being helped by the fact that structured and quantitative imaging outputs fit better with payer and compliance expectations. Tumor monitoring is gaining speed because oncologists and payers increasingly want measurable evidence of treatment response rather than anatomy alone. Scientific work in 2026 showed that thoracic photon-counting CT could identify complete treatment response and track T-stage changes, iodine uptake, and lymph node involvement in breast cancer patients within one examination. That kind of output supports the broader shift toward imaging that is easier to compare across visits and therapies. The AI oncology vibe CT scanners market therefore gains when vendors can turn advanced image data into standardized measurements that fit routine review and documentation workflows. This driver is smaller than core demand and dose reduction, but it still supports higher value placement of AI-enabled systems in oncology care pathways.
Restraints Impact Analysis of AI Oncology Vibe CT Scanners Market*
| Restraint | (~) % Impact on CAGR Forecast | Geographic Relevance | Impact Timeline |
|---|---|---|---|
| High Capital Cost Of Premium CT Platforms | -2.8% | Global, disproportionate in APAC, LATAM and MEA | Long term (≥ 4 years) |
| Integration Burden Across PACS, RIS, And EHR Environments | -2.0% | Global | Medium term (2-4 years) |
| Clinical Validation And Regulatory Friction For AI Features | -1.5% | North America and Europe | Medium term (2-4 years) |
| Cybersecurity And Data Governance Concerns | -0.8% | Global | Medium term (2-4 years) to Long term (≥ 4 years) |
| Source: Mordor Intelligence | |||
High Capital Cost of Premium CT Platforms: Capex Thresholds Limit Mid-Market Penetration
The AI oncology vibe CT scanners market still faces a clear capital barrier at the premium end. The draft indicates that premium photon-counting CT installations often exceed USD 3 million, which places them beyond the normal procurement range of many district hospitals and independent imaging centers. This burden is heavier in public systems that prioritize imaging volume and broad access over advanced platform capability. It also creates a two-tier pattern where large, well-funded institutions move faster into full platform replacement while many mid-tier sites continue upgrading existing scanners with software. In practice, this means the AI oncology vibe CT scanners market does not convert all technology interest into immediate hardware revenue. It also explains why software deployment can expand more quickly than complete scanner replacement in several countries.
Integration Burden Across PACS, RIS, and EHR Environments: Where AI Features Stall in Practice
The AI oncology vibe CT scanners market is also slowed by the practical difficulty of connecting CT-based AI tools with existing clinical systems. A 2025 joint white paper from the American College of Radiology and the Society for Imaging Informatics in Medicine described cybersecurity and interoperability risks tied to variable DICOM protocols and proprietary PACS architectures. Oncology AI features such as radiomics extraction, quantitative reporting, and automated staging need dependable links to PACS, RIS, and EHR environments, and those links vary widely by institution. When HL7, FHIR, and DICOM workflows do not align well, deployment delays can come even after hardware is installed. The AI oncology vibe CT scanners market therefore depends not only on scanner performance, but also on how smoothly vendors can fit into existing hospital IT environments. This friction is one reason why promised AI value often arrives later than the scanner itself.
*Our forecasts treat driver/restraint impacts as directional, not additive. The impact forecasts reflect baseline growth, mix effects, and variable interactions.
AI Oncology Vibe CT Scanners Market Segment Analysis
By Component:
Hardware Infrastructure Leads, Software Monetization AcceleratesHardware held 68.2% of the AI oncology vibe CT scanners market in 2025, which reflects the capital-intensive nature of detector assemblies, X-ray tube systems, gantries, and workstations in premium oncology imaging setups. This large base also reflects the need for physical replacement as photon-counting systems start to displace older energy-integrating installations in tertiary and academic settings. In the AI oncology vibe CT scanners industry, hardware still anchors vendor revenue because high-end hospitals continue to invest in systems that support better lesion characterization and stronger quantitative output. Services remain important because long-term maintenance, managed imaging agreements, and remote support create recurring income tied to the installed base. The draft also notes that Siemens Healthineers has used Value Partnership models to position lifecycle management as part of the sales offer, which shows that service depth can influence large account retention.
Software is the fastest-growing component at a 23.2% CAGR through 2031, which makes it the most dynamic profit pool within the AI oncology vibe CT scanners market. This growth is being supported by AI reconstruction tools, quantitative imaging analytics, and cloud-enabled workflow platforms that can be sold to both new and existing CT users. The strategic value is clear because vendor-neutral software can extend across mixed scanner fleets without waiting for full system replacement. United Imaging Intelligence said its uAI Clinical Portal now includes more than 60 AI applications across oncology, neuroradiology, and cardiovascular imaging, which illustrates how vendors are broadening the software layer around imaging hardware. Subtle Medical[3]also showed the commercial path for vendor-neutral deployment when it announced FDA-cleared CT image enhancement software across more than 1,300 scanners worldwide. In the AI oncology vibe CT scanners industry, that pattern widens addressable demand because software can monetize installed systems that are not ready for premium hardware replacement yet.

By Deployment Mode:
Photon-Counting CT's Clinical Validation Disrupts Installed-Base EconomicsConventional AI-enhanced CT held 58.2% of the AI oncology vibe CT scanners market share in 2025, showing that the installed base of upgraded energy-integrating detector systems still defines current deployment volume. That share does not indicate weak interest in newer systems. It reflects the long replacement cycle that shapes CT purchasing across hospitals and imaging centers. Spectral CT and interventional CT continue to serve important but narrower roles in tissue characterization, treatment monitoring, biopsies, and other targeted oncology workflows. In the AI oncology vibe CT scanners market, conventional AI-enhanced CT remains the practical bridge between current installed assets and the next detector cycle.
Photon-counting CT is the fastest-growing deployment mode at a 23.8% CAGR through 2031, and this part of the AI oncology vibe CT scanners market is advancing because clinical evidence and regulatory support are now moving in the same direction. Research published in Insights into Imaging in 2025 described strong advantages across thoracic, abdominal, and musculoskeletal oncology, including better lesion visibility and lower contrast needs. GE HealthCare[4] received FDA clearance for Photonova Spectra in March 2026 and said the system processes up to 50 times more data than conventional CT through its Deep Silicon detector and 8-bin energy resolution design. Philips received FDA clearance for Verida in April 2026 and positioned it as the first AI-powered detector-based spectral CT, adding further weight to the premium shift. These launches matter because they push the AI oncology vibe CT scanners market toward systems that can support both better oncology imaging and stronger software monetization over time.
By Application:
Tumor Monitoring Emerges as the Fastest-Growing Clinical Use CaseOncology diagnosis and staging held 45.5% of the AI oncology vibe CT scanners market size in 2025, which confirms CT's central place in the solid tumor care pathway. Lung, colorectal, and breast cancers remain high-volume cases where CT is heavily used for first-line staging and follow-up assessment IARC.WHO.INT. This dominant share is supported by the daily reality that clinicians need fast, repeatable imaging for tumor burden assessment across large patient flows. Radiation therapy planning is also becoming more important as diagnostic CT and treatment planning CT move closer together in integrated oncology workflows. Research and clinical trials remain smaller by volume, but they often act as early validation settings for new photon-counting and AI-spectral capabilities before broader rollout.
Tumor monitoring and treatment response is projected to grow at a 24.1% CAGR through 2031, making it the fastest-moving application in the AI oncology vibe CT scanners market. This rise is closely tied to targeted therapies and immunotherapy protocols that require clearer quantitative evidence of efficacy across treatment cycles. A 2026 study in Scientific Reports showed that thoracic photon-counting CT in prone position could identify complete treatment response and evaluate T-stage changes, iodine uptake, and lymph node involvement in breast cancer patients receiving neoadjuvant therapy . That capability shifts more value toward tools that generate iodine maps, volumetric measurements, and radiomics-style data within routine scanning. In the AI oncology vibe CT scanners market, this makes recurring software value more important because ongoing response assessment often depends on more than standard anatomical image review. It also gives vendors a stronger reason to bundle analytics and reporting layers with hardware placements.
By End User:
Cancer Treatment Centers Lead Growth, Hospitals Anchor Market VolumeHospitals held 45.5% share of the AI oncology vibe CT scanners market in 2025, which keeps them as the main procurement channel for premium CT systems. Large health systems remain the most capable buyers because they can spread scanner utilization across oncology, emergency, neurology, and cardiovascular service lines. They are also more likely to adopt long-term partnership models that combine hardware, software, and service over several years. Prisma Health expanded its Value Partnership with Siemens Healthineers in 2025 through a USD 50 million investment to advance cancer care and integrate next-generation CT with radiation oncology systems. Diagnostic imaging centers remain relevant because high-volume operations can benefit quickly from AI-driven workflow acceleration even when they do not replace entire fleets at once.
Cancer treatment centers are projected to grow at a 23.6% CAGR through 2031, and this is one of the clearest demand pockets in the AI oncology vibe CT scanners market. These facilities can justify imaging investment more directly because staging, planning, and response assessment often sit inside the same patient pathway. That operating model gives them clearer returns on premium systems that support radiation planning, structured oncology review, and frequent follow-up scans. The segment also benefits from the broader move toward integrated diagnosis and therapy platforms. In the AI oncology vibe CT scanners market, specialized oncology centers are therefore becoming a faster-growth buyer group than general hospitals even though hospitals still hold the largest revenue base. This shift will matter for vendors that tailor commercial offers to end-to-end cancer workflows rather than to general imaging alone.
Geography Analysis
North America AI Oncology Vibe CT Scanners Market
North America held 39.4% share of the AI oncology vibe CT scanners market in 2025, which made it the largest regional base. The United States drives most of that demand through academic medical centers, community hospitals, and comprehensive cancer centers working within established reimbursement and capital planning structures. The National Cancer Institute estimated 2.04 million new cancer cases in the United States in 2025, and that case load continues to support strong imaging volumes. The region also saw dense regulatory activity between late 2025 and mid-2026, including major CT clearances tied to Philips Verida, GE HealthCare Photonova Spectra, Canon Medical Alphenix 4D CT, and Subtle Medical SubtleHD(CT) . Canada remains a steady procurement market through provincial modernization programs, while Mexico continues to offer room for growth in private hospital imaging.
Europe AI Oncology Vibe CT Scanners Market
Europe remains a strategically important part of the AI oncology vibe CT scanners market because centralized procurement, academic imaging leadership, and service-driven tenders shape vendor performance there. Germany, the United Kingdom, France, Italy, and Spain remain the main buying centers, and tender structures often favor suppliers with broad service networks and long support histories. United Imaging Healthcare said its Europe revenue rose nearly 50% in 2025 and that it secured CE certification for its RT systems under the EU MDR framework in early 2026, showing that Asian challengers are gaining traction beyond price competition alone. GE HealthCare also strengthened its imaging software position through the announced USD 2.3 billion Intelerad acquisition, while GDPR-related data governance expectations continue to add complexity to AI feature activation across multi-site health systems.
APAC, MEA and South America AI Oncology Vibe CT Scanners Market
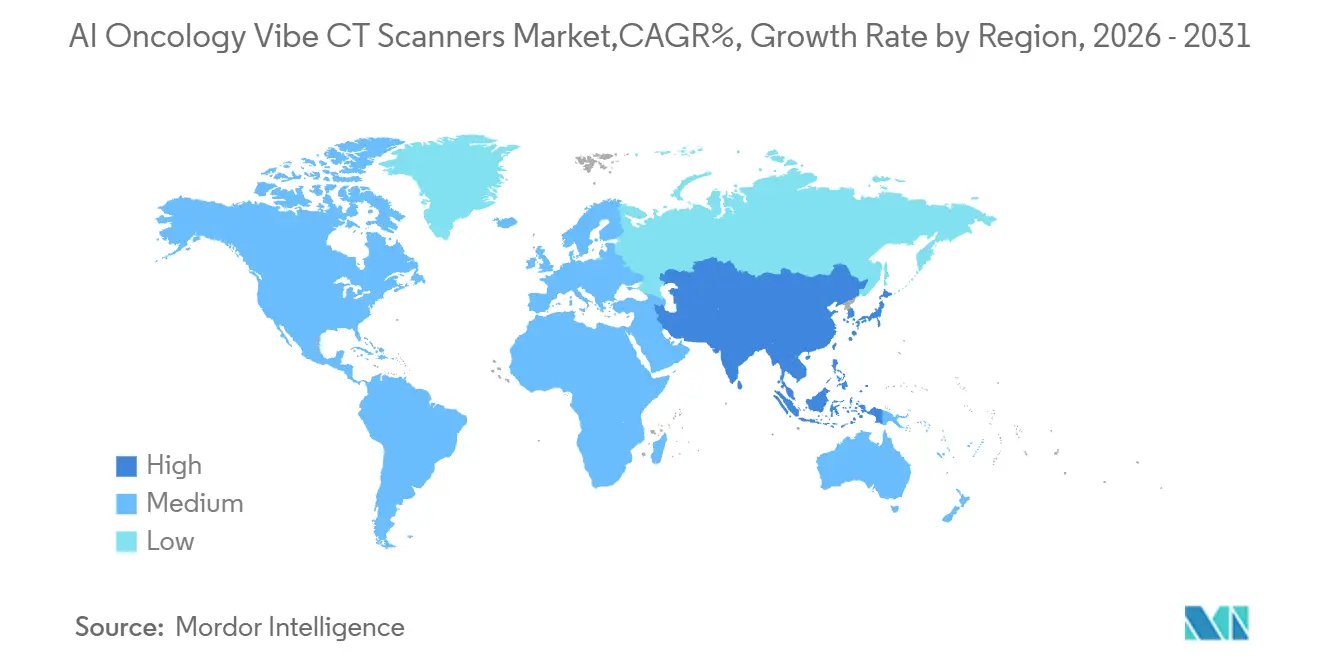
Asia Pacific is projected to grow at a 24.2% CAGR through 2031, which makes it the fastest-growing region in the AI oncology vibe CT scanners market. Growth across the region comes from a mix of hospital expansion, rising oncology demand, and faster commercialization of AI-enabled CT platforms in large national markets. China remains important because county-level hospital expansion supports volume demand, while local regulatory momentum encourages product strategies that align more closely with domestic AI capabilities. United Imaging Healthcare said Asia Pacific revenue grew more than 40% in 2025, which shows how strongly regional suppliers are scaling in their home markets and nearby export markets. Middle East and Africa and South America remain smaller in total size, but the draft still points to solid momentum from expanding public investment in diagnostic infrastructure and rising new orders in selected emerging markets.
Competitive Landscape
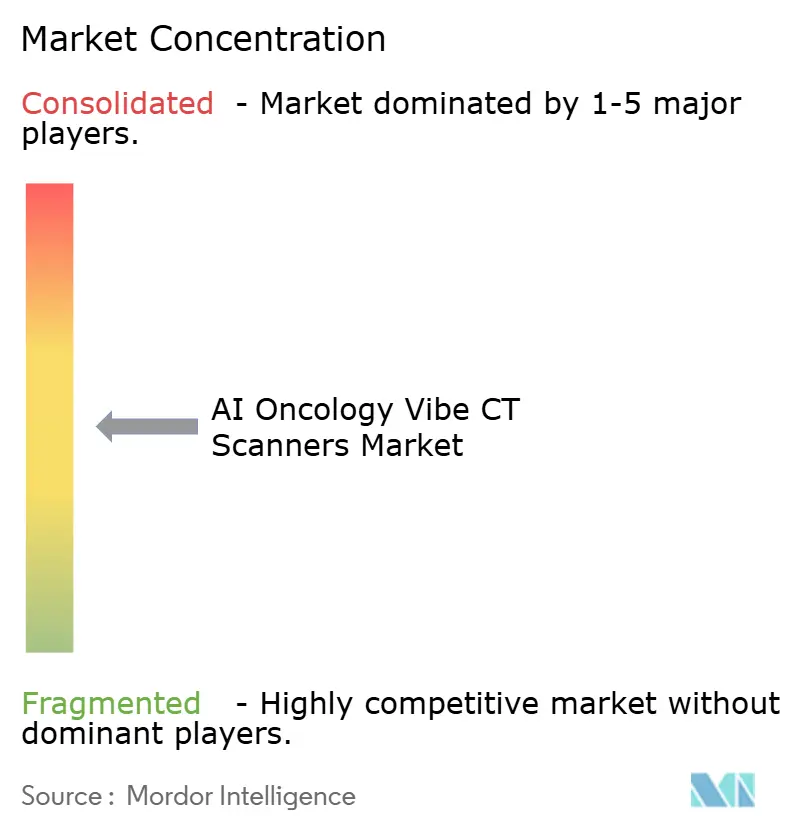
The AI oncology vibe CT scanners market remains semi-consolidated at the premium tier, with GE HealthCare, Siemens Healthineers, and Koninklijke Philips holding the strongest installed-base positions. Their advantage comes from broad hospital relationships, deep service capacity, and the ability to link CT platforms with wider oncology or enterprise imaging portfolios. In the AI oncology vibe CT scanners market, the next hardware cycle is being shaped by detector-based differentiation, workflow integration, and software expansion rather than by image quality claims alone. Philips strengthened its premium position in April 2026 when it received FDA 510(k) clearance for Verida, which it described as the first AI-powered detector-based spectral CT. GE HealthCare advanced its detector-led strategy in March 2026 through Photonova Spectra, centered on proprietary Deep Silicon technology and higher data throughput for oncology workflows.
The AI oncology vibe CT scanners market is also seeing more emphasis on integrated software ecosystems that can drive recurring revenue after hardware placement. GE HealthCare's announced USD 2.3 billion acquisition of Intelerad in November 2025 shows a clear move toward cloud-enabled enterprise imaging and stronger control of the software environment around radiology workflows. Siemens Healthineers has taken a different route by deepening account relationships through long-term partnerships and closer coordination between CT and radiation oncology assets, as shown by the expanded Prisma Health investment in 2025. Subtle Medical represents another important competitive model because vendor-neutral AI image enhancement can capture value from existing fleets without waiting for full scanner replacement. That approach matters because a large part of the AI oncology vibe CT scanners market still operates on conventional installed hardware that can accept software upgrades sooner than new system purchases.
Mid-tier challengers are adding pressure in the AI oncology vibe CT scanners market, especially in Asia Pacific and other cost-sensitive regions. United Imaging Healthcare reported 2025 revenue of RMB 13.8 billion, which was equivalent to USD 1.9 billion at the cited exchange rate, and it said R&D spending reached RMB 2.6 billion, or USD 364 million. Canon Medical also signaled intent in interventional oncology imaging when it secured FDA 510(k) clearance for Alphenix 4D CT with Aquilion ONE/INSIGHT Edition in November 2025. The AI oncology vibe CT scanners market is therefore competitive enough to reward innovation, but not fragmented enough to dilute the strategic advantage of large installed bases, regulatory experience, and service reach.
AI Oncology Vibe CT Scanners Industry Leaders
-
GE HealthCare
-
Siemens Healthineers
-
Koninklijke Philips N.V.
-
Medtronic plc
-
Hologic, Inc.
- *Disclaimer: Major Players sorted in no particular order
AI Oncology Vibe CT Scanners Market Companies Covered in this Report
- Alphabet Inc. (Google Health / DeepMind)
- Microsoft
- NVIDIA
- Siemens Healthineers
- GE HealthCare Technologies Inc.
- Koninklijke Philips
- Roche
- Tempus AI, Inc.
- Aidoc Medical Ltd.
- Qure.ai Technologies Private Limited
- Heartflow
- PathAI, Inc.
- Paige.AI, Inc.
- Ada Health GmbH
- AliveCor
- Butterfly Network, Inc.
- Digital Diagnostics
- Lunit
- Ibex Medical Analytics Ltd.
Recent Industry Developments in AI Oncology Vibe CT Scanners Market
- June 2026: Subtle Medical received FDA clearance for SubtleHD(CT), an AI-powered image enhancement solution for CT imaging, the company's 11th FDA-cleared product, and the platform is deployed across 1,300+ scanners globally
- April 2026: Koninklijke Philips received FDA 510(k) clearance for Spectral CT Verida, the world's first AI-powered detector-based spectral CT, which reconstructs 145 images per second and enables up to 270 exams daily
- March 2026: United Imaging Intelligence debuted its uAI Insight Image-to-Report AI agent at ECR 2026, with support for up to 73 thoracic and 47 neurological findings from a single CT scan and automated structured preliminary reports
- November 2025: GE HealthCare announced the acquisition of Intelerad for USD 2.3 billion to expand cloud-enabled enterprise imaging and help triple cloud-enabled product offerings by 2028
Global AI Oncology Vibe CT Scanners Market Report Scope
Segmentation Overview
| Hardware |
| Software |
| Services |
| Conventional AI-Enhanced CT |
| Spectral CT |
| Photon-Counting CT |
| Interventional CT |
| Oncology Diagnosis and Staging |
| Tumor Monitoring and Treatment Response |
| Radiation Therapy Planning Support |
| Research and Clinical Trials |
| Hospitals |
| Diagnostic Imaging Centers |
| Cancer Treatment Centers |
| Academic and Research Institutes |
| North America | United States |
| Canada | |
| Mexico | |
| Europe | Germany |
| United Kingdom | |
| France | |
| Italy | |
| Spain | |
| Rest of Europe | |
| Asia-Pacific | China |
| India | |
| Japan | |
| South Korea | |
| Australia | |
| Rest of Asia-Pacific | |
| Middle East & Africa | GCC |
| South Africa | |
| Rest of Middle East and Africa | |
| South America | Brazil |
| Argentina | |
| Rest of South America |
| By Component | Hardware | |
| Software | ||
| Services | ||
| By Deployment Mode | Conventional AI-Enhanced CT | |
| Spectral CT | ||
| Photon-Counting CT | ||
| Interventional CT | ||
| By Application | Oncology Diagnosis and Staging | |
| Tumor Monitoring and Treatment Response | ||
| Radiation Therapy Planning Support | ||
| Research and Clinical Trials | ||
| By End User | Hospitals | |
| Diagnostic Imaging Centers | ||
| Cancer Treatment Centers | ||
| Academic and Research Institutes | ||
| By Geography | North America | United States |
| Canada | ||
| Mexico | ||
| Europe | Germany | |
| United Kingdom | ||
| France | ||
| Italy | ||
| Spain | ||
| Rest of Europe | ||
| Asia-Pacific | China | |
| India | ||
| Japan | ||
| South Korea | ||
| Australia | ||
| Rest of Asia-Pacific | ||
| Middle East & Africa | GCC | |
| South Africa | ||
| Rest of Middle East and Africa | ||
| South America | Brazil | |
| Argentina | ||
| Rest of South America | ||
Key Questions Answered in the Report
What is the 2026 value of the AI oncology vibe CT scanners market?
The AI oncology vibe CT scanners market stands at USD 2.92 billion in 2026 and is forecast to reach USD 10.4 billion by 2031 at an 22.7% CAGR.
Which component leads revenue in AI oncology vibe CT scanners market?
Hardware component segment leads with 68.2% share in 2025.
Why are hospitals adopting AI oncology vibe CT scanners market faster now?
Hospitals want faster triage, lower reporting burden, and smoother workflow automation, especially in imaging and high-volume diagnostic settings.
Which deployment model is growing the fastest?
Conventional AI-enhanced CT deployment model leads with 58.2% share in 2025.
Which region is growing the fastest for AI oncology vibe CT scanners market?
Asia Pacific records the fastest regional CAGR at 24.2% through 2031, supported by policy action, local vendors, and unmet diagnostic demand.
What is the main risk slowing commercial rollout?
Explainability, liability, privacy rules, and integration cost remain the main barriers because they can delay procurement and raise implementation complexity.