AI In Evidence Access And Networks Market Size and Share
Market Overview
| Study Period | 2020 - 2031 |
|---|---|
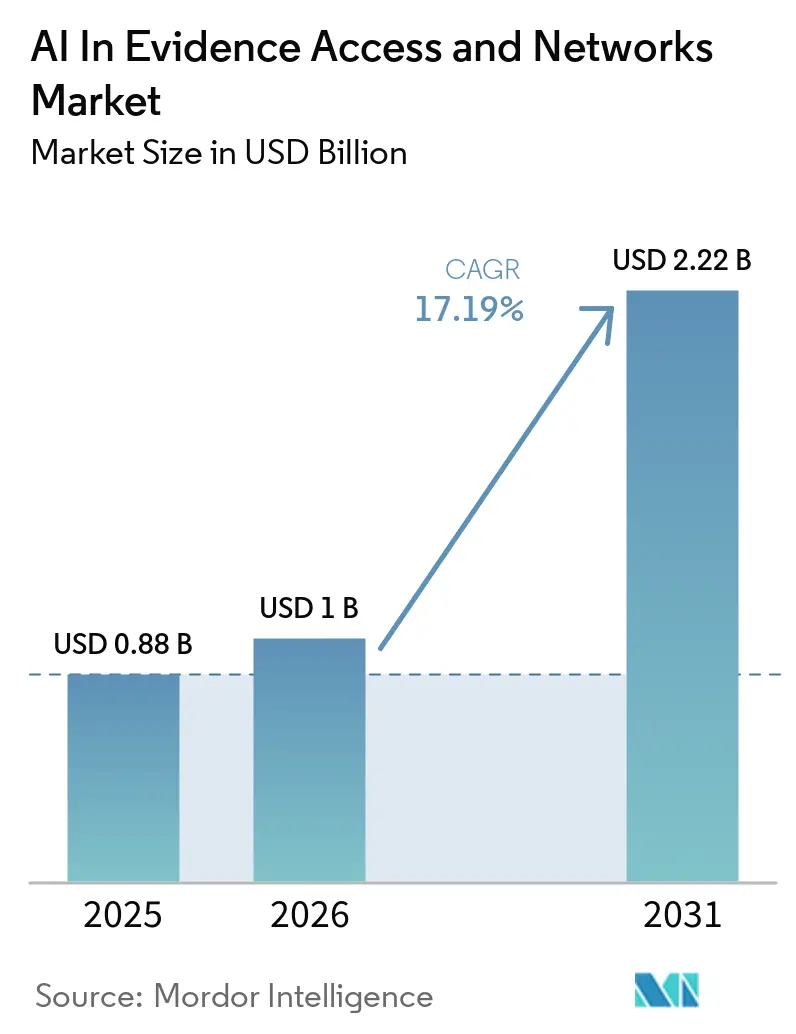
| Market Size (2026) | USD 1 Billion |
| Market Size (2031) | USD 2.22 Billion |
| Growth Rate (2026 - 2031) | 17.19% CAGR |
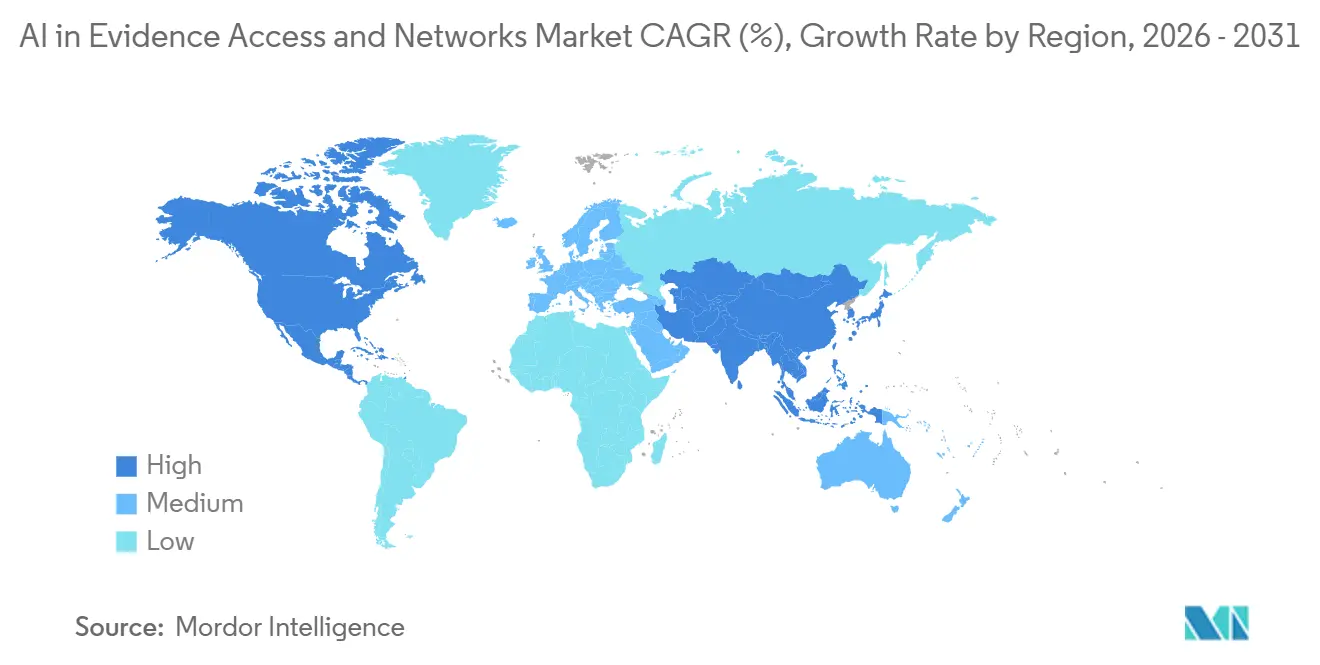
| Fastest Growing Market | Asia-Pacific |
| Largest Market | North America |
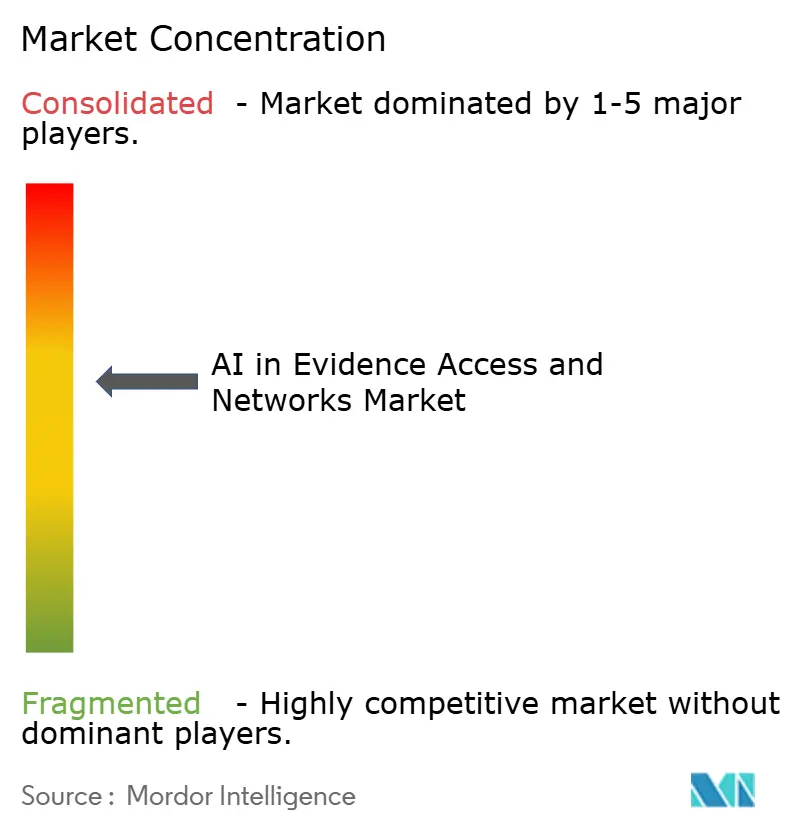
| Market Concentration | Medium |
Major Players *Disclaimer: Major Players sorted in no particular order Image © Mordor Intelligence. Reuse requires attribution under CC BY 4.0. | |
AI In Evidence Access And Networks Market Analysis by Mordor Intelligence
The AI in evidence access and networks market size is projected to expand from USD 0.88 billion in 2025 to USD 1.00 billion in 2026 and is expected to reach USD 2.22 billion by 2031, with the CAGR over 2026–2031 projected to be 17.19%. The surge reflects converging regulatory mandates, exponential data creation and sponsor urgency to translate raw records into actionable insights. Regulators on both sides of the Atlantic formalized real-world evidence (RWE) frameworks, prompting sponsors to invest in harmonized data fabrics that can ingest electronic health records, claims files, genomic profiles and wearable telemetry. Platform providers differentiate through privacy-preserving tokenization, while service specialists design causal-inference models that satisfy transparency rules. The AI in evidence access and networks market now benefits from value-based reimbursement, decentralized clinical trials and government interoperability pledges that collectively widen the buyer pool.
Key Report Takeaways
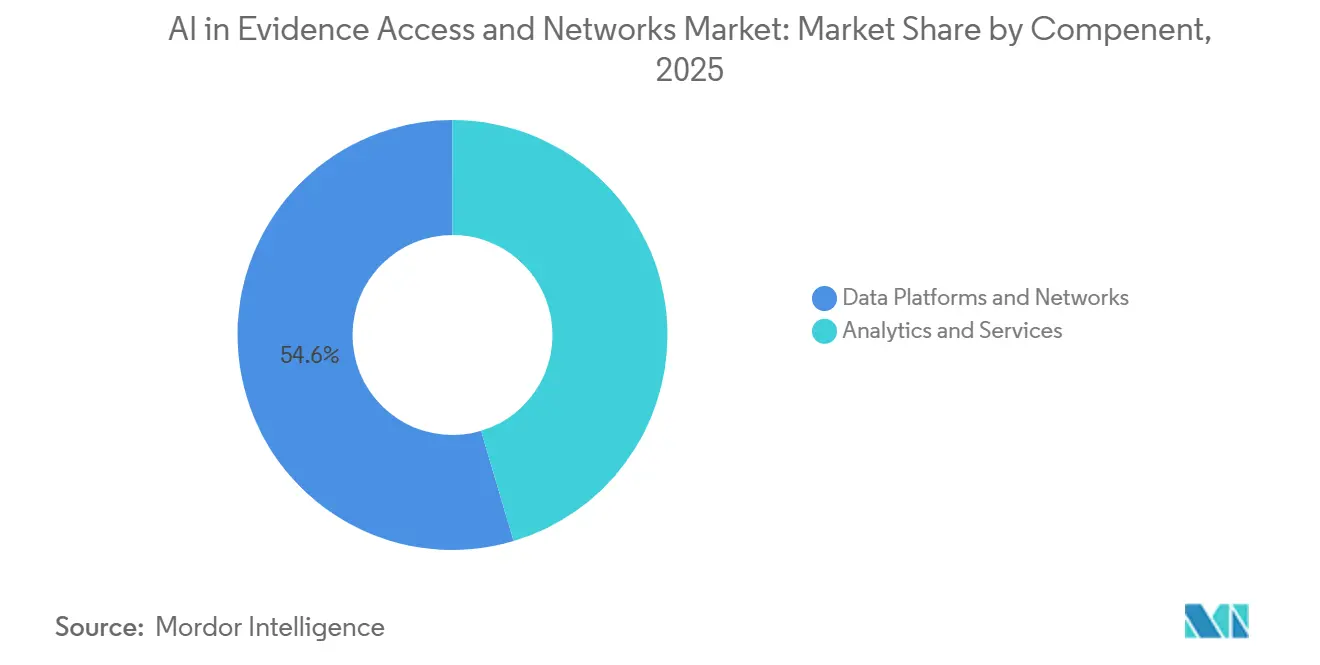
- By component, data platforms and networks led the AI in evidence access and networks market with a 54.57% share in 2025, while analytics and services are expected to be the fastest-growing segment, with a 18.34% CAGR through 2031
- By data source, electronic health records accounted for 60.25% of revenue in 2025, whereas claims and billing data are expected to be the fastest-growing source, with a 19.42% CAGR through 2031
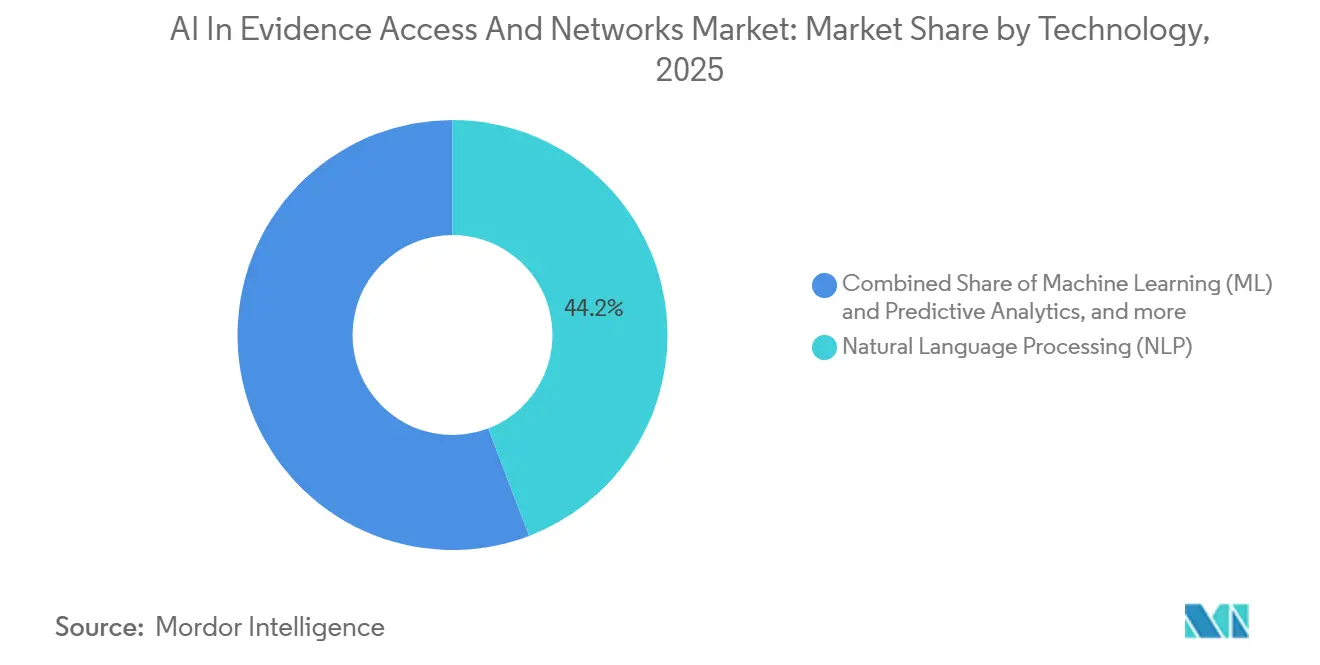
- By technology, natural language processing (NLP) held a 44.24% share of spending in 2025, while machine learning (ML) and predictive analytics are projected to be the fastest-growing technologies, with a 18.58% CAGR through 2031.
- By end user, pharmaceutical and biotech firms generated 46.78% of revenue in 2025, whereas healthcare providers and payers are expected to be the fastest-growing segment, with a 19.22% CAGR through 2031.
- By geography, North America accounted for 48.31% of the market in 2025, while Asia-Pacific is expected to be the fastest-growing region, with a 20.12% CAGR through 2031.
Note: Market size and forecast figures in this report are generated using Mordor Intelligence’s proprietary estimation framework, updated with the latest available data and insights as of January 2026.
Global AI In Evidence Access And Networks Market Trends and Insights
Drivers Impact Analysis*
| Driver | ( ~ ) % Impact on CAGR Forecast | Geographic Relevance | Impact Timeline |
|---|---|---|---|
| Rising Regulatory Acceptance of RWE in Drug Approvals | +3.8% | Global, led by North America and Europe | Medium term (2-4 years) |
| Exponential Growth of EHR and Claims Data Volumes | +3.2% | Global, strong in North America, Europe and Asia-Pacific | Long term (≥ 4 years) |
| Pharma Demand for Accelerated Trial Design and Post-Marketing Studies | +2.9% | Global, highest in North America and Europe | Short term (≤ 2 years) |
| Integration of AI/ML for Rapid Insight Generation | +2.7% | Global, early uptake in North America and select Asia-Pacific markets | Medium term (2-4 years) |
| Decentralized Trials Boosting Federated Data-Network Adoption | +2.4% | Global, prominent in North America and Europe | Medium term (2-4 years) |
| Outcomes-Based Payer Contracts Needing Robust Evidence Platforms | +2.1% | North America and Europe, emerging in Asia-Pacific | Long term (≥ 4 years) |
| Source: Mordor Intelligence | |||
Rising Regulatory Acceptance of RWE in Drug Approvals
The FDA already counted 23 approvals supported primarily by RWE through 2025, confirming that observational data can secure label expansions without fresh randomized trials. March 2026 saw the ICH M14 guideline define fit-for-purpose data and causal-inference design, placing stringent but clear rails around AI in evidence access and networks market submissions. In parallel, the EMA’s DARWIN EU added 30 partners covering 180 million patients, turning federation into Europe’s default architecture.[1]European Medicines Agency, “DARWIN EU,” EMA.europa.eu Japan, China and Canada each published RWE playbooks, compressing global timelines for post-approval safety and effectiveness signals. Sponsors now view continuous evidence generation as a baseline obligation, driving sustained spend on harmonized data networks.
Exponential Growth of EHR and Claims Data Volumes
Healthcare created 175 exabytes of data in 2025, a sevenfold jump from 2018, with roughly 80% locked in unstructured notes and images. U.S. hospitals alone generate about 50 petabytes yearly, challenging legacy SQL warehouses. The HL7 FHIR-to-OMOP guide, published April 2026, finally standardizes mappings between clinical and observational models, allowing the AI in evidence access and networks market to query multi-site datasets without bespoke extract-transform-load (ETL) code.[2]HL7, “FHIR to OMOP Implementation Guide,” HL7.org, April 2026 Simultaneously, AI adjudication engines trimmed claims-processing cycles, swelling structured billing records that fuel outcomes research. This data deluge compels vendors to scale tokenization, de-identification and NLP pipelines capable of onboarding petabytes while meeting privacy statutes.
Pharma Demand for Accelerated Trial Design and Post-Marketing Studies
Eighty-seven percent of top-20 pharma companies now house internal RWE departments and collectively invested USD 4.2 billion in data partnerships during 2024. Late-phase trial teams use federated feasibility queries to shave months off protocol finalization, while safety scientists lean on synthetic control arms generated from historical cohorts. Novo Nordisk’s pragmatic designs embed randomization within clinical workflows, illustrating how AI in evidence access and networks market capabilities shorten evidence cycles without disrupting care.[3]Novo Nordisk, “Real-World Evidence at Novo Nordisk,” NovoNordisk.com The FDA’s December 2023 digital-health guidance validated wearable endpoints, further expanding the evidence canvas sponsors must navigate.
Integration of AI/ML for Rapid Insight Generation
Platforms like Aetion inserted Smart Risk Profiles that auto-surface confounders, reducing analyst workload by 60%. Oracle’s Life Sciences AI Data Platform applies agentic intelligence atop 129 million de-identified records to autonomously rank sites and generate synthetic controls. Flatiron’s VALID framework uses large language models to extract hematology variables with 95% accuracy, satisfying transparency audits. These advances compress the time between query and regulatory submission, reinforcing AI in evidence access and networks market momentum even as agencies demand algorithmic explainability.
Restraints Impact Analysis*
| Restraint | ( ~ ) % Impact on CAGR Forecast | Geographic Relevance | Impact Timeline |
|---|---|---|---|
| Stringent Data-Privacy Regulations (HIPAA, GDPR, etc.) | -2.3% | Global, strictest in Europe and North America | Long term (≥ 4 years) |
| Fragmented and Non-Interoperable Healthcare Data Sources | -1.9% | Global, acute in North America and Asia-Pacific | Medium term (2-4 years) |
| High Upfront Costs of Secure Evidence-Network Build-Outs | -1.6% | Global, burdensome for mid-tier CROs | Short term (≤ 2 years) |
| Regulator Concerns on Data Provenance and Algorithm Transparency | -1.4% | Global, highest in North America and Europe | Medium term (2-4 years) |
| Source: Mordor Intelligence | |||
Stringent Data-Privacy Regulations (HIPAA, GDPR, etc.)
A single healthcare breach averaged USD 9.3 million in 2023 and carried a 287-day discovery lag, amplifying compliance budgets across the AI in evidence access and networks market. GDPR fines cap at 4% of global revenue, pushing vendors to host duplicate European data lakes that inflate cost structures. China’s Personal Information Protection Law and India’s Digital Personal Data Protection Act require in-country processing, fracturing multiregional evidence loops. Tokenization tools mitigate risk yet add license fees many mid-tier CROs cannot shoulder, slowing platform migrations.
Fragmented and Non-Interoperable Healthcare Data Sources
An average patient record splinters across 16 IT systems, forcing vendors to negotiate dozens of bilateral data-sharing agreements. Only 5% of multi-site observational studies link data across standards without custom workarounds, a barrier that drains engineering capacity. CMS’s Health Tech Pledge covers Medicare claims but does not bind commercial insurers, leaving holes in longitudinal coverage. Legacy EHR suppliers protect proprietary schemas, dampening real-time interoperability despite FHIR-to-OMOP blueprints.
*Our forecasts treat driver/restraint impacts as directional, not additive. The impact forecasts reflect baseline growth, mix effects, and variable interactions.
Segment Analysis
By Component: Data Platforms Anchor Revenue, Services Capture Growth
Data platforms and networks generated USD 0.48 billion, equal to 54.57% of 2025 revenue in the AI in evidence access and networks market size, underscoring the up-front spend required for ingesting, tokenizing and federating petabyte-scale data. However, analytics and services are forecasted to post an 18.34% CAGR to 2031 as sponsors divert budgets from raw infrastructure to interpretable insights. Oracle’s Life Sciences AI Data Platform blends 129 million de-identified records with agentic models, signaling the pivot toward decision support. Flatiron’s Veeva EDC linkage cut form-completion time to 37 seconds, proving service layers can eliminate sponsor labor. Vendors that unite platform and consulting stacks—Datavant + Aetion, Tempus + Deep 6 AI—lock in multi-year deals that stabilize cash flows.
Competitive pressure mounts as storage costs fall and open-source federated learning frameworks spread. Service firms counter commoditization by embedding proprietary explainable-AI modules. FDA’s documentation mandates magnify demand for regulatory consulting, and CROs increasingly white-label platform access, blurring value-chain borders. Consequently, services will account for a rising slice of AI in evidence access and networks market revenue even as platform fees recede.


By Data Source: EHR Dominance Meets Claims Acceleration
Electronic health records contributed 60.25% of 2025 revenue, reflecting their clinical granularity, yet claims-based feeds are projected to outpace at 19.42% CAGR to 2031 and should capture a larger portion of AI in evidence access and networks market size for payer analytics. Komodo’s CMS Innovator’s License delivered de-identified claims for 130 million beneficiaries, a trove competitors cannot easily replicate. Symphony Health merges 68 billion annual transactions into longitudinal pathways, making claims indispensable for adherence and cost analyses.
Genomics and wearables remain nascent but fast growing. Tempus weaves molecular data from 6.5 million patients into real-world outcomes, and Apple’s 419,297-participant Heart Study validated large-scale sensor endpoints. As precision-medicine pipelines multiply, omics feeds will expand their ownership of AI in evidence access and networks market share, albeit from a low base.
By Technology: Natural Language Processing (NLP) Leads, Machine Learning (ML) and Predictive Analytics Gains Momentum
Natural language processing captured 44.24% of 2025 spend because roughly 80% of healthcare data arrives unstructured. Veradigm’s USD 140 million ScienceIO buyout aimed to craft domain-specific language models at scale. Yet machine learning (ML) and predictive analytics are expected to grow at 18.58% CAGR to 2031, powered by synthetic control-arm generation and subgroup detection. Aetion’s Smart Subgroups auto-classifies effect modifiers, illustrating how explainable AI adds value while meeting transparency rules.
Generative and federated learning remain emergent but promise greater statistical power without infringing privacy. The open-source FedECA framework already enables time-to-event causal inference across distributed nodes, hinting at where the AI in evidence access and networks industry will direct R&D budgets. Transparency mandates tilt the roadmap toward interpretable algorithms, but the performance gap with deep learning is narrowing as hybrid models evolve.
By End User: Pharma Leads, Healthcare Providers and Payers Accelerate
Pharmaceutical and biotech companies delivered 46.78% of 2025 spending in the AI in evidence access and networks market, driven by regulatory RWE mandates. Providers and payers are projected to grow at 19.22% CAGR through 2031 as value-based contracts dominate reimbursement schemes. Optum already combines closed claims with NLP-derived clinical notes to monitor contractual triggers in real time. ACO REACH showed that aligned incentives can cut USD 1.6 billion in spending while meeting quality thresholds, encouraging providers to invest in self-service evidence layers.
CROs and academic regulators represent modest revenue but shape standards. IQVIA’s Flagship deal demonstrates CROs bundling analytics with site management, while OHDSI’s OMOP model sets technical baselines. As interoperability improves, these secondary buyers will widen the downstream addressable pool, deepening total AI in evidence access and networks market penetration.
Geography Analysis
North America contributed 48.31% of 2025 AI in evidence access and networks market revenue, fueled by FDA RWE guidance, rich payer datasets and the CMS interoperability pledge requiring FHIR APIs by July 2026. Datavant’s 300-partner ecosystem and Optum’s comprehensive claims mart demonstrate regional infrastructure maturity. Canada’s pan-Canadian Health Data Charter aims to harmonize provincial exchanges, while Mexico’s social-security network covers 50 million beneficiaries but lacks tight EHR integration.
Europe benefits from DARWIN EU’s 180 million-patient federation and national assets like the UK’s OpenSAFELY and France’s Health Data Hub. GDPR imposes costly localization, yet academic–industry coalitions compensate with public-sector scale. Germany’s Medical Informatics Initiative connects university hospitals, although southern states move slower. Vendors willing to navigate multi-layered governance gain access to contiguous continental cohorts that rival U.S. volumes.
Asia-Pacific is expected to grow at a 20.12% CAGR through 2031, the fastest among regions, bolstered by China’s 21-province RWE pilots and India’s 580 million digital health accounts. Japan’s PMDA guidance clarifies real-world data submissions and Singapore’s 100% EHR adoption provides a high-fidelity sandbox. Localization laws in China and India force in-country processing, yet domestic cloud vendors and startup networks proliferate to fill the gap. Australia and South Korea approach near-universal digital records but grapple with regional governance, while GCC nations launch national EHR blueprints that will mature after 2028. Collectively, these moves embed structural tailwinds for AI in evidence access and networks market expansion across the hemisphere.

Competitive Landscape
The AI in evidence access and networks market remains moderately fragmented. Datavant’s 2025 purchase of Aetion fused 300 data partners with causal-inference analytics, creating an end-to-end stack that locks in pharmaceutical contracts. Tempus added Deep 6 AI in 2026, bringing unstructured EMR mining across 30 million patients at 750 sites, fortifying its oncology franchise. Oracle leveraged its cloud heft to launch the Life Sciences AI Data Platform in 2026, embedding agentic models inside 129 million de-identified records and cross-selling into enterprise ERP accounts.
Veradigm’s USD 140 million ScienceIO buy built proprietary large language models that parse discharge summaries, and IQVIA’s Flagship Pioneering alliance blends data assets with early-stage biotech incubation. HealthVerity’s Series C funding expanded its Identity Privacy Graph Engine that links billions of records without violating privacy laws, demonstrating how niche specialists carve white-space. Komodo’s CMS Innovator’s License supplies de-identified Medicare claims, another moat incumbents cannot mirror easily.
Competition increasingly hinges on algorithmic transparency and governance. Flatiron’s VALID framework, Aetion’s Smart Subgroups and Oracle’s agentic workflow each promise auditable pipelines that regulators favor. The HL7 FHIR-to-OMOP guide lowers vendor lock-in, promoting multi-homed buyers and margin compression for undifferentiated aggregators. Market leaders therefore chase vertical integration, while challengers specialize in registries, wearables or federated protocols to differentiate.
AI In Evidence Access And Networks Industry Leaders
IQVIA
Optum
Flatiron Health
TriNetX
Komodo Health
- *Disclaimer: Major Players sorted in no particular order

Recent Industry Developments
- March 2026: FDA finalized ICH M14 guidance, codifying causal-inference standards for non-interventional studies.
- January 2026: Oracle launched its Life Sciences AI Data Platform, integrating 129 million de-identified EHRs with agentic intelligence.
- March 2025: Tempus acquired Deep 6 AI, absorbing real-time unstructured EMR mining across 750 provider sites.


Global AI In Evidence Access And Networks Market Report Scope
AI in evidence access and networks refers to the use of artificial intelligence technologies to efficiently collect, organize, analyze, and share data and evidence across interconnected systems or stakeholders, enabling faster insights, improved decision-making, and enhanced collaboration within a network.
The AI in evidence access and networks market is segmented by component, data source, technology, end user, and geography. By component, the market is segmented into data platforms and networks and analytics and services. By data source, the market is segmented into electronic health records (EHR), claims and billing data, genomic and omics data, and patient registries. By technology, the market is segmented into natural language processing (NLP), machine learning (ML) predictive analytics, and others. By end user, the market is segmented into pharmaceutical and biotech companies, contract research organizations (CROs), healthcare providers and payers, and others. By geography, the market is segmented into North America, Europe, Asia-Pacific, Middle East and Africa, and South America. The report also covers the estimated market sizes and trends for 17 countries across major regions globally. The report offers values (USD) for all the above segments.
| Data Platforms and Networks |
| Analytics and Services |
| Electronic Health Records (EHR) |
| Claims and Billing Data |
| Genomic and Omics Data |
| Patient Registries |
| Others |
| Natural Language Processing (NLP) |
| Machine Learning (ML) and Predictive Analytics |
| Others |
| Pharmaceutical and Biotech Companies |
| Contract Research Organizations (CROs) |
| Healthcare Providers and Payers |
| Others |
| North America | United States |
| Canada | |
| Mexico | |
| Europe | Germany |
| United Kingdom | |
| France | |
| Italy | |
| Spain | |
| Rest of Europe | |
| Asia-Pacific | China |
| Japan | |
| India | |
| Australia | |
| South Korea | |
| Rest of Asia-Pacific | |
| Middle East and Africa | GCC |
| South Africa | |
| Rest of Middle East and Africa | |
| South America | Brazil |
| Argentina | |
| Rest of South America |
| By Component | Data Platforms and Networks | |
| Analytics and Services | ||
| By Data Source | Electronic Health Records (EHR) | |
| Claims and Billing Data | ||
| Genomic and Omics Data | ||
| Patient Registries | ||
| Others | ||
| By Technology | Natural Language Processing (NLP) | |
| Machine Learning (ML) and Predictive Analytics | ||
| Others | ||
| By End User | Pharmaceutical and Biotech Companies | |
| Contract Research Organizations (CROs) | ||
| Healthcare Providers and Payers | ||
| Others | ||
| By Geography | North America | United States |
| Canada | ||
| Mexico | ||
| Europe | Germany | |
| United Kingdom | ||
| France | ||
| Italy | ||
| Spain | ||
| Rest of Europe | ||
| Asia-Pacific | China | |
| Japan | ||
| India | ||
| Australia | ||
| South Korea | ||
| Rest of Asia-Pacific | ||
| Middle East and Africa | GCC | |
| South Africa | ||
| Rest of Middle East and Africa | ||
| South America | Brazil | |
| Argentina | ||
| Rest of South America | ||


Key Questions Answered in the Report
How large will the AI in evidence access and networks market be by 2031?
The AI in evidence access and networks market size is forecast to reach USD 2.22 billion by 2031 and is expected to expand at a 17.19% CAGR over 2026–2031.
Which region is expected to grow fastest?
Asia-Pacific is projected to record a 20.12% CAGR to 2031 as China, India and Japan embed national RWE programs.
Which component segment will outpace the rest?
Analytics and services are expected to grow at an 18.34% CAGR through 2031, overtaking platforms as sponsors increasingly prioritize interpretation capabilities.
What technology commands the largest spend today?
Natural language processing held 44.24% of 2025 spending, driven by the need to structure unstructured clinical notes.
Page last updated on:


