AI Enabled Pharma Supply Chain Market Size and Share
Market Overview
| Study Period | 2020 - 2031 |
|---|---|
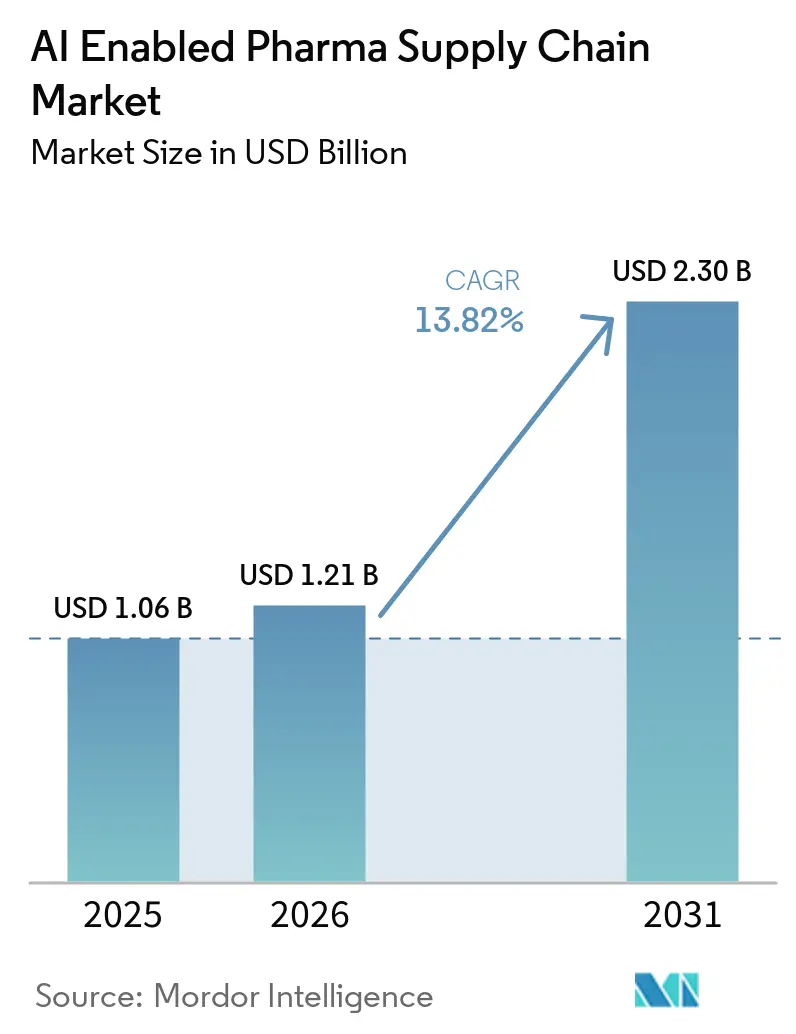
| Market Size (2026) | USD 1.21 Billion |
| Market Size (2031) | USD 2.30 Billion |
| Growth Rate (2026 - 2031) | 13.82% CAGR |
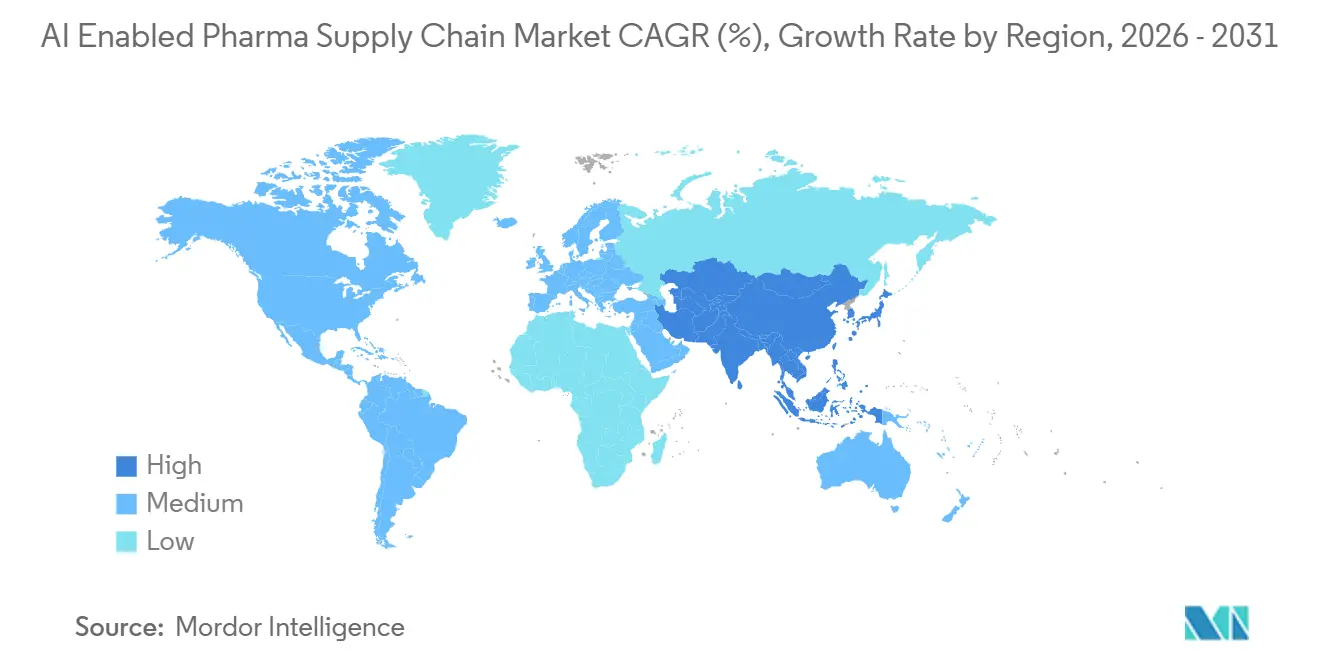
| Fastest Growing Market | Asia-Pacific |
| Largest Market | North America |
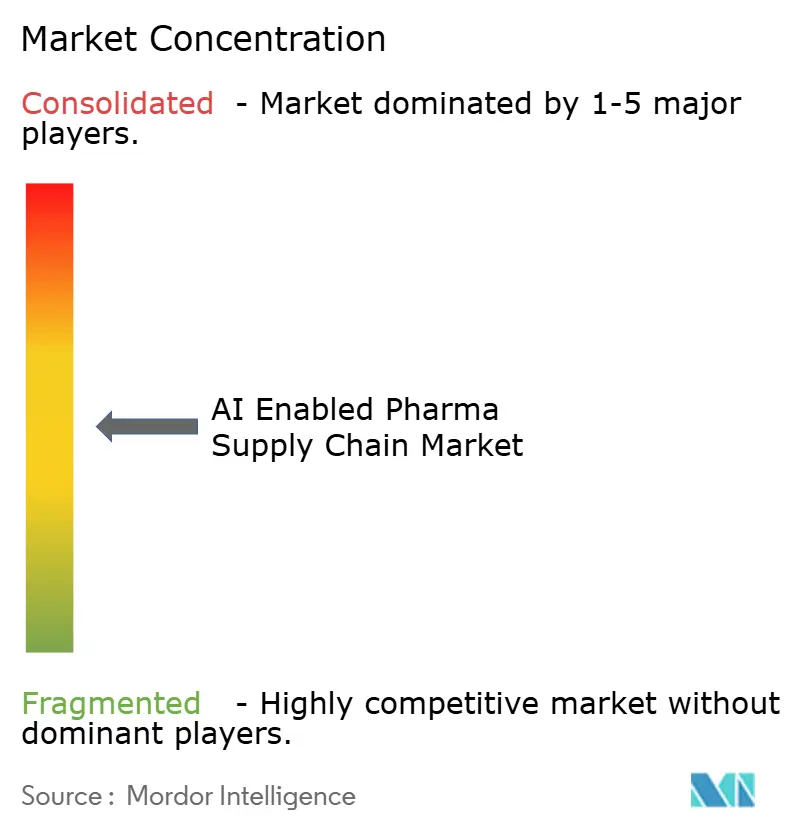
| Market Concentration | Medium |
Major Players *Disclaimer: Major Players sorted in no particular order Image © Mordor Intelligence. Reuse requires attribution under CC BY 4.0. | |
AI Enabled Pharma Supply Chain Market Analysis by Mordor Intelligence
The AI-Enabled Pharma Supply Chain Market was valued at USD 1.06 billion in 2025 and expanded to USD 1.21 billion in 2026. It is projected to reach USD 2.30 billion by 2031, registering a CAGR of 13.82% during the forecast period.
Elevated adoption of agentic AI that can reorder inventory autonomously, the surge in oncology cold-chain requirements, and regulators’ 2026 endorsement of documented model lineage are accelerating deployments. North America currently underpins demand thanks to early investments by Merck and McKesson, while India’s global capability centers and China-plus-one sourcing complexity are pulling capital and talent toward Asia-Pacific. Vendor competition is widening as hyperscalers supply foundation models and ISVs embed specialized algorithms, yet high validation costs keep buyers cautious. Sustainability mandates in the EU and California are also steering roadmap priorities toward carbon-optimized routing engines.
Key Report Takeaways
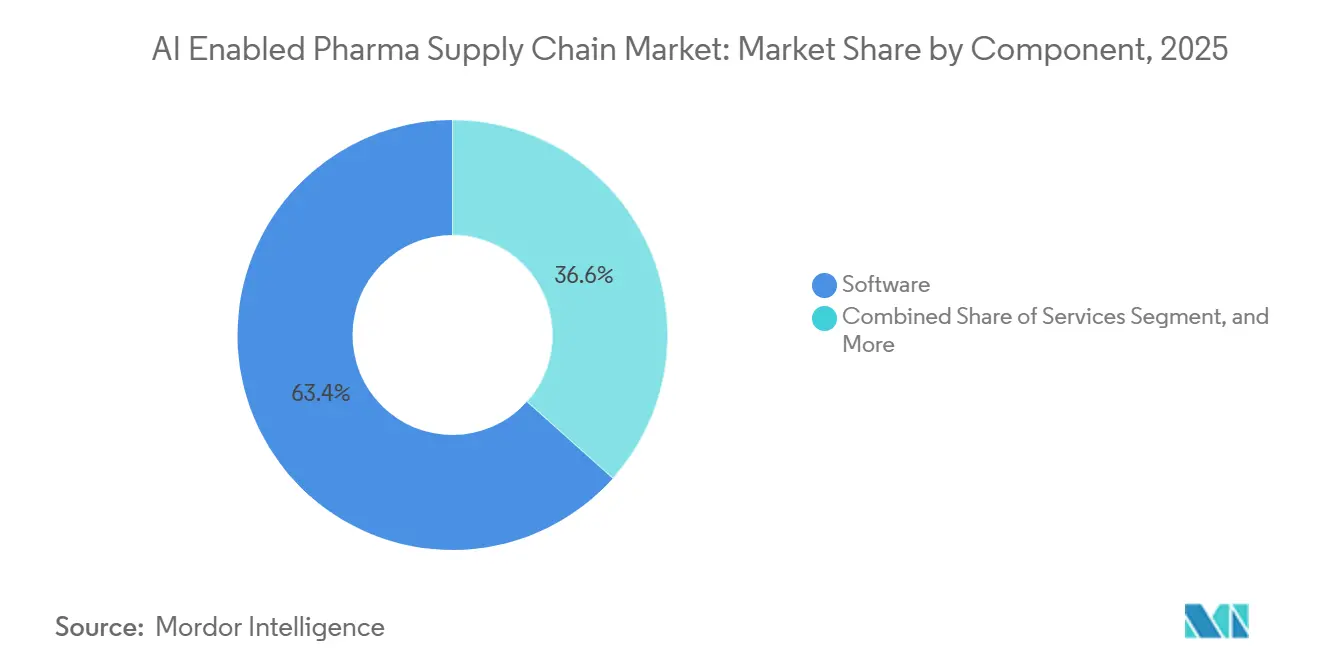
- By software, the AI enabled pharma supply chain market dominated with a 63.45% share in 2025. Platforms and AI models are projected to advance at a robust 14.71% CAGR through 2031.
- By application, demand forecasting and planning accounted for a 32.48% share of the AI enabled pharma supply chain market size in 2025. In contrast, cold-chain monitoring is expected to expand at a CAGR of 15.69% during the forecast period, reaching 2031.
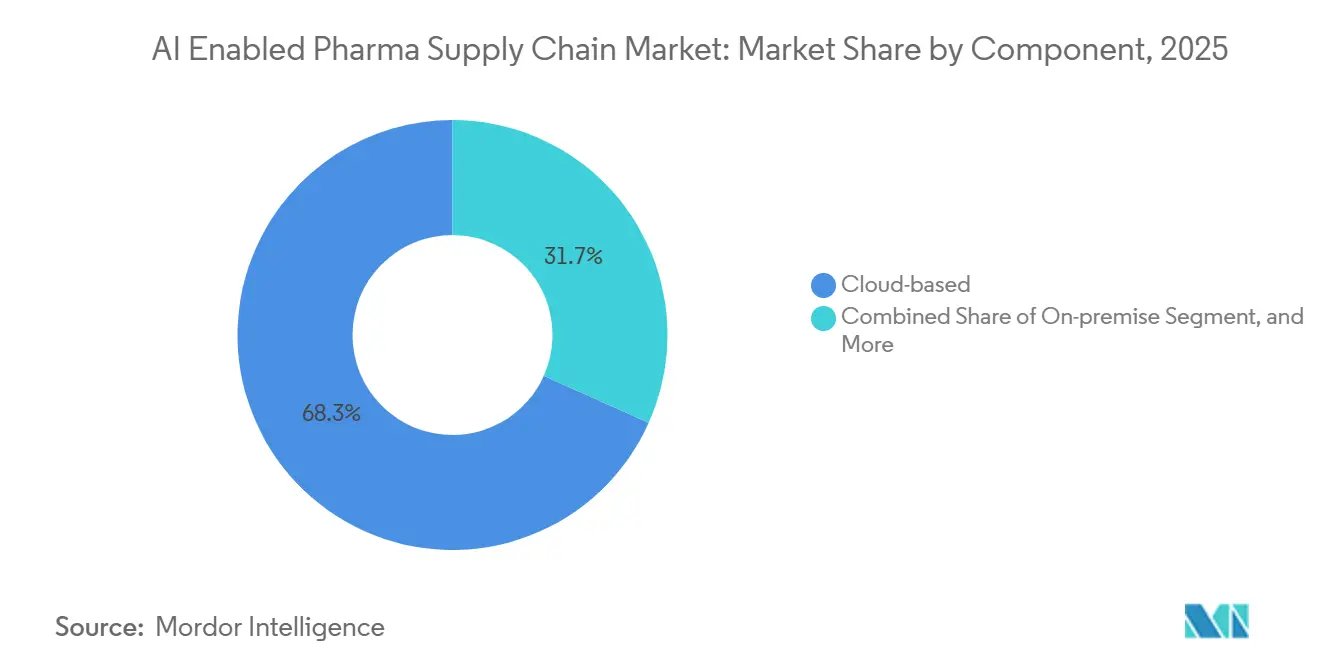
- By deployment, cloud solutions dominated the AI enabled pharma supply chain market in 2025, securing a 68.31% share. Meanwhile, on-premise rollouts will grow at a 16.38% CAGR, driven by increasing data-sovereignty demands.
- By end-user, pharmaceutical manufacturers accounted for a 56.79% revenue share in 2025. However, contract manufacturing organizations are expected to witness the fastest growth, with an 18.43% CAGR projected through 2031.
- By geography, North America dominated the AI enabled pharma supply chain market with a 38.51% share in 2025. However, the Asia-Pacific region is expected to register the highest CAGR of 18.25% during the forecast period, reaching 2031.
Note: Market size and forecast figures in this report are generated using Mordor Intelligence’s proprietary estimation framework, updated with the latest available data and insights as of January 2026.
Global AI Enabled Pharma Supply Chain Market Trends and Insights
Drivers Impact Analysis*
| Driver | (~) % Impact on CAGR Forecast | Geographic Relevance | Impact Timeline | |
|---|---|---|---|---|
| Rising Demand for Predictive Supply-Chain Management | +3.2% | Global, early traction in North America and Western Europe | Medium term (2-4 years) | |
| Growing Complexity of Global Pharmaceutical Distribution Networks | +2.8% | APAC core, spill-over to MEA and South America | Long term (≥4 years) | |
| Need for Cost Optimization and Operational Efficiency | +2.5% | North America and EU, extending to APAC CMO hubs | Short term (≤2 years) | |
| Rapid Digitalization of Pharma Operations | +2.1% | Global, led by India GCCs and Brazil digital health initiatives | Medium term (2-4 years) | |
| AI-Driven Sustainability Mandates | +1.4% | EU and California, expanding to GCC sovereign funds | Long term (≥4 years) | |
| Oncology Cold-Chain Precision via Edge-AI Sensors | +1.8% | North America oncology hubs, Japan precision-medicine corridors | Medium term (2-4 years) | |
| Source: Mordor Intelligence | ||||
Rising Demand for Predictive Supply-Chain Management
Pharmaceutical companies are replacing monthly planning cycles with always-on engines that forecast demand 18 months ahead, blending clinical-trial enrollment signals, payer formulary updates, and weather data. Merck’s five-year, USD 1 billion Vertex AI rollout aims to trim safety stock 30%, freeing cash for pipeline acquisitions. An extra percentage point of inventory ties up USD 200-300 million in working capital at a top-20 firm, so precision matters. AI-driven forecast accuracy gains of 15-25 points unlock USD 3-5 billion that can fund dividend increases. The January 2026 FDA-EMA principles clarified documentation expectations, giving quality teams the legal cover to automate replenishment workflows. Early adopters already report 8-10 day lead-time reductions, improving service levels for temperature-sensitive oncology drugs.
Growing Complexity of Global Pharmaceutical Distribution Networks
China-plus-one strategies now split active-ingredient sourcing across India, Vietnam, and Mexico, forcing brand owners to manage more suppliers. IBM Watsonx tracks 2.3 million pharmaceutical SKUs in 87 countries and flags export-license delays or port congestion 14 days early, letting firms switch to pre-qualified alternates. India’s 1,300+ global capability centers feed region-specific demand models that surface opaque distributor sales data. Brazil and Argentina CMOs employ AI procurement engines to hedge currency swings that shift input costs 20% within a quarter. As logistics corridors stretch, visibility gaps amplify risk; predictive ETA tools that combine real-time vessel traffic with customs filings improve schedule adherence by 11-15%. These shifts raise the baseline need for the AI enabled pharma supply chain market to deliver end-to-end transparency across fragmented geographies.
Need for Cost Optimization and Operational Efficiency
Biosimilar pressure and value-based reimbursement clipped operating margins 200-300 basis points from 2020-2025, putting supply-chain efficiency in every pharmaceutical CEO’s top three agenda items. Manhattan Associates’ AI-based warehouse system shrank pick-path travel 35% and cut labor 22% for a European top-10 player. Solutions synchronized 10,000 Indian distributor signals with output from 12 plants, slashing stock-outs 40% and releasing USD 18 million in cash within nine months. AI models now optimize pallet cube usage, raising trailer fill rates from 78% to 90%, which lowers annual freight spend by 6-9%. Predictive maintenance modules on refrigerated trailers cut unplanned downtime 28%. These quantified wins explain why procurement chiefs allocate incremental budgets toward the AI enabled pharma supply chain market despite macro uncertainty.
Rapid Digitalization of Pharma Operations
Brazil mandated e-prescribing and full serialization by January 2025, compelling 340 manufacturers to bolt AI engines onto existing traceability stacks. SAP’s machine-learning export-docs workflow shaved 28% off customs clearance across 54 nations by predicting which consignments regulators inspect. India invested USD 2.4 billion in digital infrastructure in 2025, with 60% channeled to cloud AI that links brand owners with hundreds of contract sites. The FDA piloted remote audits on digital-twin data in 2025 and plans network-wide scaling by 2028. Mexico integrated blockchain freight documents into AI routing, cutting border wait times 19%. Collectively, these mandates lift baseline digital maturity, expanding the installation base for the AI enabled pharma supply chain market.
Restraints Impact Analysis*
| Restraint | (~) % Impact on CAGR Forecast | Geographic Relevance | Impact Timeline |
|---|---|---|---|
| High Implementation Cost and Integration Complexity | -2.3% | Global, acute in mid-tier pharma and emerging-market CMOs | Short term (≤2 years) |
| Data Privacy, Compliance and Regulatory Constraints | -1.8% | EU (GDPR, Annex 22), North America (21 CFR Part 11, HIPAA) | Medium term (2-4 years) |
| Scarcity of Annotated GMP-Grade Supply-Chain Datasets | -1.2% | Global, most severe in biologics and cell-gene therapy | Long term (≥4 years) |
| Model Drift Risk Amid Volatile Demand Shocks | -1.5% | Global, heightened in pandemic-prone regions | Medium term (2-4 years) |
| Source: Mordor Intelligence | |||
High Implementation Cost and Integration Complexity
Mid-tier companies with USD 500 million-USD 3 billion in revenue run IT budgets near 3% of revenue, yet full AI platform rollouts can cost USD 15-25 million. TraceLink’s 2026 survey reported 68% of executives view integration as the primary barrier, because each API interface needs 400-600 engineering hours and GMP validation that drags go-live by nine months.[1]TraceLink, “LogiPharma Playbook 2026,” CMOs with net margins below 12% often defer AI until vendors offer modular “start small” kits focused on one high-impact use case, such as demand sensing. Legacy ERP instances from the 1990s complicate matters with customized code that resists modern REST connectors. Capital budgeting committees demand payback within 24 months, forcing suppliers to provide outcome-based pricing. These realities temper near-term spending, although as more reference sites emerge, perceived risk declines and the AI enabled pharma supply chain industry broadens adoption.
Data Privacy, Compliance and Regulatory Constraints
Annex 22 of EU GMP, issued August 2024, mandates prospective validation, bias testing, and documented model versioning, yet only 20% of commercial AI tools currently comply.[2]European Commission, “EU Regulatory Framework for AI,” GDPR data-localization adds USD 3-6 million per project when training data and model artifacts must stay within the EEA. In the United States, 21 CFR Part 11 is silent on automated decision making, so risk-averse quality teams often insert manual overrides that undercut efficiency. Japan’s 2025 data-sovereignty rules require patient-touching AI workloads to stay in domestic data centers, limiting multi-tenant cloud usage. HIPAA adds another consent layer when AI taps real-world evidence. These overlapping mandates slow the deployment of the AI enabled pharma supply chain market, especially for multinationals juggling diverging regional laws.
*Our forecasts treat driver/restraint impacts as directional, not additive. The impact forecasts reflect baseline growth, mix effects, and variable interactions.
Segment Analysis
By Component: Generative Platforms Displace Legacy Modules
Platforms and AI models will grow at 14.71% CAGR through 2031, outpacing every other component. Software captured 63.45% share in 2025 because of the entrenched installed base. Blue Yonder added autonomous agents in 2026 that already manage inventory across 37 distribution centers.[3]Blue Yonder, “Agentic AI in Supply Chain,”
NVIDIA-backed GPU simulation lets Kinaxis model 10,000 disruption scenarios in two hours.[4]Kinaxis, “GPU Simulation for Pharma Planning,” Demand for explainable AI that passes EU AI Act transparency tests is driving upgrades away from black-box rules engines. Services revenues are rising at the broader AI enabled pharma supply chain market growth rate because drug makers outsource model tuning on validated infrastructure.


By Application: Cold-Chain Monitoring Takes the Growth Crown
Cold-chain monitoring is forecast to post 15.69% CAGR through 2031 as gene and cell-therapy launches triple ultra-cold shipments. Demand-forecasting retained 32.48% of the AI enabled pharma supply chain market share in 2025, though its growth is plateauing. Edge sensors now feed 10-second interval data to predictive models that cut equipment downtime 30% and extend chiller life by two years.
Risk-and-disruption engines are graduating from pilot to production, ingesting 340,000 fresh data points daily to score supplier vulnerabilities. Logistics optimization saves 18-25% in expedited freight by forecasting delivery windows within 15 minutes. These cascading use cases ensure the AI enabled pharma supply chain market continues widening its application stack in response to real-world shocks.
By Deployment: On-Premise Revival Under Sovereignty Mandates
Cloud retained 68.31% share in 2025; however, on-premise rollouts will accelerate at 16.38% CAGR as Japan, South Korea, and the EU tighten data-residency rules. The AI enabled pharma supply chain industry is witnessing hybrid architectures that keep master data on local servers while running inference in public clouds.
The EU Digital Operational Resilience Act obliges annual audits of external cloud providers, nudging mid-tier companies toward on-premise AI to avoid complex third-party assessments. Microsoft and Oracle’s 2025 cross-cloud pact gives drug makers flexibility to straddle multi-tenant SaaS and secure single-tenant workloads.
By End-User: CMOs Race Ahead on Multi-Client Complexity
Pharmaceutical manufacturers held 56.79% revenue share in 2025, but contract manufacturing organizations will post the strongest 18.43% CAGR to 2031. CMOs juggle batch schedules for up to 40 clients, making predictive quality and demand synchronization critical. The AI enabled pharma supply chain market size for CMOs is on track to more than double by 2031 as WinAI and similar tools automate batch-record review during FDA audits.
Large pharmaceutical innovators still hold the pre-eminent revenue position, but capacity expansion, value-based contracts, and nearshoring are tilting incremental spend toward flexible CMOs and biotech firms. Cloud-native planning suites implemented at Mankind Pharma show mid-tier players can leapfrog legacy on-premise tools and recover USD 18 million of working capital in under a year.
Geography Analysis
North America commanded 38.51% of global revenue in 2025, reflecting early mover deployments and the January 2026 FDA-EMA principles that clarified AI validation. Merck’s USD 1 billion Vertex AI roll-out and McKesson’s IBM WatsonX demand engine, which improved forecast accuracy to 92% and cut stock-outs 35%, exemplify the region’s scale. Canada uses AI to balance provincial formulary nuances, while Mexican CMOs employ AI quality tools to strengthen nearshore supply for U.S. brands.
Asia-Pacific is projected to grow at 18.25% CAGR, outstripping every other region. India’s 1,300+ global capability centers funnel AI talent into the AI enabled pharma supply chain market, helping exporters satisfy 54 diverse serialization regimes. China-plus-one diversification pushes API work to Vietnam and Indonesia, compelling real-time visibility platforms where 40% of tier-2 vendors still use spreadsheets. Japan’s on-premise mandates channel spending into sovereign data centers, while Australia’s AI-assisted regulatory pilots shorten approval cycles to nine months
Annex 22 and GDPR localization add USD 3–6 million per roll-out, incentivizing explainable on-premise solutions. Germany, the United Kingdom, France, Italy, and Spain control 65% of regional pharmaceutical output, and manufacturers there are pilot-testing agentic replenishment within tightly validated sandboxes. The Middle East, spearheaded by Saudi and UAE localization programs, and South America, driven by Brazil’s e-prescribing mandate, round out emerging catch-up markets.

Competitive Landscape
TraceLink dominates end-to-end serialization, Blue Yonder leads warehouse orchestration, and o9 Solutions tops integrated business planning, yet cross-selling is constrained by 18-24-month validation cycles. Hyperscalers act as platform backbones: Google Cloud embeds foundation models, Microsoft and Oracle drive secure cross-cloud infrastructure, and AWS provides scalable GPU instances but shuns vertical application layers.
Strategic patterning shows tier-1 pharmaceutical companies building proprietary models atop hyperscaler stacks, while mid-tier generics and CMOs choose SaaS to amortize cost. NVIDIA acceleration has become table stakes, yet 70% of on-premise data centers still lack compatible GPUs, opening a replacement cycle favorable to hybrid cloud vendors. White space persists in agentic AI for batch release and carbon-optimized routing, areas where startups pitching 6-to-9-month GMP-validated roll-outs can secure beachheads.
Startups such as WinAI automate audit documentation, trimming pre-inspection preparation time 40%; synthetic-data specialists generate compliant yet shareable datasets to mitigate the restraint of limited GMP-grade training material. Meanwhile, incumbents fortify positions via ecosystem alliances, as illustrated by Blue Yonder’s 2026 agentic upgrade already piloted by 14 drug makers operating 37 DCs.
AI Enabled Pharma Supply Chain Industry Leaders
Amazon Web Services (AWS)
IBM
Microsoft
TraceLink
Google Cloud
- *Disclaimer: Major Players sorted in no particular order

Recent Industry Developments
- January 2026: Blue Yonder unveiled agentic AI in Luminate, activating autonomous replenishment at 37 pharma distribution centers.
- November 2025: Merck and Google Cloud signed a USD 1 billion, five-year pact to embed Vertex AI across the end-to-end network.
- October 2025: Kinaxis and NVIDIA integrated a GPU-accelerated simulation that trims scenario-planning time from weeks to hours.
- August 2025: OPTEL and Kaster launched edge-AI sensors detecting cold-chain excursions 12 minutes ahead of threshold.


Global AI Enabled Pharma Supply Chain Market Report Scope
As per the scope of the report, AI enabled pharma supply chain refers to the use of artificial intelligence technologies across pharmaceutical supply chain operations to improve forecasting, inventory management, manufacturing, logistics, and distribution efficiency. It leverages AI, machine learning, predictive analytics, and automation to optimize demand planning, reduce disruptions, ensure cold-chain integrity, and enhance real-time visibility. The market supports pharmaceutical companies in improving operational agility, regulatory compliance, and cost efficiency while ensuring the timely delivery of medicines and healthcare products.
The AI enabled pharma supply chain market is segmented by component, application, deployment, end-user, and geography. By component, the market is segmented into software, services, and platforms / AI models. By application, the market is segmented into demand forecasting & planning, logistics & distribution management, cold-chain monitoring, risk & disruption management, and others. By deployment, the market is segmented into cloud-based, on-premise, and hybrid. By end-user, the market is segmented into pharmaceutical companies, biotechnology companies, contract manufacturing organizations (CMOs), and others. By geography, the market is segmented into North America, Europe, Asia-Pacific, the Middle East and Africa, and South America. The market report also covers estimated market sizes and market trends for 17 countries across major regions worldwide. The report offers market value (in USD) for the above segments.
| Software |
| Services |
| Platforms / AI Models |
| Demand Forecasting & Planning |
| Logistics & Distribution Management |
| Cold-Chain Monitoring |
| Risk & Disruption Management |
| Others |
| Cloud-based |
| On-premise |
| Hybrid |
| Pharmaceutical Companies |
| Biotechnology Companies |
| Contract Manufacturing Organizations (CMOs) |
| Others |
| North America | United States |
| Canada | |
| Mexico | |
| Europe | Germany |
| United Kingdom | |
| France | |
| Italy | |
| Spain | |
| Rest of Europe | |
| Asia-Pacific | China |
| India | |
| Japan | |
| Australia | |
| South Korea | |
| Rest of Asia-Pacific | |
| Middle East and Africa | GCC |
| South Africa | |
| Rest of Middle East and Africa | |
| South America | Brazil |
| Argentina | |
| Rest of South America |
| By Component | Software | |
| Services | ||
| Platforms / AI Models | ||
| By Application | Demand Forecasting & Planning | |
| Logistics & Distribution Management | ||
| Cold-Chain Monitoring | ||
| Risk & Disruption Management | ||
| Others | ||
| By Deployment | Cloud-based | |
| On-premise | ||
| Hybrid | ||
| By End-User | Pharmaceutical Companies | |
| Biotechnology Companies | ||
| Contract Manufacturing Organizations (CMOs) | ||
| Others | ||
| By Geography | North America | United States |
| Canada | ||
| Mexico | ||
| Europe | Germany | |
| United Kingdom | ||
| France | ||
| Italy | ||
| Spain | ||
| Rest of Europe | ||
| Asia-Pacific | China | |
| India | ||
| Japan | ||
| Australia | ||
| South Korea | ||
| Rest of Asia-Pacific | ||
| Middle East and Africa | GCC | |
| South Africa | ||
| Rest of Middle East and Africa | ||
| South America | Brazil | |
| Argentina | ||
| Rest of South America | ||


Key Questions Answered in the Report
What value will the AI enabled pharma supply chain market reach by 2031?
The AI enabled pharma supply chain market is forecast to reach USD 2.30 billion by 2031, expanding at a 13.82% CAGR over 2026-2031.
Which component is growing fastest?
Platforms and AI models will expand at 14.71% CAGR as generative and agentic architectures displace legacy rule engines.
Which region leads growth?
Asia-Pacific will register the highest 18.25% CAGR through 2031, fueled by India’s capability centers and China-plus-one sourcing complexity.
How large was software’s share in 2025?
Software captured 63.45% of the AI-enabled pharma supply chain market share in 2025.
Who will adopt AI fastest among end users?
Contract manufacturing organizations are expected to grow at 18.43% CAGR through 2031 as they manage multi-client complexity.
Why are on-premise deployments rising?
Data-sovereignty mandates in Japan, South Korea, and the EU are driving 16.38% CAGR growth in on-premise rollouts despite cloud dominance.
Page last updated on:


