Agent Observability And Governance Market Size and Share
Market Overview
| Study Period | 2020 - 2031 |
|---|---|
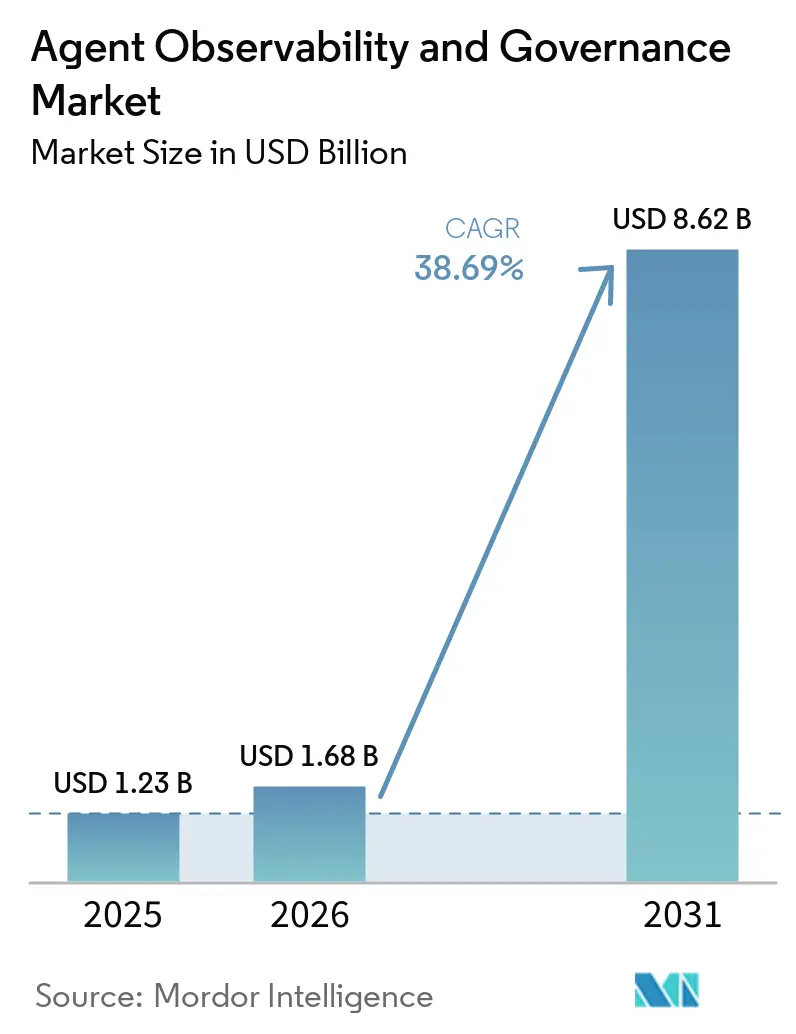
| Market Size (2026) | USD 1.68 Billion |
| Market Size (2031) | USD 8.62 Billion |
| Growth Rate (2026 - 2031) | 38.69% CAGR |
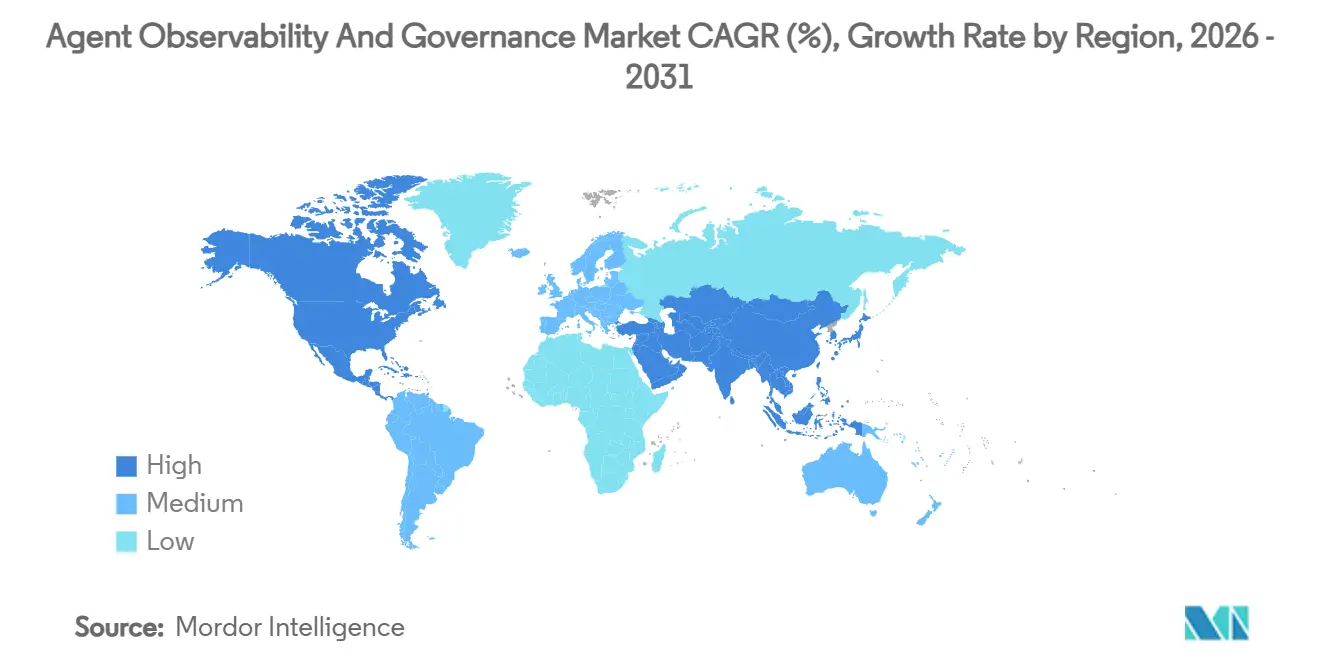
| Fastest Growing Market | Asia Pacific |
| Largest Market | North America |
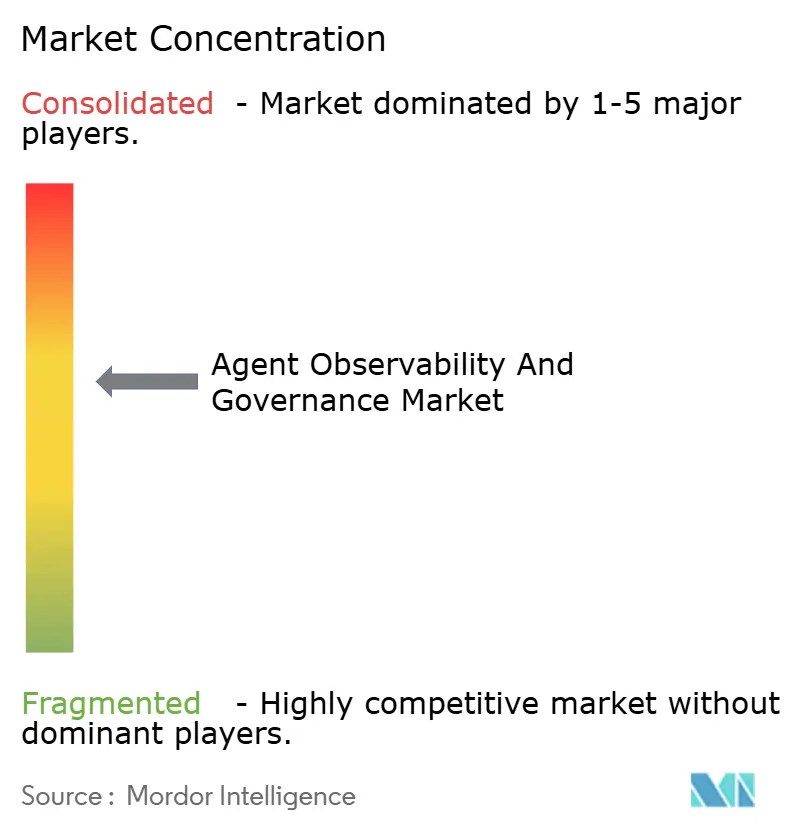
| Market Concentration | Medium |
Major Players *Disclaimer: Major Players sorted in no particular order Image © Mordor Intelligence. Reuse requires attribution under CC BY 4.0. | |
Agent Observability And Governance Market Analysis by Mordor Intelligence
The agent observability and governance market size is expected to grow from USD 1.23 billion in 2025 to USD 1.68 billion in 2026 and is forecast to reach USD 8.62 billion by 2031 at 38.69% CAGR over 2026-2031. Enterprise demand accelerates as autonomous AI agents move from pilot proofs to always-on production workloads, exposing blind spots that legacy application-performance tools cannot illuminate. New regulations now require real-time audit trails and explainability, turning observability into a compliance mandate rather than an IT nice-to-have. Vendor investment in OpenTelemetry-based instrumentation lowers integration friction and encourages multi-cloud strategies, while venture funding keeps specialist start-ups innovating faster than incumbents. Intensifying competition pushes platform vendors to add native policy-enforcement engines and sector-specific compliance templates, expanding addressable spend beyond DevOps into risk, legal, and security budgets.
Key Report Takeaways
- By component, software accounted for 68.32% of 2025 revenue, while services are projected to grow at a 36.93% CAGR through 2031.
- By deployment mode, cloud deployments led with a 71.44% share in 2025, and hybrid architectures are forecast to expand at a 37.13% CAGR through 2031.
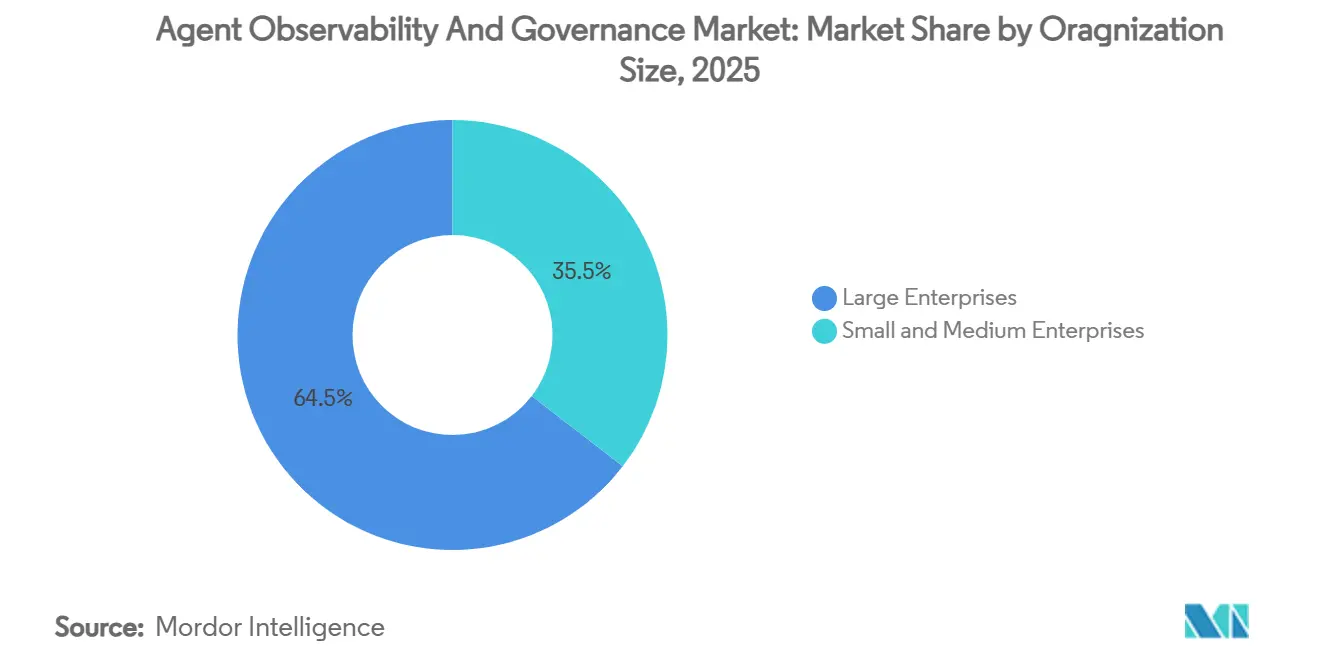
- By organization size, large enterprises accounted for 64.54% of 2025 spending, yet small and medium enterprises are anticipated to grow at a 36.89% CAGR through 2031.
- By industry vertical, banking, financial services, and insurance captured 19.98% of 2025 revenue, whereas healthcare and life sciences are poised for the fastest 37.93% CAGR over the forecast period.
- By geography, North America accounted for 38.27% of global revenue in 2025, while Asia-Pacific is projected to surge at a 41.53% CAGR to 2031.
Note: Market size and forecast figures in this report are generated using Mordor Intelligence’s proprietary estimation framework, updated with the latest available data and insights as of January 2026.
Global Agent Observability And Governance Market Trends and Insights
Drivers Impact Analysis*
| Driver | (~) % Impact on CAGR Forecast | Geographic Relevance | Impact Timeline |
|---|---|---|---|
| Accelerating Adoption of Autonomous AI Agents in Enterprise Workflows | +12.4% | Global, with concentration in North America and Asia-Pacific | Medium term (2-4 years) |
| Increasing Regulatory Scrutiny Around Responsible AI Deployment | +9.7% | Europe and North America lead, expanding to Asia-Pacific and Middle East | Long term (≥4 years) |
| Mainstream Shift to Cloud-Native Observability Toolchains | +7.2% | Global, strongest in North America and Europe | Short term (≤2 years) |
| Growing Complexity of Multi-Agent LLM Architectures | +6.8% | Global, early adoption in technology and BFSI sectors | Medium term (2-4 years) |
| Emergence of Agent-Level Security and Compliance Mandates | +5.3% | North America, Europe, and Asia-Pacific (Japan, Singapore) | Long term (≥4 years) |
| Venture Capital Funding Surge in AI Agent Ops Start-ups | +3.1% | North America and Europe, spill-over to Asia-Pacific | Short term (≤2 years) |
| Source: Mordor Intelligence | |||
Accelerating Adoption of Autonomous AI Agents in Enterprise Workflows
Fortune 500 deployment of autonomous agents climbed from 18% in early 2024 to 60% by December 2025, according to Microsoft investor disclosures. Agents now approve procurement, detect fraud, and review code, operating continuously without human checkpoints. Traditional monitoring captures latency and errors but fails to record reasoning chains or policy adherence. Salesforce responded by embedding decision-level telemetry in its Agentforce launch, setting a new market baseline. Financial regulators followed, with the Basel Committee’s January 2025 proposal requiring real-time oversight of automated credit decisions. This convergence of commercial scale-up and regulatory pressure elevates observability from a dev-tool purchase to a boardroom compliance priority.
Increasing Regulatory Scrutiny Around Responsible AI Deployment
The European Union’s AI Act, enforceable since August 2024, mandates technical documentation, human oversight, and audit trails for high-risk systems, with penalties up to 7% of global revenue.[1]Digital Strategy, “Regulatory Framework on AI,” EUROPA.EU The United Kingdom adopted a sector-specific model in March 2025, assigning oversight to existing regulators. In the United States, the Office of Management and Budget memorandum M-24-10 requires every federal agency to inventory AI systems and assess their risks. Japan’s privacy commission issued guidelines in February 2025 demanding explainability for automated decisions. These overlapping regimes fragment compliance, rewarding platforms that support multi-jurisdiction policy templates and real-time dashboards.
Mainstream Shift to Cloud-Native Observability Toolchains
OpenTelemetry adoption reached 78% in 2025, up from 54% two years earlier, per the Cloud Native Computing Foundation’s annual survey. Semantic conventions ratified in June 2025 define attributes such as model version and prompt tokens, enabling consistent agent telemetry. Kubernetes now underpins 68% of AI workloads, and Datadog reported that customers ingested an average of 2.3 petabytes of observability data each month in Q4 2025. Standardized signals lower vendor lock-in risk, encouraging multi-cloud deployments and benefiting independent vendors that specialize in high-cardinality telemetry analytics.
Growing Complexity of Multi-Agent LLM Architectures
OpenAI’s Swarm framework popularized multi-agent orchestration in late 2024, yet lacked built-in observability, forcing custom logging. Google Cloud countered in May 2025 with Vertex AI Agent Builder, tracing that plots agent interactions as graphs, a feature cited by enterprises during procurement evaluations. A February 2025 Stanford study found 42% of multi-agent failures stemmed from agent-to-agent miscommunication, not model errors. Diverse metadata formats across providers complicate root-cause analysis, driving demand for unified inter-agent telemetry.
Restraints Impact Analysis*
| Restraint | (~) % Impact on CAGR Forecast | Geographic Relevance | Impact Timeline |
|---|---|---|---|
| Lack of Interoperability Standards for Agent Telemetry | -4.9% | Global, most acute in multi-vendor enterprise environments | Medium term (2-4 years) |
| High Total Cost of Ownership for Enterprise-Grade Platforms | -3.8% | Global, particularly impacting SMEs and cost-sensitive sectors | Short term (≤2 years) |
| Shortage of Talent Skilled in AI Governance Frameworks | -2.7% | Global, severe in Asia-Pacific and South America | Long term (≥4 years) |
| Data-Residency and Sovereignty Barriers in Cross-Border Deployments | -2.1% | Europe, Middle East, Asia-Pacific (China, India) | Medium term (2-4 years) |
| Source: Mordor Intelligence | |||
Lack of Interoperability Standards for Agent Telemetry
Agent-specific OpenTelemetry conventions remain in draft status as of March 2026, delaying cross-vendor compatibility.[2]Governance Draft, “Agent Telemetry Semantic Conventions,” OPENTELEMETRY.IO Enterprises, therefore, adopt proprietary libraries from Datadog, Dynatrace, or AWS, thereby increasing switching costs. A November 2025 CNCF survey showed 63% of multi-cloud AI users rank telemetry fragmentation among their top three pain points. Hybrid environments worsen the challenge when logs must be manually stitched across three platforms, extending mean-time-to-resolution and eroding confidence. Linux Foundation working groups launched in early 2026 aim to fast-track standardization, but consensus may take two years.
High Total Cost of Ownership for Enterprise-Grade Platforms
Usage-based pricing scales poorly as agent counts grow. Dynatrace’s enterprise tier averages USD 0.08 per agent-hour, or USD 70,080 annually for 100 always-on agents. Datadog adds a 30% surcharge for its AI Observability module. SMEs often use open-source tools like Grafana, yet the Linux Foundation estimates that 1.5 full-time engineers per 500 monitored services are needed to self-host observability stacks. Bundled cloud options cut unit costs but introduce platform lock-in, leaving buyers with complex trade-offs between price and portability.
*Our forecasts treat driver/restraint impacts as directional, not additive. The impact forecasts reflect baseline growth, mix effects, and variable interactions.
Segment Analysis
By Component: Services Surge as Complexity Outpaces Packaged Solutions
Software platforms represented 68.32% of 2025 revenue, reflecting enterprises that rushed to instrument AI agents with ready-made dashboards and OpenTelemetry collectors. Vendors such as Datadog and Dynatrace launched plug-ins for LangChain, AutoGPT, and Microsoft Semantic Kernel, shortening implementation timelines.[3]Product Documentation, “AI Observability Connectors,” DATADOGHQ.COM Yet large organizations soon discovered that aligning telemetry with internal risk and legal workflows required customization beyond shrink-wrapped features.
The services segment is forecast to grow at a 36.93% CAGR through 2031, indicating a structural shift toward outsourced expertise. Global consultancies now embed certified AI governance professionals into multi-quarter engagements, driving premium billable rates. Managed-governance offerings gained traction among financial institutions that cannot tolerate observability gaps, signaling that the market for agent observability and governance services will expand faster than the software base. Skills scarcity reinforces this trend because most enterprises lack internal talent to map policy controls to agent decision paths.


By Deployment Mode: Hybrid Architectures Balance Compliance and Cloud Economics
Cloud deployments accounted for 71.44% of 2025 spending, as organizations increasingly opted for hyperscaler integrations that come pre-packaged with solutions such as Amazon Bedrock, Azure OpenAI, and Google Cloud Vertex AI Agent Builder. The ability to scale elastically and the availability of rapid feature releases have made public-cloud telemetry the preferred starting point for many businesses. However, strict data-sovereignty regulations and the specific needs of latency-sensitive banking systems continue to pose challenges to complete migration to the cloud.
Hybrid architectures are anticipated to grow at a compound annual growth rate (CAGR) of 37.13%, making it the fastest-growing deployment model. In these architectures, collectors are deployed on-premise to filter sensitive data payloads before forwarding sanitized metadata to a cloud-based control plane. Solutions such as Cisco AppDynamics and IBM watsonx are prime examples of this split-plane design. Enterprises have reported that hybrid models enable them to comply with regional data protection regulations while still benefiting from advanced cloud analytics. This combination is expected to drive the expansion of the agent observability and governance market share attributed to hybrid deployments.
By Organization Size: SMEs Adopt Vendor-Embedded Agents Faster Than Custom Builds
Large enterprises accounted for 64.54% of the 2025 investment, funding thousands of agents across a wide range of workflows. These enterprises require unified role-based access control systems, multi-tenancy capabilities, and seamless integration with security event management tools. They also prioritize robust security measures to ensure compliance with industry standards and regulations. Additionally, such buyers are driving vendors to focus on platform consolidation, which helps reduce tool sprawl, streamline operations, and enhance overall operational efficiency.
Small and Medium Enterprises (SMEs) are anticipated to grow at a compound annual growth rate (CAGR) of 36.89%. The increasing adoption of subscription-based platforms, such as Salesforce Agentforce and ServiceNow Now Assist, is contributing to this growth. These platforms combine observability features with affordability, thereby lowering both cognitive and financial barriers for SMEs. Pricing models like Observe Inc.’s flat-rate tier of USD 10,000 per month are particularly appealing to mid-market Chief Financial Officers (CFOs). Consequently, the agent observability and governance market size for SMEs is expected to grow steadily, especially in regions where the pace of digital adoption surpasses the availability of specialized technology talent.
By Industry Vertical: Compliance-Driven Verticals Accelerate Spending
Banking, financial services, and insurance commanded 19.98% of 2025 revenue, the highest agent observability and governance market share among all end-user groups, because regulators now require constant audit trails for automated credit, trading, and fraud-detection agents. Large banks deploy real-time alerting and circuit-breaker policies that halt workflows whenever governance telemetry flags a violation, making premium enterprise platforms the default choice. Retail and e-commerce buyers focus on revenue impact, using telemetry to fine-tune dynamic pricing and personalized recommendations enabled by multi-agent orchestration. Manufacturing firms integrate agents into predictive-maintenance and supply-chain coordination systems, valuing uptime analytics and interoperability with shop-floor sensors. IT and telecom operators monitor agent-driven network optimization and customer-support tasks, prioritizing scalability and high-cardinality data analytics.
Healthcare and life sciences are projected to grow fastest at a 37.93% CAGR through 2031, lifting the agent observability and governance market size for this vertical ahead of other late adopters, such as government and defense. Hospitals need continuous monitoring to demonstrate that clinical-decision agents maintain diagnostic accuracy and safety once deployed, while medical-device manufacturers must log prediction-drift and bias metrics for post-market surveillance. Government and defense agencies emphasize air-gapped security and sovereign-cloud designs, adopting on-premises or hybrid telemetry collectors that comply with classified-data rules. Energy, transportation, and other heavy-asset sectors expand more cautiously but gradually embed agents into mission-critical control systems, driving incremental demand for low-latency, edge-friendly observability stacks. Across all industries, the broadening scope of regulatory mandates ensures that vertical-specific compliance templates remain a decisive feature in vendor selection.
Geography Analysis
North America led with 38.27% of 2025 revenue. Early-adopter technology companies, robust venture capital, and federal procurement mandates accelerate deployments. The Office of Management and Budget requires every agency to inventory AI systems, which funnels demand to observability vendors offering FedRAMP-ready solutions. Canada’s proposed PIPEDA amendments mirror European transparency rules, while Mexico’s manufacturing sector extends U.S. supplier observability requirements across the US-MCA corridor.
Asia-Pacific is projected to be the fastest-growing region, with a 41.53% CAGR. China’s State Council directive forces state-owned enterprises to implement governance frameworks by the end of 2025, and draft generative-AI security rules elevate observability to a cybersecurity issue. Japan’s March 2025 responsible-AI procurement guidelines accelerate adoption among electronics manufacturers and financial institutions. India’s Digital Personal Data Protection Act prompts public-sector pilots that require agent tracing, and Southeast Asian nations leapfrog on-premise limitations by adopting cloud-native stacks, expanding the agent observability and governance market across emerging economies.
Europe grows at a moderate yet steady pace, underpinned by the AI Act and rapid uptake of ISO/IEC 42001 certification. Germany’s technical guidelines require telemetry for high-risk public-sector AI, while the United Kingdom’s sector-based oversight requires vendors to deliver vertical-specific modules. Although the region’s overall spend trails North America, compliance complexity creates a durable revenue stream for full-stack governance suites. South America, the Middle East, and Africa maintain smaller bases but benefit from multinational rollouts that standardize observability policy templates across global footprints.

Competitive Landscape
Competition is moderate and fragmented, with no player exceeding 15% share in 2025. Incumbent APM vendors such as Dynatrace, Datadog, New Relic, and Splunk extended their existing platforms to include agent telemetry, leveraging installed bases to reduce customer acquisition costs. Hyperscalers integrated observability into AI development services: Amazon Bedrock Guardrails logs every policy decision, Azure embeds multi-agent tracing, and Google Cloud offers Vertex AI Agent Observability. These bundles encourage workload stickiness but invite scrutiny over lock-in.[4]Announcement, “Amazon Bedrock Guardrails,” AWS.AMAZON.COM
Specialist vendors differentiate through developer-first tooling and open-source integration. Honeycomb and Observe emphasize high-cardinality query languages, while Grafana Labs invests Series D funds to productize agent-native dashboards. Strategic acquisitions accelerate roadmaps: ServiceNow’s July 2025 purchase of a governance start-up folds real-time policy enforcement into Now Assist, and IBM fuses agent tracing with watsonx.governance templates for ISO 42001 compliance.
Investment remains brisk. Early-stage start-ups focusing on healthcare agent surveillance or cross-border data lineage garnered sizable Series A rounds in late 2025, signaling white-space demand. Collaboration within the Cloud Native Computing Foundation to finalize OpenTelemetry conventions will influence long-term positioning, as vendors shape standards that reinforce their architectures. Overall, competitive dynamics favor incumbents with platform breadth but leave room for nimble specialists that move faster on emerging requirements.
Agent Observability And Governance Industry Leaders
Dynatrace Inc.
Datadog Inc.
New Relic Inc.
Splunk Inc.
Grafana Labs Inc.
- *Disclaimer: Major Players sorted in no particular order

Recent Industry Developments
- March 2026: Datadog announced the general availability of its Agent Policy Enforcement module, enabling automatic workflow halts upon violation detection.
- February 2026: Microsoft Azure expanded its AI Observability suite with native multi-agent tracing across Semantic Kernel and third-party frameworks.
- January 2026: Grafana Labs raised USD 75 million in Series D funding led by Sequoia Capital to accelerate enterprise go-to-market and agent-specific telemetry capabilities.
- December 2025: Amazon Web Services launched Amazon Bedrock Guardrails with integrated CloudWatch telemetry for audit-ready content filtering.


Global Agent Observability And Governance Market Report Scope
The Agent Observability and Governance Market refers to the ecosystem of solutions and services designed to monitor, analyze, manage, and control the behavior, performance, and compliance of AI-driven agents and autonomous systems across enterprise environments.
The Agent Observability and Governance Market Report is Segmented by Component (Software, Services), Deployment Mode (Cloud, On-Premise, and Hybrid), Organization Size (Large Enterprises, and Small and Medium Enterprises), Industry Vertical (BFSI, Healthcare and Life Sciences, Retail and E-Commerce, Manufacturing, IT and Telecom, Government and Defense, and Other Industry Verticals), and Geography (North America, South America, Europe, Asia-Pacific, and Middle East and Africa). The Market Forecasts are Provided in Terms of Value (USD).
| Software |
| Services |
| Cloud |
| On-Premise |
| Hybrid |
| Large Enterprises |
| Small and Medium Enterprises |
| BFSI |
| Healthcare and Life Sciences |
| Retail and E-Commerce |
| Manufacturing |
| IT and Telecom |
| Government and Defense |
| Other Industry Verticals |
| North America | United States | |
| Canada | ||
| Mexico | ||
| South America | Brazil | |
| Argentina | ||
| Rest of South America | ||
| Europe | United Kingdom | |
| Germany | ||
| France | ||
| Italy | ||
| Spain | ||
| Rest of Europe | ||
| Asia-Pacific | China | |
| Japan | ||
| India | ||
| South Korea | ||
| Rest of Asia-Pacific | ||
| Middle East and Africa | Middle East | United Arab Emirates |
| Saudi Arabia | ||
| Rest of Middle East | ||
| Africa | South Africa | |
| Egypt | ||
| Rest of Africa | ||
| By Component | Software | ||
| Services | |||
| By Deploymnt Mode | Cloud | ||
| On-Premise | |||
| Hybrid | |||
| By Organization Size | Large Enterprises | ||
| Small and Medium Enterprises | |||
| By Industry Vertical | BFSI | ||
| Healthcare and Life Sciences | |||
| Retail and E-Commerce | |||
| Manufacturing | |||
| IT and Telecom | |||
| Government and Defense | |||
| Other Industry Verticals | |||
| By Geography | North America | United States | |
| Canada | |||
| Mexico | |||
| South America | Brazil | ||
| Argentina | |||
| Rest of South America | |||
| Europe | United Kingdom | ||
| Germany | |||
| France | |||
| Italy | |||
| Spain | |||
| Rest of Europe | |||
| Asia-Pacific | China | ||
| Japan | |||
| India | |||
| South Korea | |||
| Rest of Asia-Pacific | |||
| Middle East and Africa | Middle East | United Arab Emirates | |
| Saudi Arabia | |||
| Rest of Middle East | |||
| Africa | South Africa | ||
| Egypt | |||
| Rest of Africa | |||


Key Questions Answered in the Report
How fast is global demand for tools that monitor and govern autonomous AI agents growing?
The agent observability and governance market is projected to expand at a 38.69% CAGR from 2026 to 2031, rising from USD 1.68 billion in 2026 to USD 8.62 billion in 2031.
Which deployment model shows the strongest growth outlook?
Hybrid architectures are expected to record a 37.13% CAGR because they let regulated sectors balance data-residency mandates with cloud scalability.
What factors make services the high-growth component segment?
Implementation complexity, skills scarcity, and regulatory customizations drive enterprises to rely on professional and managed services, resulting in a 36.93% CAGR for the segment.
Which region is set to grow quickest in adopting observability for AI agents?
Asia-Pacific is forecast to lead with a 41.53% CAGR through 2031 thanks to governance mandates in China, Japan, and India.
Why are small and medium enterprises accelerating adoption?
Vendor-embedded agents in SaaS platforms and flat-rate pricing reduce technical and cost barriers, pushing SME spending at a 36.89% CAGR.
What is the biggest restraint hampering market expansion?
The lack of finalized interoperability standards forces buyers into proprietary telemetry formats, inflating switching costs and slowing multi-vendor strategies.
Page last updated on:


