
Africa Wire and Cable Market Size and Share
Market Overview
| Study Period | 2020 - 2031 |
|---|---|
| Forecast Data Period | 2026 - 2031 |
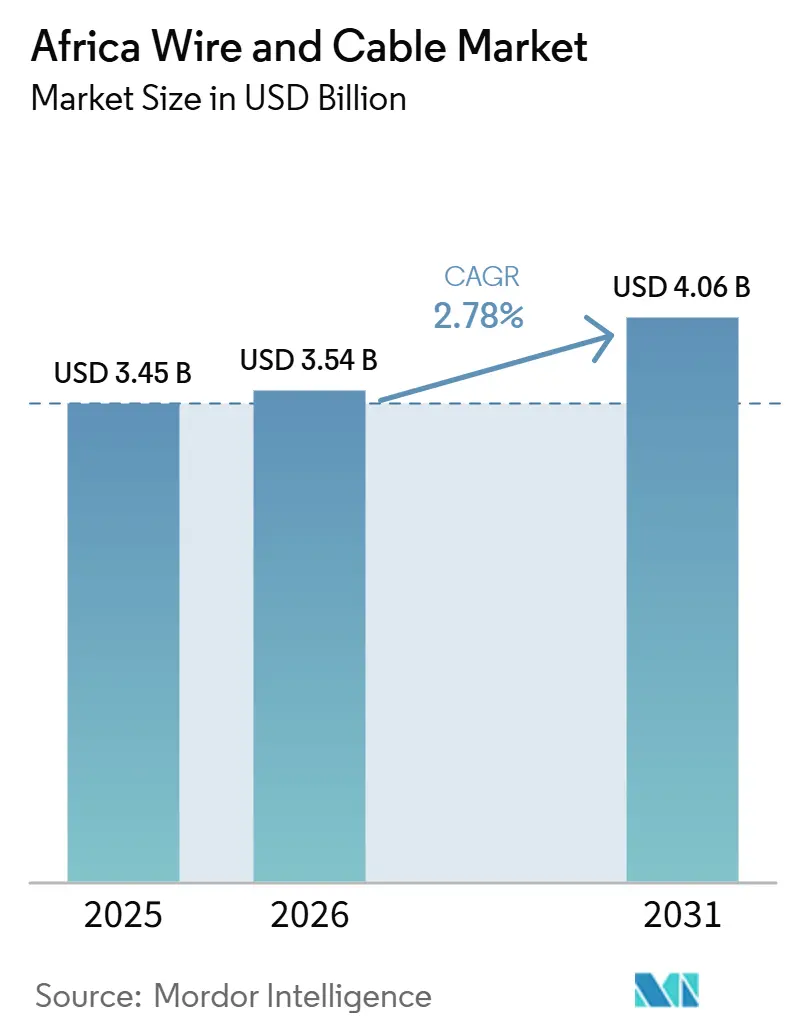
| Base Year Market Size (2025) | USD 3.45 Billion |
| Market Size (2026) | USD 3.54 Billion |
| Market Size (2031) | USD 4.06 Billion |
| Growth Rate (2026 - 2031) | 2.78 % |
| Market Concentration | Medium |
Major Players *Disclaimer: Major Players sorted in no particular order Image © Mordor Intelligence. Reuse requires attribution under CC BY 4.0. | |
Africa Wire and Cable Market Analysis by Mordor Intelligence
The Africa wire and cable market size was valued at USD 3.45 billion in 2025 and estimated to grow from USD 3.55 billion in 2026 to reach USD 4.06 billion by 2031, at a CAGR of 2.78% during the forecast period (2026-2031). Public electrification programs continued to support a broad base of demand for power, distribution, and connection cables across the continent. Regional transmission projects also required specialized cable systems, while renewable projects increased the need to connect remote generation sites to cities and industrial areas. Digital infrastructure added a separate source of demand through subsea cable landings, terrestrial fiber routes, and data center construction. Manufacturers, therefore, faced a market with stable utility demand and rapidly moving digital investment, although material prices, financing costs, and cable theft posed operating risks. The Africa wire and cable market also rewarded suppliers that could meet local certification rules, reduce delivery times, and supply products for both conventional grids and newer network designs.
Key Report Takeaways
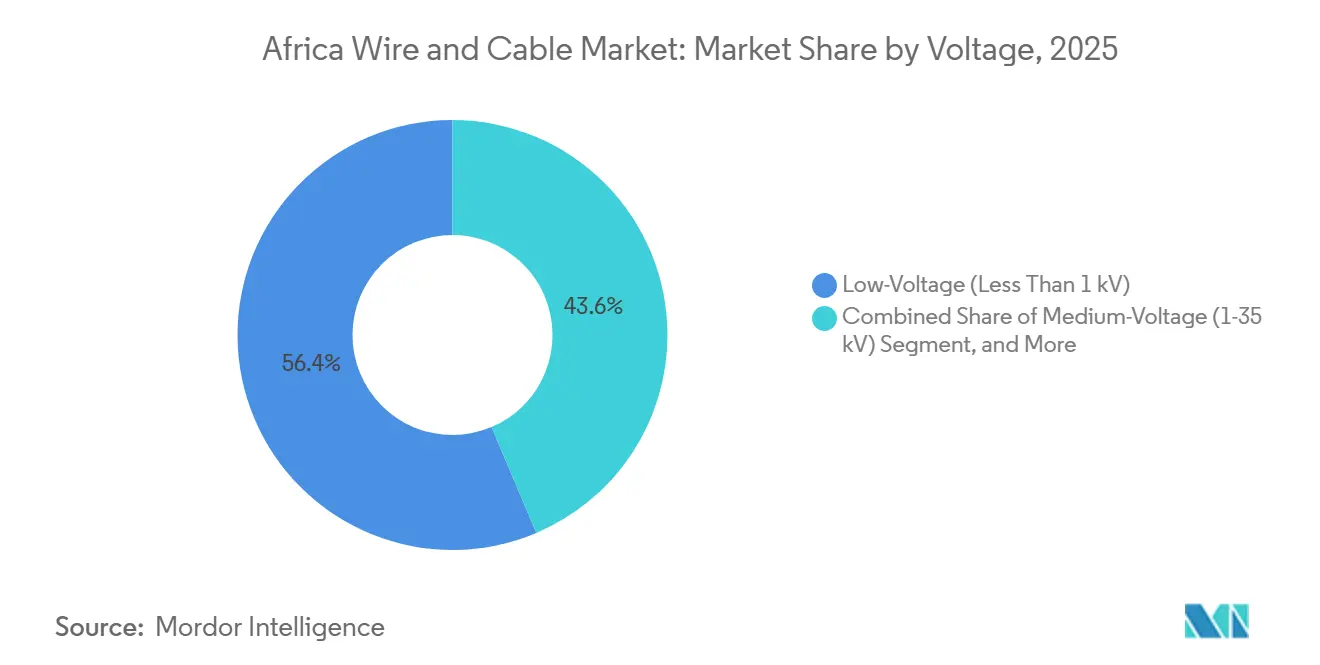
- By voltage, Low-Voltage cable held 56.38% of the Africa wire and cable market share in 2025, while Extra- and High-Voltage cable is projected to expand at a 3.24% CAGR through 2031.
- By cable type, Power Cable accounted for 64.72% of the Africa wire and cable market size in 2025, while Fiber-Optic Cable is projected to record a 3.37% CAGR through 2031.
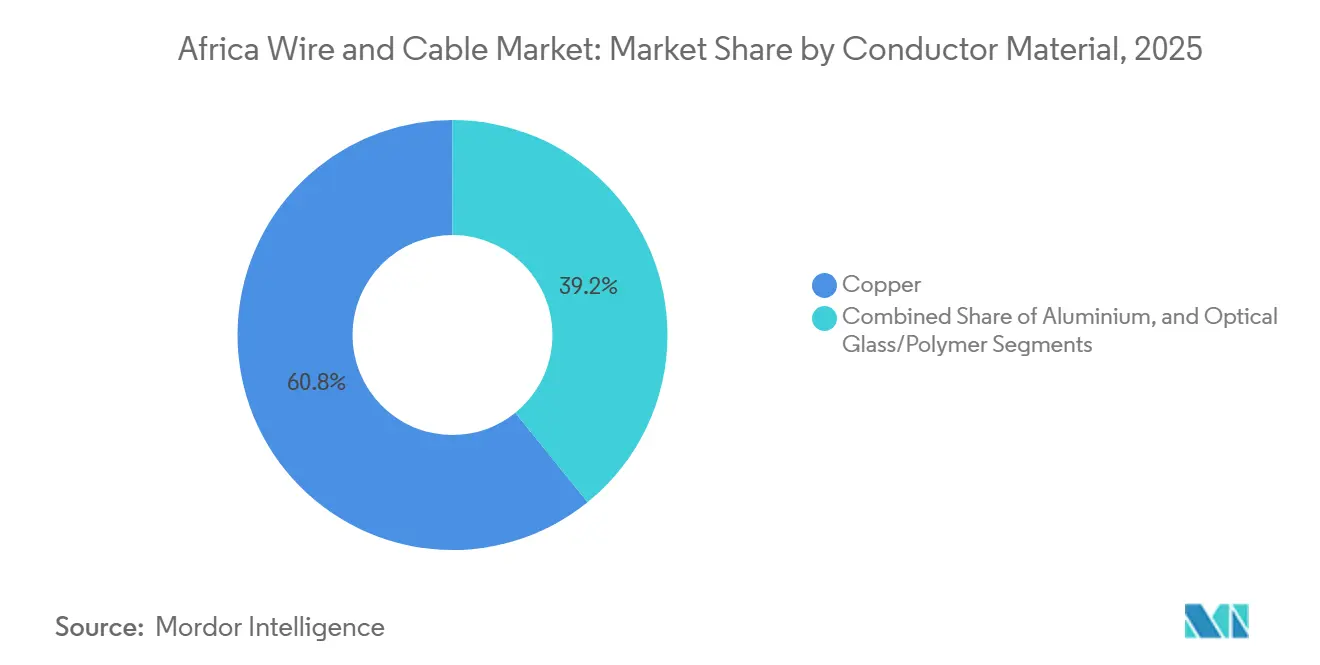
- By conductor material, Copper held 60.81% revenue share in 2025, while Optical Glass and Polymer are expected to grow at a 3.08% CAGR through 2031.
- By installation type, Overhead installation captured 59.43% of revenue share in 2025, while Underground installation is projected to grow at a 2.96% CAGR through 2031.
- By end-user vertical, Power Infrastructure, Utilities, and Renewables accounted for 32.84% of revenue in 2025, while Telecommunications and Data Centers are expected to expand at a 3.41% CAGR through 2031.
- By insulation, Insulated cables accounted for 88.96% revenue share in 2025 and are projected to grow at a 2.85% CAGR through 2031.
- By geography, South Africa held 22.48% revenue share in 2025, while the Egypt is expected to grow at a 3.12% CAGR through 2031.
Note: Market size and forecast figures in this report are generated using Mordor Intelligence’s proprietary estimation framework, updated with the latest available data and insights as of January 2026.
Market Trends and Insights
Drivers Impact Analysis of Africa Wire and Cable Market*
| Driver | (~) % Impact on CAGR Forecast | Geographic Relevance | Impact Timeline |
|---|---|---|---|
| Multilateral Financing for Cross-Border Power Pools and National Electrification | +0.55% | Pan-African, with concentrated impact across SADC, EAPP, WAPP, and CAPP corridors | Long term (≥ 4 years) |
| Renewable Energy and Grid-Connection Cable Build-Out | +0.48% | Egypt, Morocco, South Africa, Kenya, Ethiopia, with secondary spillover to Nigeria and Tanzania | Medium term (2-4 years) |
| Fiber Backbone, Submarine Landing, and Data Center Expansion | +0.42% | South Africa, Nigeria, Kenya, Egypt, Morocco, Ghana, and Tanzania | Short term (≤ 2 years) |
| Urbanization, Industrialization, and Construction Electrification | +0.38% | Nigeria, Kenya, Tanzania, Ghana, Egypt, and broader Sub-Saharan African urban corridors | Medium term (2-4 years) |
| Cable Theft, Nontechnical Losses, and Anti-Theft Network Replacement | +0.25% | South Africa, Nigeria, Ghana, and East Africa | Short term (≤ 2 years) |
| Local-Content Procurement and Import-Substitution Manufacturing | +0.20% | South Africa, Nigeria, Morocco, Kenya, and AfCFTA member states | Long term (≥ 4 years) |
| Source: Mordor Intelligence | |||
Multilateral Financing for Cross-Border Power Pools and National Electrification
Multilateral financing supported long-term demand for transmission and distribution cables across regional power pools. The World Bank approved USD 1.6 billion in 2025 to strengthen the Eastern Africa Power Pool through transmission networks, cross-border interconnection, and a day-ahead market. The program was designed to support more than 5,000 gigawatt-hours of annual cross-border electricity trade by 2031. The Cameroon-Chad interconnection also drew co-financing from the World Bank, the African Development Bank, the Islamic Development Bank, and the European Union, while the CAPP Master Plan was finalized in the second quarter of 2026.[1]World Bank, “Cameroon-Chad Power Interconnection Project,” World Bank These projects created demand during transmission construction, substation integration, and later distribution expansion. The Africa wire and cable market benefited because regional projects require common technical specifications and longer procurement programs than isolated local works.
Renewable Energy and Grid-Connection Cable Build-Out
Renewable energy investment increased the need for cable links between generation sites and demand centers. Africa invested USD 34 billion in clean power technologies from 2020 through 2025, with solar receiving 52% and onshore wind receiving 25%.[2]African Energy Chamber, “The State of African Energy 2026,” African Energy Chamber Many solar and wind resources are located far from major cities, which increases transmission requirements for each new project. This pattern supported demand for high-voltage systems, grid connections, and substation cable. Morocco's proposed Sila Atlantik corridor combined 15 gigawatts of renewable capacity with a planned 4,800-kilometer subsea link to Europe. The Africa wire and cable market, therefore, benefited from projects that required both generation-side connections and long-distance export infrastructure.
Fiber Backbone, Submarine Landing, and Data Center Expansion
Digital infrastructure created demand for fiber-optic cable in coastal and inland locations. Meta and its consortium partners completed the core 2Africa subsea system in November 2025, covering 33 countries across an initial 45,000-kilometer network. Seacom announced a 25,000-kilometer, 48-fiber-pair system in September 2025 for high-capacity AI workloads.[3]Seacom, “Unveiling Seacom 2.0,” Seacom Each landing station needs terrestrial feeder routes, and data center campuses need optical connections within and beyond their facilities. The Africa Data Center Association identified continuing data center development across the continent in 2026. This activity gave the Africa wire and cable market a growth path that was less dependent on traditional utility procurement. Fiber demand also reaches beyond coastal landings because new routes must connect cities, business districts, and enterprise networks. This creates a continuing need for network extensions after major subsea projects are completed.
Urbanization, Industrialization, and Construction Electrification
Urban growth increased demand for low-voltage, medium-voltage, and building cables. The OECD projected that Africa's urban population would rise from 700 million to 1.4 billion by 2050, while the urban share of the population would approach 60%.[4]OECD, “Africa’s Urbanisation Dynamics 2025,” OECD New housing, commercial space, and public infrastructure required distribution networks and internal wiring. The African Development Bank reported that continental manufacturing value added rose from USD 285 billion in 2020 to USD 351 billion in 2025. Factories, agro-processing facilities, and special economic zones required control, signal, and medium-voltage cable. The Africa wire and cable market also benefited when cities upgraded older overhead networks to meet higher loads and more formal building requirements.
Restraints Impact Analysis of Africa Wire and Cable Market*
| Restraint | (~) % Impact on CAGR Forecast | Geographic Relevance | Impact Timeline |
|---|---|---|---|
| Copper, Aluminum, and Polymer Price Volatility | -0.45% | Global input pressure, with strong effects in South Africa, Nigeria, Morocco, and Egypt | Short term (≤ 2 years) |
| Currency Depreciation and High Project Financing Costs | -0.38% | Nigeria, Ghana, and Sub-Saharan Africa, partly offset in Morocco and South Africa by DFI instruments | Medium term (2-4 years) |
| Fragmented Standards, Customs, and Cross-Border Logistics | -0.22% | Cross-border corridors and ECOWAS, EAC, and SADC trade routes | Long term (≥ 4 years) |
| Shortage of High-Voltage Jointing, Testing, and Installation Skills | -0.18% | Sub-Saharan Africa, with larger technical labor pools in Egypt and Morocco | Medium term (2-4 years) |
| Source: Mordor Intelligence | |||
Copper, Aluminum, and Polymer Price Volatility
Material costs remained a direct commercial risk for cable producers and project contractors. Copper rod accounted for 55-65% of raw material costs across many cable types, and limited refining outside Zambia and the Democratic Republic of Congo increased exposure to global pricing. Copper prices rose by 40% over 2025 and briefly exceeded USD 14,000 per ton in January 2026 before falling to USD 11,980 per ton. This movement put pressure on fixed-price contracts and working capital, especially for smaller manufacturers. Aluminum and insulation compounds added to the cost burden because they were also subject to global commodity and energy price movements. The Africa wire and cable market faced additional pressure as low-priced imports competed with locally manufactured products, which incurred higher compliance and logistics costs.
Currency Depreciation and High Project Financing Costs
Currency mismatch limited utilities' and contractors' ability to purchase imported cable and equipment. Dollar-denominated procurement became more expensive when local currencies weakened while project revenues remained in local currency. Nigeria's tariff shortfalls widened from NGN 140 billion in 2022 to NGN 1.9 trillion in 2024 and 2025, which reduced utility purchasing capacity. Local lending rates also increased the cost of financing large infrastructure projects. Development finance institution funding remained important because it offered lower borrowing costs than many domestic sources. The Africa wire and cable market could therefore see project timing change when public utilities lacked foreign exchange or could not carry the cost of hard-currency debt.
*Our forecasts treat driver/restraint impacts as directional, not additive. The impact forecasts reflect baseline growth, mix effects, and variable interactions.
Africa Wire and Cable Market Segment Analysis
By Voltage:
High-Voltage Corridors Reshape the Premium MixLow-Voltage cable held 56.38% of the Africa wire and cable market share in 2025, supported by residential wiring, last-mile distribution, and commercial construction. This installed-demand base reflected the continuing need to connect households and smaller businesses to electricity networks. Distribution expansion has a broad geographic footprint because it accompanies formal housing, retail development, and public facilities. These applications make demand less concentrated than transmission-led procurement. Low-voltage products also remained important during grid upgrades, as distribution networks require extensions, replacements, and new service connections. Medium-Voltage cable served industrial facilities, commercial districts, agro-industrial parks, and grid densification programs. National requirements in South Africa, Kenya, and Egypt made compliance capability important for suppliers competing in these applications.
Extra- and High-Voltage cable is projected to expand at a 3.24% CAGR from 2026 through 2031, making it the fastest-growing voltage category. The segment was supported by power pool interconnectors and renewable corridors that required specialized conductors and related accessories. Large transmission schemes also depended on substations, testing, and installation expertise. In the Africa wire and cable market, these factors favored suppliers with a record in technically demanding projects and certified quality systems.



By Cable Type:
Power Cables Anchor Demand as Fiber SurgesPower Cable accounted for 64.72% of the Africa wire and cable market size in 2025, making it the leading cable type by revenue. Electrification, grid renewal, and renewable power connections sustained their broad demand base. This category supplied the primary systems used for transmission, distribution, and major industrial power needs. Signal and Control Cable met requirements in refineries, mining sites, factories, and other process operations. Coaxial and Data Cable remained relevant for legacy telecommunications systems and urban surveillance installations.
Fiber-Optic Cable is projected to grow at a 3.37% CAGR through 2031, the highest rate among cable types. Subsea systems required terrestrial fiber routes after landing, and new data facilities needed dense internal and external optical connections. Local production was also becoming more important, as Coleman Wires and Cables commissioned a fiber-optic plant in Ogun State during 2025. The plant was described as having an annual capacity of 9 million fibers and was intended to serve up to 50% of continental fiber demand. Fiber investment broadened the Africa wire and cable market beyond power infrastructure and brought network operators, data center developers, and telecommunications firms into the buyer base.
By Conductor Material:
Copper Retains Dominance Amid Optical Glass GrowthCopper accounted for 60.81% of the conductor material segment in 2025 due to its electrical conductivity and established use in utility and industrial applications. The material was widely used where performance standards and operating reliability outweighed cost considerations. Its position also reflected supply chains built around conventional power cable designs. Copper remained important where specifications required reliable conductivity and performance under demanding operating conditions. Its broad use meant that cost changes could affect both manufacturers' margins and customers' purchasing decisions. However, regional manufacturers remained exposed to global price movements because refining capacity outside Zambia and the Democratic Republic of Congo was limited. This exposure shaped purchasing decisions, inventory management, and contract terms across the Africa wire and cable market.
Optical Glass and Polymer is expected to expand at a 3.08% CAGR through 2031, supported by subsea landings and terrestrial fiber expansion. The shift showed how digital infrastructure was altering material demand in cable procurement. Morocco backed a USD 20.6 million fiber-optic production plant in Berrechid in 2025 to reduce dependence on imported components. Aluminum served as a lower-cost alternative for overhead transmission and rural electrification projects where weight and per-kilometer economics were important. Suppliers able to source aluminum rod locally could benefit as AfCFTA rules of origin became more relevant to regional trade.
By Installation:
Overhead Networks Lead While Underground Gains MomentumOverhead installation accounted for 59.43% of revenue in 2025, as it remained the lower-cost approach for rural distribution systems. Utilities used overhead systems extensively, where long distances and limited budgets made trenching difficult. This installation method was particularly relevant to last-mile electrification and network extensions in less-dense areas. Submarine installation was smaller but carried strategic importance for lake crossings and Mediterranean interconnectors. It required specialized engineering and contractor capability that few firms could provide.
Underground installation is projected to grow at a 2.96% CAGR through 2031, supported by urban planning, fiber routes, and efforts to protect networks from theft. In 2025, Kampala directed telecom operators to move from overhead lines to underground utility ducts installed as part of road improvements. The Ministry of ICT monitored the first pilot migration corridor in April 2026. Urban authorities in Nairobi, Lagos, and Accra followed similar development priorities. The Africa wire and cable market grew as underground systems were selected, since they require durable cable, ducting coordination, and more extensive installation work.
By End-User Vertical:
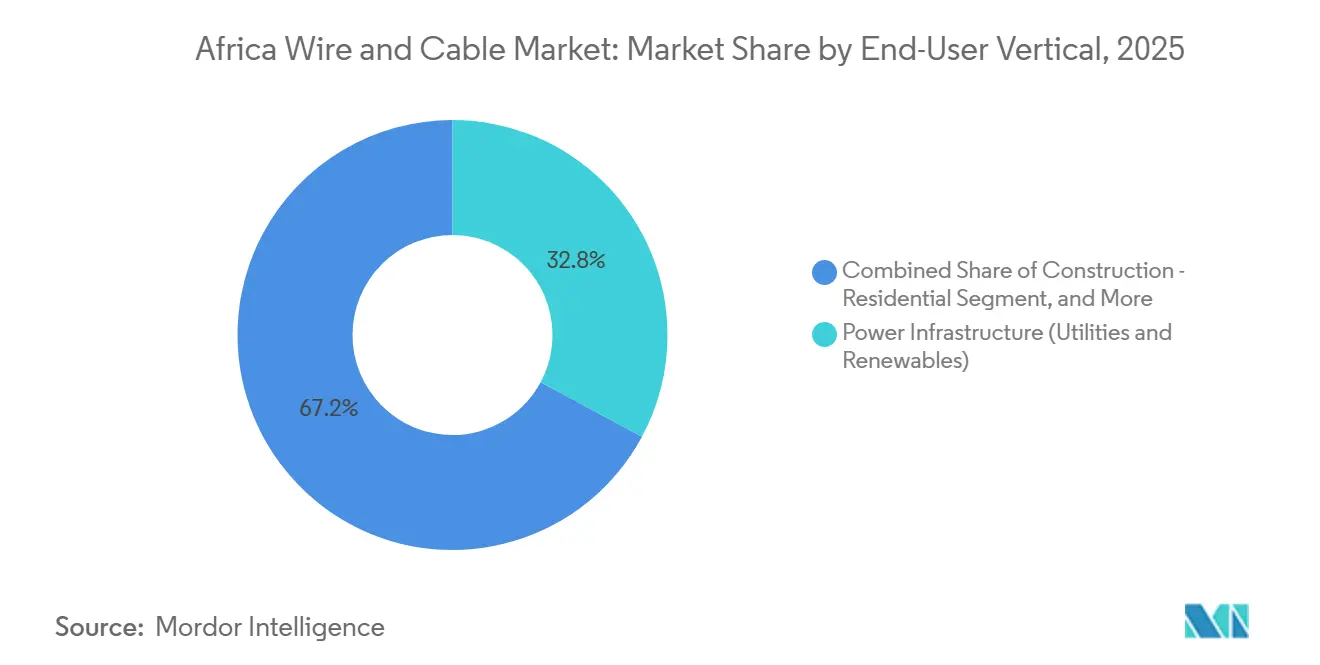
Utility Renewables Lead as Data Centers AcceleratePower Infrastructure, Utilities, and Renewables accounted for 32.84% of revenue in 2025, making it the largest end-user vertical. Long-standing utility procurement and new renewable transmission projects supported this position. The segment needed cable across multiple voltage classes, from local distribution to long-distance transmission. Residential and commercial construction also generated recurring demand for wiring and distribution products. Oil and Gas and Petrochemicals require specialty products for subsea, hazardous-area, and high-temperature applications.
Telecommunications and Data Centers are expected to expand at a 3.41% CAGR through 2031, the highest rate among end-user groups. Data center development in Johannesburg, Cape Town, Nairobi, and Lagos increased demand for fiber feeder routes and campus cable systems. Automotive and Mobility remained an emerging demand source as assembly activity expanded in Morocco, South Africa, and Ethiopia. Industrial Manufacturing required medium-voltage motor feeds and instrumentation wiring as manufacturing output grew. The Africa wire and cable market consequently depended on a wider set of customers than the utility sector alone.
By Insulation:
Insulated Cables Anchor the Market Across All VerticalsInsulated cables accounted for 88.96% of revenue in 2025 and are projected to grow at a 2.85% CAGR through 2031. This position reflected broader attention to safety, reliability, and compliance in urban and industrial installations. Network owners increasingly consider product performance alongside the initial purchase price when installing systems serving dense populations or high-value facilities. This favored insulated products in applications where failure would cause a larger service disruption. Insulated products served nearly every end-user group and voltage range. Cross-linked polyethylene, also known as XLPE, gained attention for medium- and high-voltage products because it offers thermal stability in hot operating conditions. The segment's scale made the availability and quality of insulation materials a major factor in manufacturer performance.
Non-insulated cable was used for specific overhead rural distribution applications, where bare aluminum conductors remained the least costly option. Its role was likely to narrow as utilities adopted theft-resistant, safer covered-conductor alternatives. Smart-grid designs that combine power conductors with optical sensing fibers were also entering pilot projects in South Africa and Kenya. These designs can support real-time network condition monitoring where operators invest in higher-value systems. The Africa wire and cable market offered suppliers an opportunity to combine standard products with advanced designs for network modernization.
Geography Analysis
South Africa and Egypt Wire and Cable Market
South Africa accounted for 22.48% of the African wire and cable market in 2025, supported by established utility infrastructure, renewable energy procurement, and a developed standards environment. Grid renewal and replacement demand supported certified cable purchases. Cable theft also created recurring replacement needs and raised operating costs for utilities and municipalities. Egypt is projected to grow at a 3.12% CAGR through 2031, supported by high-voltage transmission projects and renewable power targets. Its production base, led by Elsewedy Electric's Cairo-area operations, distinguished Egypt from countries that relied more heavily on imported cable.
Africa Wire and Cable Market
Nigeria combined a large demand potential with utility financing and currency constraints. Transmission Company of Nigeria repair spending linked to vandalism exceeded NGN 88 billion (USD 67 million) from 2021 through 2025, but tariff limits and currency weakness constrained major procurement programs. Ghana benefited from renewable investment and coastal infrastructure connected to submarine cable landing points. Morocco developed as both a cable customer and export manufacturing location through investment in medium-voltage and fiber production. Algeria remained an important market for state-led gas infrastructure, electrical industrial projects, and renewable development.
East and Southern Africa Wire and Cable Market
Kenya and Tanzania benefited from East African power pool integration and growing data center activity. Angola, the Republic of Congo, and Namibia contributed localized project demand through transmission expansion and grid connection programs. They shared a need for utility-grade products and reliable installation capacity, dependable service support, and qualified local technical teams in place. The Africa wire and cable market therefore depended on a geographically varied mix of national programs rather than on a single regional demand center.
Competitive Landscape
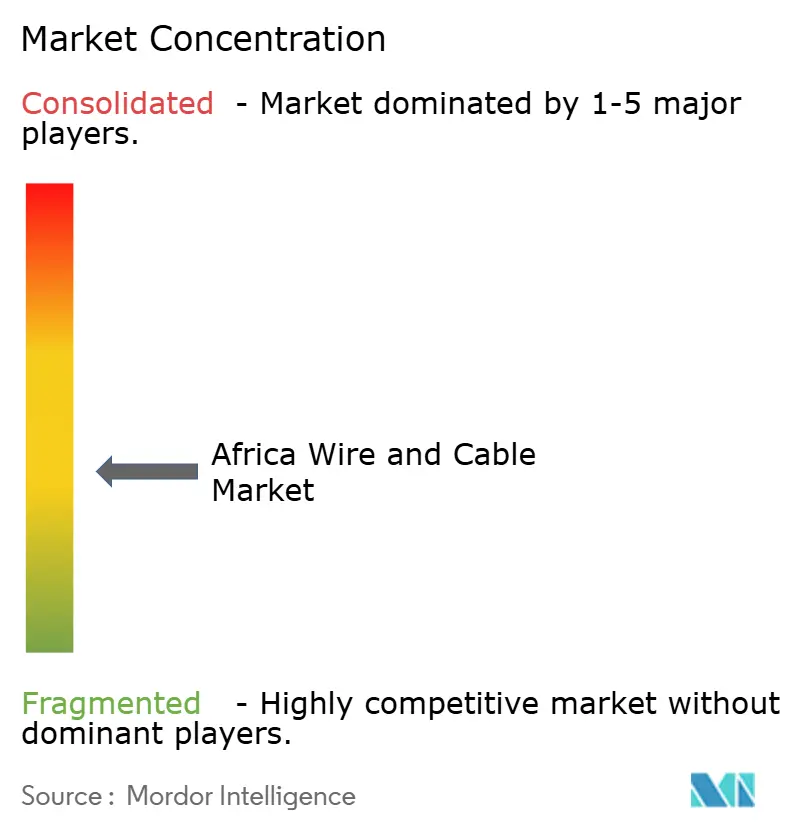
The Africa wire and cable market was moderately fragmented, with global majors and regional manufacturers serving different project types. Prysmian, Nexans, and NKT competed for high-voltage and submarine work, particularly in transmission infrastructure. Elsewedy Electric, CBI-electric African Cables, Aberdare Cables, and East African Cables Plc had local relationships, certification knowledge, and shorter supply routes for distribution and industrial products. Chinese producers, including Hengtong Optic-Electric, ZTT Group, and Huatong Group affiliates, expanded local manufacturing presence in Tanzania, Cameroon, and Nigeria. This structure left project awards dependent on technical requirements, local content conditions, and delivery capability rather than solely on price.
Local-content requirements encouraged vertical integration and regional manufacturing investment. Elsewedy Electric announced 3 Egyptian industrial projects in June 2026 that covered copper recycling, copper tube production, and aluminum rod production. The projects had combined investments exceeding USD 200 million and were intended to begin operations in the first quarter of 2028. Nexans had also signed agreements for a EUR 100 million investment, equivalent to USD 109 million at the 2025 average rate, in a third medium-voltage cable plant in Morocco. These moves showed how major suppliers sought to secure materials, improve regional supply, and qualify for local procurement opportunities.
Competitive opportunity was strongest in underground distribution, submarine interconnectors, and low-cost aluminum conductor systems for rural networks. Hybrid designs that combine XLPE power conductors with optical fibers offered a higher-value option for grid monitoring. Companies with IEC 60228 and ISO 9001 compliance were better positioned for projects financed by the World Bank and African Development Bank. Local manufacturers remained subject to technical certification and working-capital barriers, especially when public financing constraints delayed procurement cycles. Established utility relationships and a dependable regional supply chain therefore remained important.
Africa Wire and Cable Industry Leaders
Prysmian S.p.A.
Nexans S.A.
Sumitomo Electric Industries, Ltd.
LS Cable & System Ltd.
NKT A/S
- *Disclaimer: Major Players sorted in no particular order
Africa Wire and Cable Market Companies Covered in this Report
- Prysmian S.p.A.
- Nexans S.A.
- Sumitomo Electric Industries, Ltd.
- LS Cable & System Ltd.
- NKT A/S
- Elsewedy Electric S.A.E.
- CBI-electric: african cables
- Aberdare Cables (Pty) Ltd
- Malesela Taihan Electric Cable (M-TEC)
- Coleman Wires and Cables
- East African Cables Plc
- Nigerian Wire and Cable Plc
- MicCom Cables & Wires Ltd
- Riyadh Cables Group Company
- Ducab Group
- Hengtong Optic-Electric Co., Ltd.
- ZTT Group
- Corning Incorporated
- CommScope Holding Company, Inc.
- Nexans Maroc

Recent Industry Developments in Africa Wire and Cable Market
- July 2026: Elsewedy Electric announced new transmission and underground power infrastructure projects, including a 500 kV overhead transmission line project and underground power network upgrades.
- March 2026: Nexans Kabelmetal Ghana introduced Ghana's first Low Smoke Anti-Counterfeit cable, designed to improve fire safety while enabling digital product authentication through the Nexans mobile application.
- November 2025: Meta and consortium partners completed the core 2Africa subsea cable system, spanning 33 countries across an initial 45,000-kilometer network.


Africa Wire and Cable Market Report Scope
The Africa Wire and Cable Market Report is Segmented by Voltage (Low, Medium, and Extra- and High-Voltage), Cable Type (Power, Fiber-Optic, Signal/Control, and Coaxial/Data), Conductor (Copper, Aluminum, and Optical Glass/Polymer), Installation (Overhead, Underground, and Submarine), End-User (Construction - Residential, Construction - Commercial, Power Infrastructure (Utilities and Renewables), Telecommunications and Data Centers, Oil and Gas and Petrochemicals, Automotive and Mobility, and Industrial Manufacturing), Insulation (Insulated and Non-Insulated), and Geography (Algeria, Kenya, Morocco, South Africa, Nigeria, Ghana, Egypt, Tanzania, and Rest of Africa). The Market Forecasts are Provided in Terms of Value (USD).
| Extra- and High-Voltage (Greater Than 35 kV) |
| Medium-Voltage (1-35 kV) |
| Low-Voltage (Less Than 1 kV) |
| Power Cable |
| Fiber-Optic Cable |
| Signal and Control Cable |
| Coaxial and Data Cable |
| Copper |
| Aluminum |
| Optical Glass/Polymer |
| Overhead |
| Underground |
| Submarine |
| Construction - Residential |
| Construction - Commercial |
| Power Infrastructure (Utilities and Renewables) |
| Telecommunications and Data Centers |
| Oil and Gas and Petrochemicals |
| Automotive and Mobility |
| Industrial Manufacturing |
| Insulated |
| Non-Insulated |
| Algeria |
| Kenya |
| Morocco |
| South Africa |
| Nigeria |
| Ghana |
| Egypt |
| Tanzania |
| Rest of Africa |
| By Voltage | Extra- and High-Voltage (Greater Than 35 kV) |
| Medium-Voltage (1-35 kV) | |
| Low-Voltage (Less Than 1 kV) | |
| By Cable Type | Power Cable |
| Fiber-Optic Cable | |
| Signal and Control Cable | |
| Coaxial and Data Cable | |
| By Conductor Material | Copper |
| Aluminum | |
| Optical Glass/Polymer | |
| By Installation | Overhead |
| Underground | |
| Submarine | |
| By End-User Vertical | Construction - Residential |
| Construction - Commercial | |
| Power Infrastructure (Utilities and Renewables) | |
| Telecommunications and Data Centers | |
| Oil and Gas and Petrochemicals | |
| Automotive and Mobility | |
| Industrial Manufacturing | |
| By Insulation | Insulated |
| Non-Insulated | |
| By Country | Algeria |
| Kenya | |
| Morocco | |
| South Africa | |
| Nigeria | |
| Ghana | |
| Egypt | |
| Tanzania | |
| Rest of Africa |


Key Questions Answered in the Report
What is the size of the Africa wire and cable market?
The Africa wire and cable market was valued at USD 3.45 billion in 2025 and is estimated to reach USD 4.06 billion by 2031, at a 2.78% CAGR from 2026 through 2031.
What is driving demand for wire and cable across Africa?
Electrification, transmission interconnectors, renewable grid connections, urban construction, subsea landings, and data center development support demand.
Which cable type is expected to grow fastest in Africa?
Fiber-Optic Cable is projected to grow at a 3.37% CAGR through 2031 as terrestrial networks and data center connections expand.
Which end-user category leads cable demand in Africa?
Power Infrastructure, Utilities and Renewables, led with 32.84% revenue share in 2025 because it uses cable across transmission and distribution systems.
Why are underground cable installations growing?
Underground installation is projected to expand at a 2.96% CAGR through 2031 due to urban planning, fiber deployment, and efforts to protect networks from theft.
What are the main risks for cable suppliers in Africa?
Copper and other material price volatility, currency depreciation, utility financing limits, fragmented logistics, and installation skill shortages can delay projects and pressure margins.
Page last updated on:





