Africa Mobile Broadband Market Size and Share
Market Overview
| Study Period | 2019 - 2030 |
|---|---|
| Forecast Data Period | 2025 - 2030 |
| Historical Data Period | 2019 - 2023 |
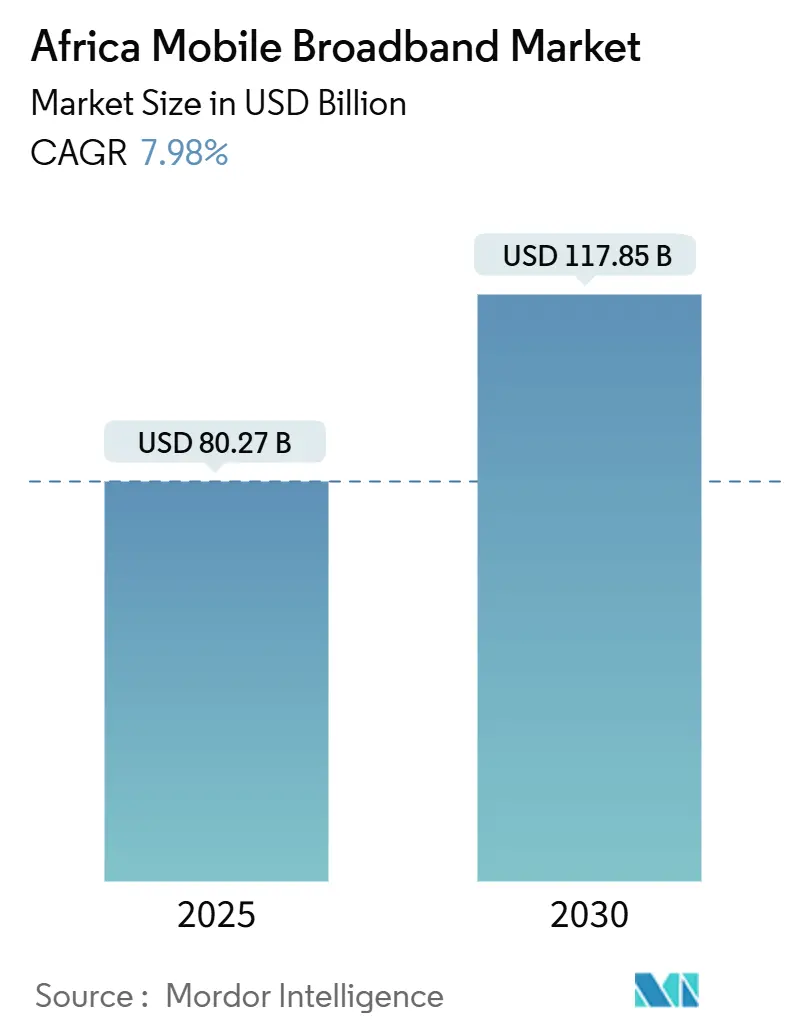
| Market Size (2025) | USD 80.27 Billion |
| Market Size (2030) | USD 117.85 Billion |
| Growth Rate (2025 - 2030) | 7.98% CAGR |
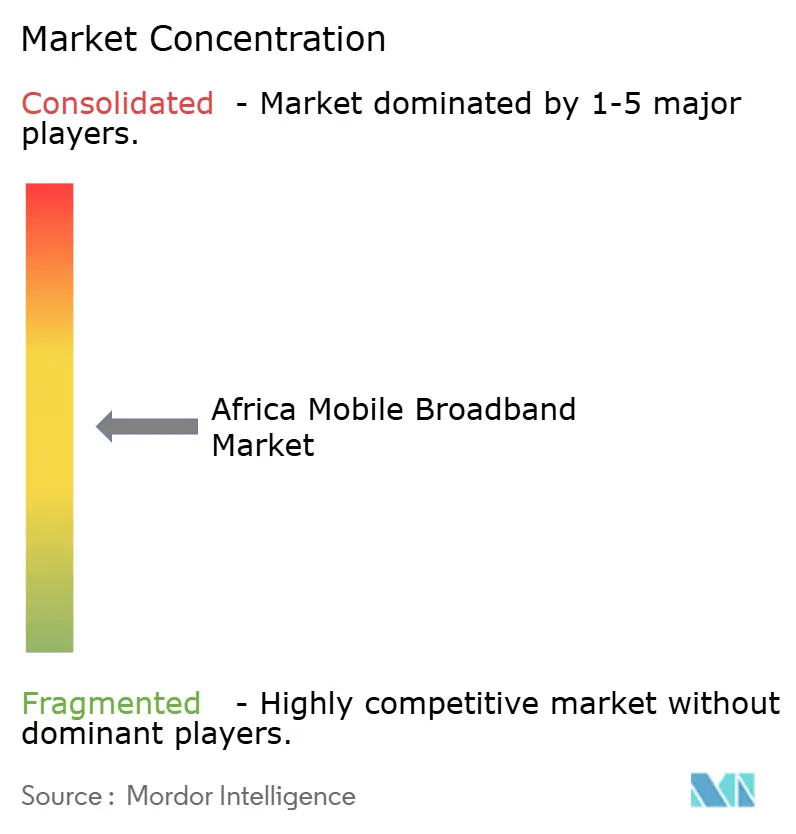
| Market Concentration | Medium |
Major Players *Disclaimer: Major Players sorted in no particular order Image © Mordor Intelligence. Reuse requires attribution under CC BY 4.0. | |
Africa Mobile Broadband Market Analysis by Mordor Intelligence
The Africa Mobile Broadband Market size is estimated at USD 80.27 billion in 2025, and is expected to reach USD 117.85 billion by 2030, at a CAGR of 7.98% during the forecast period (2025-2030).
Expansion centers on rising smartphone affordability, ever-lower data tariffs, and sustained 4G densification that together position mobile broadband as the continent’s dominant access technology. Operators’ capital-intensive 5G rollouts, tower-sharing models, and new submarine cables further shrink service costs, extend rural coverage, and unlock enterprise use cases that command higher ARPU. Structural headwinds remain—currency volatility, spectrum fees, and patchy rural electrification, but regulatory harmonization, along with cross-border infrastructure corridors, steadily reduces operating friction. Competitive intensity keeps margins tight yet encourages innovation in device financing, fixed-wireless substitution, and digital services bundling that broaden the total addressable base and stimulate incremental data demand across the Africa mobile broadband market.
Key Report Takeaways
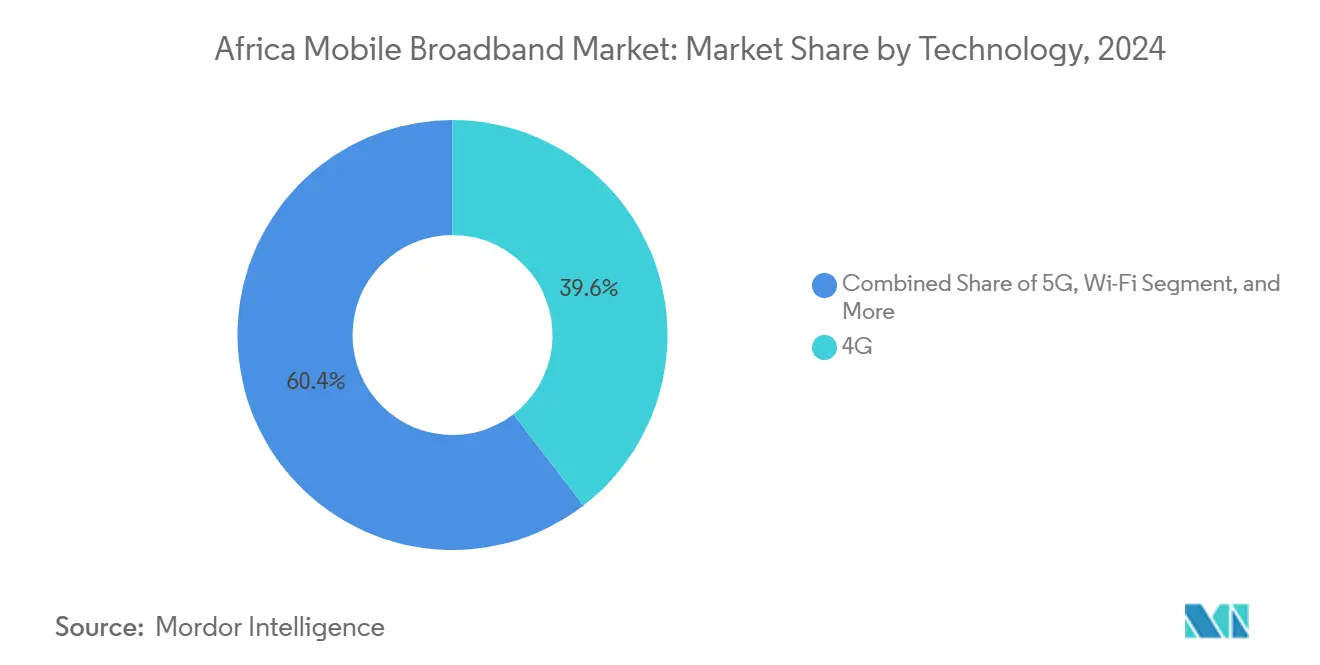
- By technology, 4G networks led with 39.57% of Africa mobile broadband market share in 2024, while 5G is advancing at a 31.37% CAGR through 2030.
- By service type, mobile data plans captured 79.87% revenue share in 2024; mobile hotspot services are projected to expand at a 23.88% CAGR to 2030.
- By end-user, consumer connections accounted for 81.46% of the Africa mobile broadband market size in 2024, whereas business applications record the highest forecast CAGR at 20.05%.
- By application, entertainment and media commanded 40.62% share of the Africa mobile broadband market size in 2024 and healthcare-plus-education is progressing at a 23.88% CAGR through 2030.
- By spectrum band, sub-1 GHz frequencies held 52.10% share in 2024 while mid-band spectrum is set to grow at a 14.52% CAGR.
- By geography, Nigeria contributed 22.94% share in 2024 and Kenya is projected to post the fastest 11.94% CAGR to 2030.
Note: Market size and forecast figures in this report are generated using Mordor Intelligence’s proprietary estimation framework, updated with the latest available data and insights as of January 2026.
Proportional positioning is established by comparing regional contributions against the global total, including that of Africa. The mobile broadband market share in our global report expresses these relative weights.
Africa Mobile Broadband Market Trends and Insights
Drivers Impact Analysis*
| Driver | (~) % Impact on CAGR Forecast | Geographic Relevance | Impact Timeline |
|---|---|---|---|
| Rapid smartphone adoption and falling handset ASPs | +1.8% | Pan-African, strongest in Nigeria, Kenya, Ghana | Short term (≤ 2 years) |
| Accelerated 4G/5G rollout by pan-African MNOs | +2.1% | Nigeria, South Africa, Kenya, Morocco | Medium term (2-4 years) |
| Intensifying price competition driving lower data tariffs | +1.2% | Nigeria, Kenya, Tanzania, Ghana | Short term (≤ 2 years) |
| Infrastructure-sharing & neutral-host tower models scaling rural coverage | +1.5% | Rural Africa, particularly East and West Africa | Long term (≥ 4 years) |
| Fixed-wireless broadband as substitute for limited fixed-line penetration | +0.9% | Urban and peri-urban Africa | Medium term (2-4 years) |
| Surge in new submarine cables & fiber corridors slashing backhaul costs | +1.3% | Coastal Africa with inland spillover effects | Long term (≥ 4 years) |
| Source: Mordor Intelligence | |||
Accelerated 4G/5G rollout by pan-African MNOs
Pan-African operators are front-loading capital toward radio upgrades that shorten coverage gaps and ready networks for ultra-low-latency services. MTN allocated USD 2.1 billion CAPEX in 2024, devoting 60% to 4G densification and 5G pilots across 19 markets. [1]MTN Group, “Integrated Annual Report 2024,” MTN Group, mtn.com Vodacom’s 5G signal now reaches 40% of South Africans and is expanding in Tanzania and Mozambique through shared-infrastructure models that trim build-out costs by 35%. [2]Vodacom Group, “FY 2024 Results,” Vodacom Group, vodacom.com Stand-alone 5G cores allow monetization of industrial IoT, edge analytics, and cloud gaming that deliver higher ARPU than mass-consumer plans.
Infrastructure-sharing and neutral-host tower models scaling rural coverage
Independent tower firms are lowering entry barriers for mobile operators in sparsely populated areas. IHS Towers manages 30,000 African sites and lifted rural tenancy ratios to 2.1 operators per tower in 2024, up from 1.4 in 2020. [3]IHS Towers, “Annual Report 2024,” IHS Towers, ihstowers.comAmerican Tower’s integration of Eaton Towers trimmed rural site opex by 25% through power system optimization. These neutral-host blueprints push coverage below the 5,000-population threshold, where standalone builds had failed to yield positive NPVs, thus unlocking latent demand in the Africa mobile broadband market.
Intensifying price competition lowering data tariffs
Aggressive tariff revisions are democratizing access. Nigerian average data prices slid 18% in 2024; Airtel’s weekend unlimited plan priced at USD 0.50 per GB reset nationwide benchmarks. Kenya’s Safaricom countered with micro-bundles costing USD 0.02 for 10 MB, drawing low-income users into the data economy. Such price erosion pressures EBITDA yet drives volume growth that sustains network utilization and total revenue.
Surge in new submarine cables & fiber corridors cutting backhaul costs
Wholesale bandwidth plunged as high-capacity cables went live. Google’s Equiano system introduced 20× existing capacity on the West Africa–Europe route, slicing Nigerian and Ghanaian transit prices by 40%. The 2Africa project, due 2026, will connect 33 markets and further commoditize international bandwidth. Lower backhaul costs enable operators to offer larger data bundles while protecting margins and accelerating digital inclusion across the Africa mobile broadband market.
Restraints Impact Analysis*
| Restraint | (~) % Impact on CAGR Forecast | Geographic Relevance | Impact Timeline |
|---|---|---|---|
| High spectrum licensing and renewal fees | -0.8% | Nigeria, South Africa, Kenya, Morocco | Medium term (2-4 years) |
| Limited rural electrification inflating site OPEX | -1.1% | Rural Sub-Saharan Africa | Long term (≥ 4 years) |
| Slow progress on cross-border roaming & spectrum harmonization | -0.6% | Pan-African, particularly landlocked countries | Long term (≥ 4 years) |
| Currency volatility and FX restrictions squeezing CAPEX budgets | -0.9% | Nigeria, Ghana, Egypt, Zambia | Short term (≤ 2 years) |
| Source: Mordor Intelligence | |||
Limited rural electrification inflating site opex
Roughly 600 million Africans lacked reliable grid power in 2024, obliging operators to rely on diesel gensets that drive site opex 60-80% above grid-connected levels. MTN’s rural Nigerian towers burn 2,500 liters of diesel monthly, equal to 40% of site costs and undermining net-zero pledges. Solar hybrids cut Vodacom’s fuel use 50% at 1,200 sites, yet high up-front capex and maintenance complexity limit rapid deployment, slowing rural expansion of the Africa mobile broadband market.
Currency volatility and FX restrictions squeezing CAPEX
African currency swings amplify equipment costs. Nigeria’s naira lost 35% against the USD in 2024, Ghana’s cedi 28%, inflating import prices for radios and fiber gear. Airtel Africa booked USD 180 million in FX losses, cutting effective CAPEX capacity by 15%. Central bank hard-currency rationing extends procurement lead times to 180 days, stalling 5G rollouts and fiber builds.
*Our forecasts treat driver/restraint impacts as directional, not additive. The impact forecasts reflect baseline growth, mix effects, and variable interactions.
Segment Analysis
By Technology: 5G Gains Strategic Momentum
Africa mobile broadband market size data underscore 4G’s 39.57% leadership in 2024, even as 5G lines compound at 31.37% through 2030. Operators prioritize 5G for enterprise verticals, such as mining, logistics, and fintech, where ultra-low latency and network slicing enable premium pricing. Rural footprints still hinge on LTE because sub-1 GHz propagation lowers tower density requirements and accelerates universal service targets.
Standalone 5G cores intersect with edge computing to support real-time analytics in smart factories and tele-health. Vodacom onboarded 2.1 million 5G users within 12 months of launch, validating pent-up demand for enhanced broadband. Satellite backhaul augments terrestrial links in landlocked regions, while Wi-Fi offload at 15,000 MTN hotspots manages urban congestion and preserves spectrum for mobility traffic.


By Service Type: Mobile Hotspot Adoption Surges
Mobile data plans remained the mainstay at 79.87% share in 2024, but hotspot subscriptions are growing 23.88% CAGR as households latch onto fixed-wireless alternatives. Safaricom’s hotspot base jumped 180% in 2024, powered by small-business POS needs and work-from-anywhere culture. VoLTE migrations free legacy spectrum and boost network efficiency, keeping voice relevant while pivoting toward data-centric revenues.
The Africa mobile broadband market size for hotspot services is projected to outstrip traditional voice by 2027 as device financing and e-SIM adoption simplify multi-device connectivity. Enterprise mobility suites bundle hotspot access with cloud apps, sharpening differentiation and lifting ARPU.
By End-User: Enterprise Digital Transformation Accelerates
Consumers owned 81.46% of connections in 2024, yet enterprise lines will grow faster at 20.05% CAGR, reflecting rising demand for mobile cloud links, IoT, and payment solutions. Orange MEA logged 28% enterprise revenue growth, with broadband representing 65% of that increase. SMEs tap mobile links for inventory and CRM systems, replacing costly fixed lines.
Enterprises pay 3.2× consumer ARPU for dedicated support, SLAs, and private APNs, making the segment pivotal for margin defense in a hyper-competitive Africa mobile broadband market. Device-as-a-service bundles, cybersecurity overlays, and managed SD-WAN further expand wallet share.
By Application: Essential Services Lead New Demand
Entertainment/media maintained 40.62% share in 2024 on the back of video streaming and gaming, yet healthcare-plus-education usage is scaling 23.88% CAGR as telemedicine and e-learning fill infrastructure gaps. Mobile money integration boosts e-commerce traction by smoothing payments, reinforcing data consumption growth.
Governments lean on mobile networks for e-governance and identity programs, deepening reliance on broadband availability. AR-enabled learning and remote diagnostics introduce bandwidth-heavy applications that move usage beyond entertainment and anchor sustained traffic growth across the Africa mobile broadband market.

By Spectrum Band: Mid-Band Balances Coverage and Capacity
Sub-1 GHz held 52.10% share in 2024, securing wide-area coverage with fewer sites, crucial for universal service mandates. Mid-band (1-6 GHz) spectrum will expand 14.52% CAGR, adding capacity in dense cities. Kenya’s 100 MHz auction raised USD 45 million, giving operators needed headroom for 5G in Nairobi and Mombasa.
Spectrum sharing eases financial strain, letting carriers co-utilize holdings while protecting QoS. The ITU’s Region 1 plan fosters cross-border coordination, mitigating interference and smoothing roaming, key for pan-African operators streamlining service portfolios.
Geography Analysis
Nigeria commanded 22.94% of the Africa mobile broadband market in 2024, fueled by a 51% smartphone penetration rate and four-operator rivalry that forced double-digit tariff cuts. MTN’s 4G network already covers 75% of the population, and Airtel’s discount bundles helped it lift share by 15 percentage points year-over-year. Persistent naira weakness inflates equipment imports, yet local manufacturing mandates stimulate domestic supply chains and build resilience into long-term expansion plans.
Kenya is the fastest-growing market with an 11.94% CAGR to 2030. Safaricom’s blend of broadband and mobile money keeps churn low and ARPU high, while its early-adopter 5G rollout spans Nairobi, Mombasa, and Kisumu. Government e-ID and digital-health initiatives sustain baseline demand, and new spectrum auctions create runway for capacity additions. South Africa retains scale advantages and superior fiber backhaul, although economic headwinds temper premium data adoption, nudging carriers toward bundle-based retention strategies.
Emerging clusters include Morocco, Ghana, Egypt, and Tanzania. Morocco’s 2024 5G auction jump-started commercial launches in Casablanca and Rabat, aligning with smart-city programs that amplify enterprise demand. Ghana lifted penetration 23% in 2024 on improved grid power and smartphone financing schemes. Smaller markets, Uganda, Zambia, Senegal—benefit from inland fiber corridors connected to new coastal cables, cutting transit costs and making rural broadband investments more viable, thereby broadening the cumulative Africa mobile broadband market footprint.
Mordor Intelligence examines the mobile broadband market across diverse other regional markets as well, including Europe, Asia, and North America.
Competitive Landscape
Africa’s mobile broadband arena shows moderate consolidation: MTN, Vodacom, and Airtel Africa operate across multiple jurisdictions, pooling procurement and accelerating new-technology diffusion. Competitive edge pivots on network quality; hence carriers invest heavily in 5G radios, carrier aggregation, and fiber backhaul upgrades delivered by vendors such as Ericsson and Huawei. Neutral-host towers and roaming alliances temper capital requirements while preserving service differentiation through specialized content bundles, fintech tie-ins, and zero-rating strategies.
Satellite newcomers position low-Earth-orbit constellations as complementary backhaul for remote zones, challenging incumbents in sparsely populated regions. Fixed-wireless specialists explore mmWave for enterprise campuses, while MVNOs leverage brand equity to acquire value-conscious segments without owning infrastructure. Regulators influence rivalry through spectrum pricing, local-ownership caps, and quality-of-service mandates that collectively shape capex decisions and market entries, keeping the Africa mobile broadband market dynamic yet disciplined.
Innovation partnerships bridge capability gaps: Safaricom teamed with AWS for edge nodes that lower latency for gaming and autonomous vehicles; Telkom SA cooperates with Microsoft Azure for hybrid cloud connectivity; and Cell C’s unlimited data offer targets remote learners and workers. As digital ecosystems mature, carriers bundle identity, payments, and cloud-storage features, seeking stickier revenues and reduced churn.
Africa Mobile Broadband Industry Leaders
MTN Group
Vodacom Group
Airtel
Maroc Telecom
Safaricom
- *Disclaimer: Major Players sorted in no particular order

Recent Industry Developments
- January 2025: MTN Group announced USD 800 million fiber build across Nigeria, South Africa, and Ghana, targeting 2 million premises by 2027.
- December 2024: Vodacom Group closed the USD 2.7 billion takeover of Vodafone Egypt, adding the North African giant to its footprint.
- November 2024: Airtel Africa secured USD 1.25 billion syndicated financing for network upgrades in 14 markets.
- October 2024: Orange MEA launched commercial 5G in Morocco and Senegal, focusing on enterprise verticals.


Africa Mobile Broadband Market Report Scope
| 4G |
| 5G |
| LTE |
| Wi-Fi |
| Other Technology |
| Mobile Data |
| Voice over LTE (VoLTE) |
| Mobile Hotspot |
| Consumers |
| Businesses / Enterprises |
| Entertainment and Media (Streaming, Gaming) |
| E-commerce and Retail |
| Social Media and Communication |
| Healthcare and Education |
| Other Applications |
| Sub-1 GHz (Coverage bands) |
| 1- 6 GHz (Mid-band) |
| >6 GHz mmWave and Terahertz |
| Algeria |
| Kenya |
| Morocco |
| South Africa |
| Nigeria |
| Ghana |
| Egypt |
| Tanzania |
| Rest of Africa (Tunisia, Uganda, Zambia, Senegal, and Others) |
| By Technology | 4G |
| 5G | |
| LTE | |
| Wi-Fi | |
| Other Technology | |
| By Service Type | Mobile Data |
| Voice over LTE (VoLTE) | |
| Mobile Hotspot | |
| By End-User | Consumers |
| Businesses / Enterprises | |
| By Application | Entertainment and Media (Streaming, Gaming) |
| E-commerce and Retail | |
| Social Media and Communication | |
| Healthcare and Education | |
| Other Applications | |
| By Spectrum Band | Sub-1 GHz (Coverage bands) |
| 1- 6 GHz (Mid-band) | |
| >6 GHz mmWave and Terahertz | |
| By Country | Algeria |
| Kenya | |
| Morocco | |
| South Africa | |
| Nigeria | |
| Ghana | |
| Egypt | |
| Tanzania | |
| Rest of Africa (Tunisia, Uganda, Zambia, Senegal, and Others) |


Key Questions Answered in the Report
What CAGR does Africa’s mobile broadband segment expect through 2030?
The market is projected to grow at 7.98% CAGR between 2025 and 2030, driven by 4G densification and accelerating 5G adoption.
Which country currently holds the largest share?
Nigeria leads with 22.94% share, supported by a 51% smartphone penetration rate and four-operator competition.
Which service type is the fastest growing?
Mobile hotspot subscriptions are forecast to rise at a 23.88% CAGR as fixed-wireless alternatives gain favor in underserved areas.
How fast is 5G expanding across Africa?
5G connections are set to grow at a 31.37% CAGR as operators deploy stand-alone cores and mid-band spectrum to serve enterprise and premium consumer use cases.
What is the biggest restraint on rural coverage?
Limited electrification inflates rural site opex by up to 80%, slowing rollout despite tower-sharing and renewable-energy pilots.
How are new submarine cables affecting costs?
Systems like Equiano have cut wholesale transit prices by about 40% in key markets, allowing operators to offer larger data bundles without eroding margins.
Page last updated on:


