Africa Fixed Broadband Market Size and Share
Market Overview
| Study Period | 2019 - 2030 |
|---|---|
| Forecast Data Period | 2025 - 2030 |
| Historical Data Period | 2019 - 2023 |
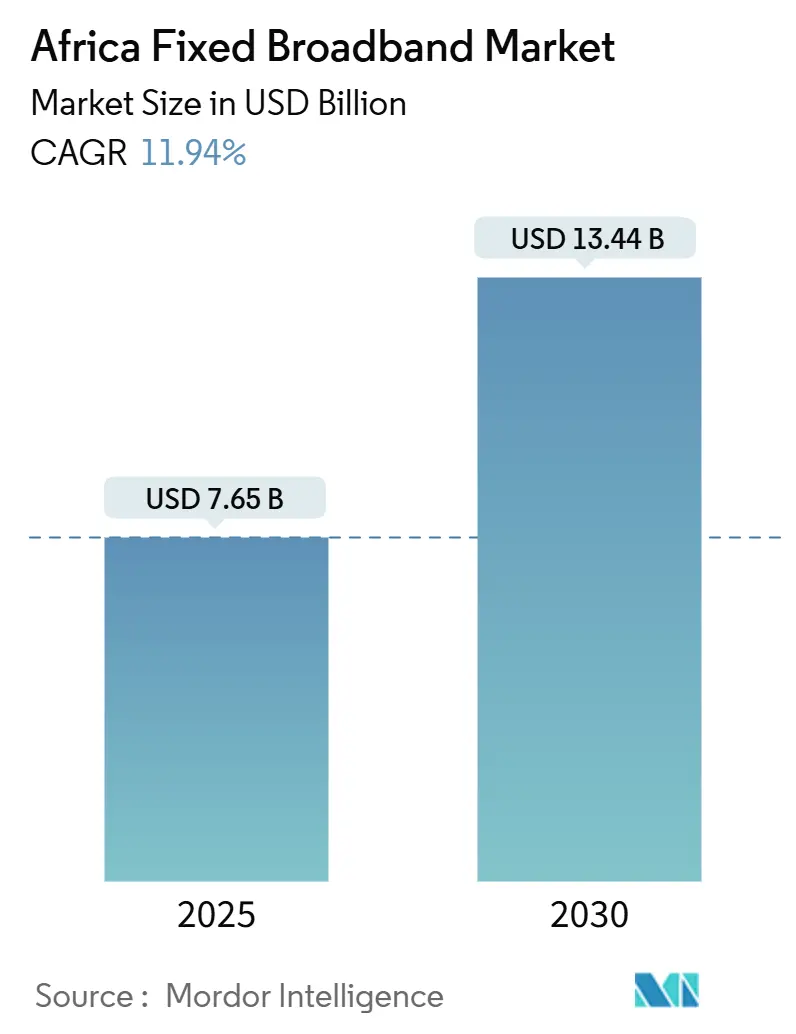
| Market Size (2025) | USD 7.65 Billion |
| Market Size (2030) | USD 13.44 Billion |
| Growth Rate (2025 - 2030) | 11.94% CAGR |
| Market Concentration | Medium |
Major Players *Disclaimer: Major Players sorted in no particular order Image © Mordor Intelligence. Reuse requires attribution under CC BY 4.0. | |
Africa Fixed Broadband Market Analysis by Mordor Intelligence
The Africa Fixed Broadband Market size is estimated at USD 7.65 billion in 2025, and is expected to reach USD 13.44 billion by 2030, at a CAGR of 11.94% during the forecast period (2025-2030).
Rising subsea capacity, expanding fiber footprints, and supportive public-sector policies are widening access while lowering wholesale IP transit costs, spurring customer upgrades and new subscriptions. Hyperscalers’ investments—Google’s Equiano cable among the most prominent—are already reducing retail tariffs and boosting speeds, encouraging operators to bundle multi-gigabit plans in urban corridors. Parallel government Universal Service Fund (USF) schemes are underwriting rural last-mile builds; these initiatives, together with infrastructure-sharing mandates, are narrowing the urban-rural divide and sustaining momentum in the Africa fixed broadband market. Competitive intensity is sharpening as fiber overbuilders scale rapidly, and content providers invest directly in terrestrial routes, eroding incumbent advantages but catalyzing innovation in value-added services and open-access wholesale models.
Key Report Takeaways
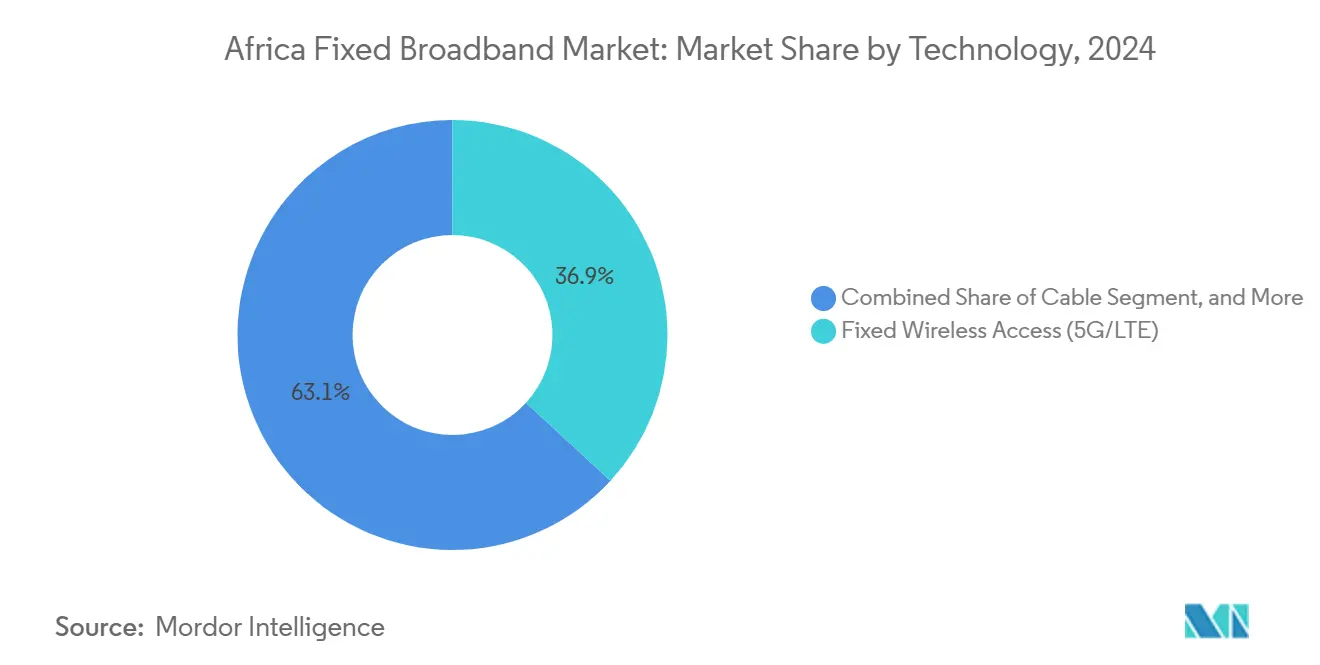
- By technology, Fixed Wireless Access (5G/LTE) led with 36.85% Africa fixed broadband market share in 2024, while Fiber to the Home/Premises is projected to expand at an 18.45% CAGR through 2030.
- By speed tier, plans up to 25 Mbps accounted for 49.59% market share in 2024, whereas services above 1 Gbps are advancing at a 26.14% CAGR to 2030.
- By end user, residential connections dominated with 83.98% share in 2024; the commercial segment is growing fastest at a 15.11% CAGR through 2030.
- By application, video streaming and entertainment held the largest 33.95% share in 2024, while smart-home and IoT connectivity is set to rise at a 17.76% CAGR to 2030.
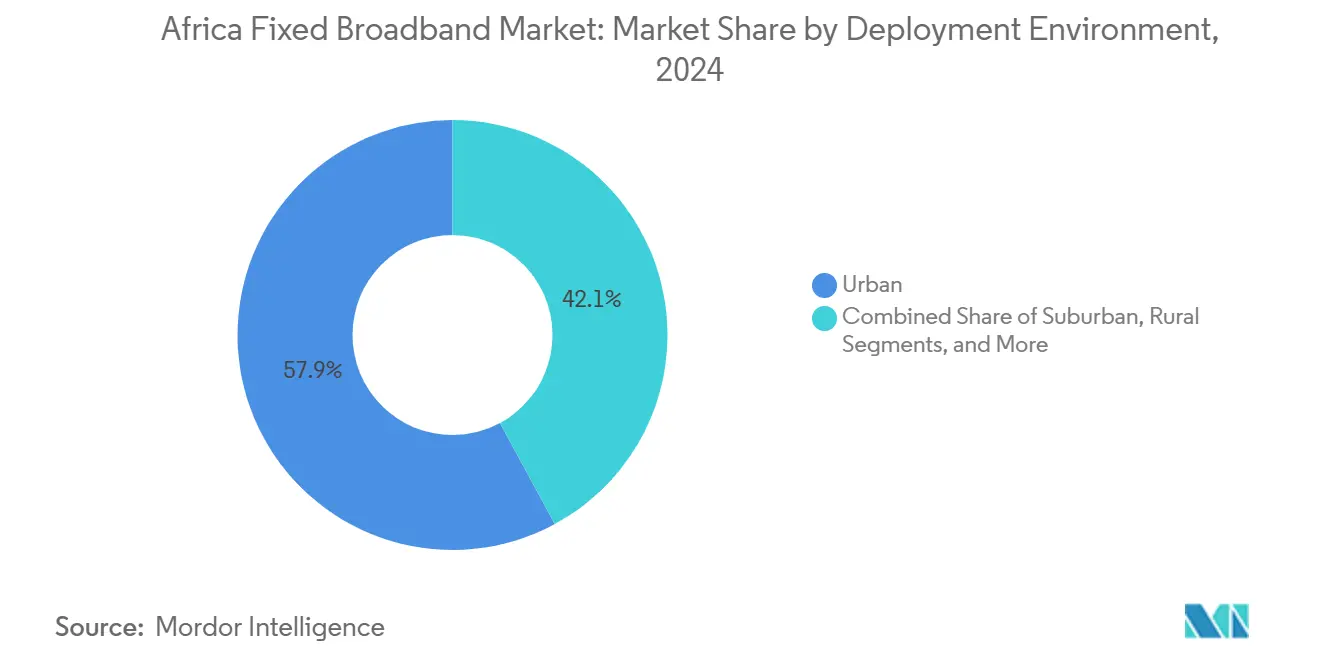
- By deployment environment, urban areas captured 57.89% share in 2024, whereas rural rollouts are accelerating at a 15.30% CAGR during the forecast period.
- By ownership, incumbent telcos maintained 47.87% share in 2024, yet competitive fiber overbuilders are scaling at an 18.76% CAGR through 2030.
- By geography, Egypt commanded 28.06% share in 2024, while Nigeria is forecast to register the highest 26.85% CAGR to 2030.
Note: Market size and forecast figures in this report are generated using Mordor Intelligence’s proprietary estimation framework, updated with the latest available data and insights as of January 2026.
Global valuation is built by aggregating outputs from multiple regions, with Africa forming one of the important contributors. Mordor Intelligence's global fixed broadband market size report represents that cumulative total.
Africa Fixed Broadband Market Trends and Insights
Drivers Impact Analysis*
| Driver | (~) % Impact on CAGR Forecast | Geographic Relevance | Impact Timeline |
|---|---|---|---|
| Rapid urban fiber roll-outs by incumbent telcos | +2.1% | Egypt, South Africa, Nigeria, Kenya | Medium term (2-4 years) |
| Government digital-inclusion and USF programs | +1.8% | Global, with concentration in Nigeria, Kenya, Ghana | Long term (≥ 4 years) |
| Sub-sea cable landings slashing IP transit costs | +2.4% | Coastal countries: Egypt, South Africa, Nigeria, Kenya, Morocco | Short term (≤ 2 years) |
| Fiber-to-tower backhaul catalyzing FWA economics | +1.6% | Urban centers across all markets | Medium term (2-4 years) |
| Infrastructure-fund buy-outs of open-access fiber | +1.3% | South Africa, Nigeria, Kenya, with expansion to secondary markets | Long term (≥ 4 years) |
| LEO constellations spurring complementary demand | +0.9% | Rural and remote areas across all countries | Medium term (2-4 years) |
| Source: Mordor Intelligence | |||
Rapid Urban Fiber Rollouts by Incumbent Telcos
Incumbent operators are accelerating fiber deployment to defend share against agile overbuilders, exemplified by MTN’s USD 16.9 million Gauteng upgrade and Vodacom’s ZAR 400 million Free State and Northern Cape build-outs.[1]Connecting Africa, “Equiano Cable Cuts Nigerian Transit Prices,” connectingafrica.com Densifying fiber in high-ARPU zones lowers churn and supports multi-gigabit plans that command premium pricing. Cheaper backhaul from new subsea capacity lets operators sustain margins while dropping tariffs, boosting uptake among data-hungry households. Safaricom’s 1 Gbps launches illustrate how incumbents monetize upgraded infrastructure, though rising debt loads could slow roll-outs in lower-density markets. Overall, rapid urban fiber expansion is enlarging the serviceable addressable market and reinforcing the growth path of the Africa fixed broadband market.
Government Digital-Inclusion and USF Programs
Policy makers are evolving USF schemes into broader digital-inclusion platforms that blend connectivity with device subsidies and skills training. Nigeria’s 90,000 km and Kenya’s 100,000 km national fiber blueprints anchor rural demand, enabling private players to justify last-mile CAPEX.[2]Developing Telecoms, “Subsea Outage Disrupts West Africa,” developingtelecoms.com The African Union targets a drastic cut in institutional bandwidth costs for education, injecting predictable wholesale demand. Regulatory enforcement—such as Chad requiring operator interconnection to national fiber—strengthens open-access economics. Implementation effectiveness varies, but the policy shift is materially enlarging the long-term rural opportunity for the Africa fixed broadband market.
Sub-sea Cable Landings Slashing IP Transit Costs
Hyperscaler-backed systems 2Africa, Medusa, and Equiano among them—are expanding international bandwidth sevenfold versus 2016, driving 5-10× wholesale price drops in coastal hubs. Lower transit costs let ISPs slash retail tariffs without eroding EBITDA, stimulating demand elasticity. The gains are most pronounced in Nigeria, Egypt, and South Africa where multiple landings enable route diversity. Yet outages, such as the March 2024 West Africa incident, spotlight resilience gaps that compel operators to invest in redundant paths. Net-net, subsea expansion is the single largest near-term catalyst for traffic growth and ARPU uplift in the Africa fixed broadband market.
Fiber-to-Tower Backhaul Catalyzing FWA Economics
Pairing fiber backhaul with 5G Standalone elevates Fixed Wireless Access from stopgap to strategic product. Helios Towers’ USD 850 million bond raise earmarks fresh capex for high-capacity sites that depend on fiber feeds. Orange’s 5G launches across Tunisia and other footprints showcase the model, delivering high-throughput home broadband without trenching every premise. Economics favor FWA where fiber-to-premises exceeds USD 1,000 per home, expanding viable coverage in peri-urban belts. In turn, stronger FWA uptake broadens the revenue base and accelerates payback on metro fiber, reinforcing the virtuous cycle underpinning the Africa fixed broadband market.
Restraints Impact Analysis*
| Restraint | (~) % Impact on CAGR Forecast | Geographic Relevance | Impact Timeline |
|---|---|---|---|
| High last-mile CAPEX in low-ARPU rural zones | -1.7% | Rural areas across all countries, particularly Tanzania, Uganda, Zambia | Long term (≥ 4 years) |
| Grid unreliability inflating power OPEX | -1.4% | Sub-Saharan Africa excluding South Africa | Medium term (2-4 years) |
| FX volatility on imported network hardware | -0.8% | All markets with floating exchange rates | Short term (≤ 2 years) |
| Municipal ROW and permitting bottlenecks | -0.6% | Urban centers in Nigeria, Kenya, Ghana | Medium term (2-4 years) |
| Source: Mordor Intelligence | |||
High Last-Mile CAPEX in Low-ARPU Rural Zones
Fiber-to-premises in rural Africa can top USD 1,000 per line while ARPU often sits below USD 10, destroying project economics. The Giga Rwanda study pegged USD 494.8 million to wire 3,551 schools at just 25 Mbps. Network-as-a-Service models like NuRAN’s revenue-share deal with MTN offer partial relief, but slim margins and uncertain uptake deter large-scale replication. Satellite entrants such as Starlink add pressure by offering faster time-to-market alternatives. Unless subsidy models deepen, costly last-mile builds will cap the rural expansion speed of the Africa fixed broadband market.
Grid Unreliability Inflating Power OPEX
Less than half the region enjoys stable grid supply, forcing operators to procure diesel gensets, batteries, and solar hybrids that can double total site opex.[3]TowerXchange, “Power Resilience Costs for African Operators,” towerxchange.comVodacom’s ZAR 120 million (USD 6.6 million) resilience program in Free State and Northern Cape underlines the scale of non-telecom spending required to keep networks online. Energy outlays can eat 30-40% of site revenue, lengthening payback and diverting cash from coverage expansion. Development-finance-backed green-power compacts are emerging, yet near-term relief is limited, tempering the attainable CAGR for the Africa fixed broadband market.
*Our forecasts treat driver/restraint impacts as directional, not additive. The impact forecasts reflect baseline growth, mix effects, and variable interactions.
Segment Analysis
By Technology: Fiber Gains Despite Wireless Dominance
Fixed Wireless Access controls the largest 36.85% slice of the Africa fixed broadband market. Operators favor it for rapid suburban coverage, but Fiber to the Home/Premises outpaces at an 18.45% CAGR, signaling future leadership. Cable and DSL linger where legacy plant exists, whereas LEO satellite fills remote gaps. The Africa fixed broadband market size attributable to FTTH/B is set to rise sharply as hyperscaler traffic and enterprise cloud workloads call for symmetric gigabit speeds. Competitive overbuilders, buoyed by infrastructure-fund capital, are trenching fiber in underserved metros, eroding incumbent hegemony and reshaping wholesale dynamics.
Fiber’s ascent reflects improving backhaul economics from subsea capacity, dropping right-of-way fees, and open-access regulations in South Africa and Kenya. Meta’s neutral OTNx backbones in Uganda and Nigeria exemplify third-party builds that lower capex barriers for retail ISPs. Conversely, FWA remains indispensable in peri-urban belts where fiber installation surpasses USD 1,000 per home, extending the Africa fixed broadband market’s reach without breaching affordability ceilings. Cable MSOs are repurposing DOCSIS 3.1 plant for affordable 200 Mbps plans, slowing subscriber churn, yet long-term viability hinges on fiber upgrades.


By Speed Tier: Multi-Gig Services Drive Premium Growth
Plans up to 25 Mbps held 49.59% share in 2024, but the 100 Mbps–1 Gbps bracket is swelling as streaming and remote work habits take root. Above-1 Gbps offerings register a 26.14% CAGR, the fastest among tiers, and already command double-digit share in Egypt and South Africa. Operators capitalize on falling IP transit and cheaper XGS-PON gear to upsell premium bundles, a trend set to enlarge the Africa fixed broadband market size tied to high-speed tiers. Institutional demand—from universities and cloud-savvy SMEs anchors higher capacity requirements, ensuring long runway for tier-mix uplift.
Affordability remains challenging; MTN Nigeria’s entry plan costs USD 21.89 monthly versus Sudan’s USD 2.40, underscoring wide income dispersion. Yet falling wholesale bandwidth and device financing schemes are nudging customers up the speed ladder. Government mandates for 100 Kbps per student in e-learning initiatives absorb capacity and stimulate capex in campus fiber rings, spreading multi-gig adoption to secondary cities. As operators refine segment-based pricing, speed tiers above 100 Mbps will increasingly power revenue growth in the Africa fixed broadband market.
By End User: Commercial Acceleration Amid Residential Dominance
Residential lines maintain an 83.98% majority, driven by video consumption and home gigabit upgrades. However, commercial connections are scaling at a 15.11% CAGR as SMEs digitize and public agencies migrate to cloud-first workflows. Dedicated fiber circuits with service-level guarantees fetch premiums, lifting blended ARPU and margin profiles across the Africa fixed broadband market. Government projects, such as Algeria’s 405-site cadastral SD-WAN and Nigeria’s e-government networks, supply predictable demand anchors that de-risk enterprise fiber capex.
Telcos are bundling managed security and UCaaS offerings to differentiate, following Djezzy’s 2025 cloud launch aimed at a USD 1.12 billion addressable pool. As more businesses demand virtual-private LAN services and edge compute, commercial share of the Africa fixed broadband market size is set to climb steadily, narrowing the residential-commercial mix gap by decade-end.
By Application: Smart Home IoT Emerges as Growth Driver
Video streaming dominates with 33.95% share, but smart-home and IoT traffic is expanding fastest at a 17.76% CAGR. Rising urban middle-class incomes fuel adoption of connected appliances and security devices that rely on low-latency links. Online gaming and immersive media also lift peak bandwidth demand, while telehealth and distance learning—capitalizing on public connectivity drives—diversify usage profiles. Operators are creating developer ecosystems via 5G labs, such as Orange Tunisia’s innovation hub, to seed applications that monetize higher-tier plans.
IoT growth hinges on affordable CPE and robust Wi-Fi 6 coverage inside homes. Wholesale fiber backbones and expanding edge data centers reduce latency, improving user experience and driving incremental ARPU. Consequently, application mix shifts are reinforcing the need for gigabit access and underpinning long-term service revenue expansion across the Africa fixed broadband market.
By Deployment Environment: Rural Connectivity Accelerates
Urban areas still host 57.89% of active lines thanks to density economics, yet rural deployments are gaining pace with a 15.30% CAGR. USF subsidies, concessional loans, and PPP frameworks are slashing first-cost barriers, while satellite and FWA bridge terrain constraints. Infrastructure sharing—Camtel’s fiber collaboration with Camwater in Cameroon illustrates the model—reduces trenching duplication. As operators roll truck-based fiber micro-trenching and aerial spans on power poles, coverage in small towns is rising, expanding the rural slice of the Africa fixed broadband market.
Policy support is critical: Kenya’s utilities joint-duct directive and Nigeria’s one-stop dig-once permitting have shortened project timelines. For ultra-remote villages, LEO satellites provide quick wins, but bandwidth caps keep them complementary. Over the horizon, declining fiber cost per meter and solar mini-grid roll-outs will further narrow the urban-rural gap.
By Ownership: Competitive Pressure Intensifies
Incumbent telcos held 47.87% of lines in 2024, down from 50% in 2023, as niche fiber overbuilders capture greenfield suburbs at an 18.76% CAGR. Open-access wholesale networks let ISPs lease capacity without sinking capex, fragmenting the Africa fixed broadband market. Content giants like Meta finance backbones to ensure QoS for their platforms, blurring the line between OTT and carrier. Cable MSOs exploit legacy coax to defend urban customers, whereas fixed-wireless ISPs ride 5G allocations for fast entry. Satellite operators, buoyed by regulatory approvals, expand direct-to-home services, adding yet another layer of competition.
Private equity and infrastructure funds—evident in British International Investment’s co-anchor role in Helios Towers’ bond—are injecting cheap capital, enabling aggressive build-outs that incumbents cannot easily match. The ownership mosaic will continue to diversify as asset-light models proliferate, compelling incumbents to double down on service differentiation and customer experience to preserve share within the Africa fixed broadband market.
Geography Analysis
Egypt leads with 28.06% of the Africa fixed broadband market, leveraging multiple subsea landings and robust metro fiber to serve domestic and transit traffic. Telecom Egypt’s 46% data-revenue jump in 2024 confirms strong demand, while the Coral Bridge and planned Algeria-Italy cables cement Egypt’s role as regional gateway. Although penetration is relatively high, upsell to gigabit plans and enterprise cloud interconnect keep growth stable.
Nigeria, the fastest-growing market at a 26.85% CAGR, benefits from sheer population and a 90,000 km national fiber plan that spurs open-access builds. Equiano’s landing slashed wholesale prices, fueling ISP competition and accelerating subscriber additions. Persistent grid unreliability and forex constraints inflate opex and import costs, yet regulatory willingness to license infrastructure sharers offsets some challenges, sustaining upside for the Africa fixed broadband market.
South Africa, Kenya, and Morocco anchor mature corridors where competitive fiber and FWA offers keep churn low and ARPU comparatively high. Teraco’s JB4 data-center expansion and Vodacom’s ZAR 400 million network upgrade underscore steady reinvestment that supports service quality. Kenya’s cross-border ring with Tanzania and Morocco’s planned Oracle Cloud regions amplify enterprise demand. Emerging plays—Ghana, Algeria, Tanzania—advance on the back of new national fiber schemes and cloud-first government policies, though fiscal limits temper rollout speed. The wider Rest-of-Africa segment, including Uganda and Senegal, taps development-bank financing and satellite backhaul to extend reach, collectively enlarging the Africa fixed broadband market’s footprint.
Coverage of the fixed broadband market by Mordor Intelligence spans a wide geographic footprint, with regional analysis available for North America, Europe, and Asia.
Competitive Landscape
Competition is moderate and rising as incumbents confront niche overbuilders, towercos, and hyperscaler-funded backbones. Google, Meta, and Microsoft co-finance subsea and terrestrial routes, creating neutral platforms that let smaller ISPs bypass incumbents, eroding legacy wholesale margins yet accelerating take-up of broadband services in the Africa fixed broadband market. Infrastructure funds favor tower and dark-fiber assets, offering incumbents asset-light models to monetize networks while freeing capital for service innovation.
Satellite entrants, notably Starlink, are gaining traction in underserved provinces, adding pricing pressure where terrestrial alternatives lag. Incumbents counter by bundling cloud, security, and IoT services—Vodacom, Orange, and MTN have all launched managed portfolios—to lock in enterprise customers. Regulatory pushes for infrastructure sharing and fair access stimulate additional entry, yet complex right-of-way rules in some cities still grant incumbents an edge. Over 2025–2030, M&A among mid-tier fiber ISPs is likely as scale becomes critical to sustain opex and capex cycles, gradually consolidating parts of the Africa fixed broadband market while leaving room for agile innovators.
Africa Fixed Broadband Industry Leaders
MTN Group Limited
Vodacom Group Limited
Safaricom PLC
Airtel Africa PLC
Telecom Egypt S.A.E.
- *Disclaimer: Major Players sorted in no particular order

Recent Industry Developments
- February 2025: Orange Tunisia launched commercial 5G on 400 sites and opened a 5G Lab for enterprise pilots.
- February 2025: Djezzy introduced cloud services in Algeria, targeting a USD 1.12 billion revenue pool by 2029.
- December 2024: Algeria’s DGDN connected 405 administrative sites via SD-WAN over Algérie Télécom fiber.
- December 2024: Axian Telecom explored a USD 500 million Jumia Technologies takeover, funded by a USD 600 million raise.


Africa Fixed Broadband Market Report Scope
| Fiber to the Home / Premises (FTTH/B) |
| Cable (DOCSIS) |
| Digital Subscriber Line (DSL) and Copper |
| Fixed Wireless Access (5G/LTE) |
| Satellite Broadband |
| Up to 25 Mbps |
| 100 Mbps - 1 Gbps |
| Above 1 Gbps (Multi-Gig) |
| Residential |
| Commercial |
| Video Streaming and Entertainment |
| Online Gaming and Immersive Media |
| Remote Work and Cloud Collaboration |
| Smart Home and IoT Connectivity |
| Telehealth and Distance Learning |
| Industrial and Enterprise Automation |
| Urban |
| Suburban |
| Rural |
| Remote and Hard-to-Reach |
| Incumbent Telcos |
| Competitive Fiber Overbuilders |
| Cable Multiple System Operators (MSOs) |
| Fixed Wireless ISPs |
| Satellite Network Operators |
| Algeria |
| Kenya |
| Morocco |
| South Africa |
| Nigeria |
| Ghana |
| Egypt |
| Tanzania |
| Rest of Africa (Tunisia, Uganda, Zambia, Senegal, and Others) |
| By Technology | Fiber to the Home / Premises (FTTH/B) |
| Cable (DOCSIS) | |
| Digital Subscriber Line (DSL) and Copper | |
| Fixed Wireless Access (5G/LTE) | |
| Satellite Broadband | |
| By Speed Tier | Up to 25 Mbps |
| 100 Mbps - 1 Gbps | |
| Above 1 Gbps (Multi-Gig) | |
| By End User | Residential |
| Commercial | |
| By Application | Video Streaming and Entertainment |
| Online Gaming and Immersive Media | |
| Remote Work and Cloud Collaboration | |
| Smart Home and IoT Connectivity | |
| Telehealth and Distance Learning | |
| Industrial and Enterprise Automation | |
| By Deployment Environment | Urban |
| Suburban | |
| Rural | |
| Remote and Hard-to-Reach | |
| By Ownership | Incumbent Telcos |
| Competitive Fiber Overbuilders | |
| Cable Multiple System Operators (MSOs) | |
| Fixed Wireless ISPs | |
| Satellite Network Operators | |
| By Country | Algeria |
| Kenya | |
| Morocco | |
| South Africa | |
| Nigeria | |
| Ghana | |
| Egypt | |
| Tanzania | |
| Rest of Africa (Tunisia, Uganda, Zambia, Senegal, and Others) |


Key Questions Answered in the Report
What is the current revenue value of the Africa fixed broadband market and its growth outlook?
It is valued at USD 7.65 billion in 2025 and is projected to reach USD 13.44 billion by 2030, posting an 11.94% CAGR.
Which technology segment is expanding the fastest?
Fiber to the Home/Premises is growing at an 18.45% CAGR as operators future-proof networks for multi-gigabit demand.
Why is Nigeria viewed as the most attractive growth market?
Its 26.85% CAGR outlook stems from population scale, a 90,000 km fiber program, and wholesale price cuts after the Equiano cable landing.
What key restraint could slow rural rollouts?
High last-mile CAPEX—often above USD 1,000 per premise—combined with low ARPU levels challenges investment returns.
How are hyperscalers reshaping competition?
Firms like Google and Meta fund subsea and terrestrial fiber backbones, creating neutral access routes that intensify retail ISP competition.
Which application segment shows the highest future upside?
Smart-home and IoT connectivity is accelerating at a 17.76% CAGR as middle-class households adopt connected devices.
Page last updated on:


