3D Printed Implants Market Size and Share
Market Overview
| Study Period | 2020 - 2031 |
|---|---|
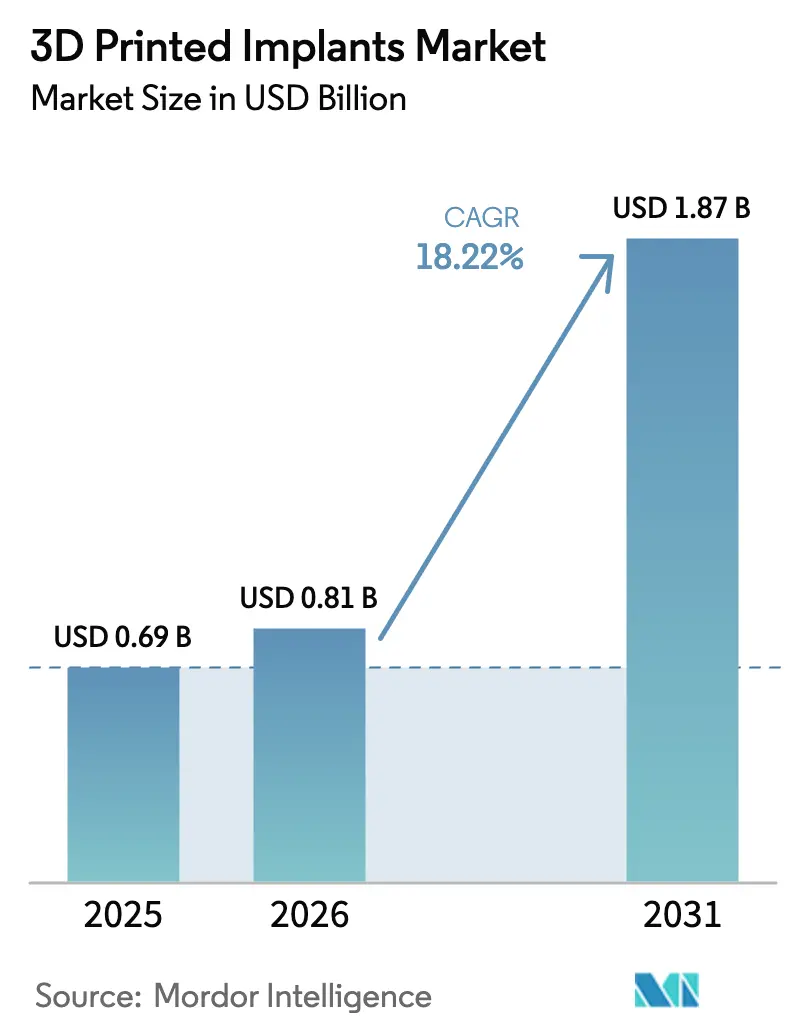
| Market Size (2026) | USD 0.81 Billion |
| Market Size (2031) | USD 1.87 Billion |
| Growth Rate (2026 - 2031) | 18.22% CAGR |
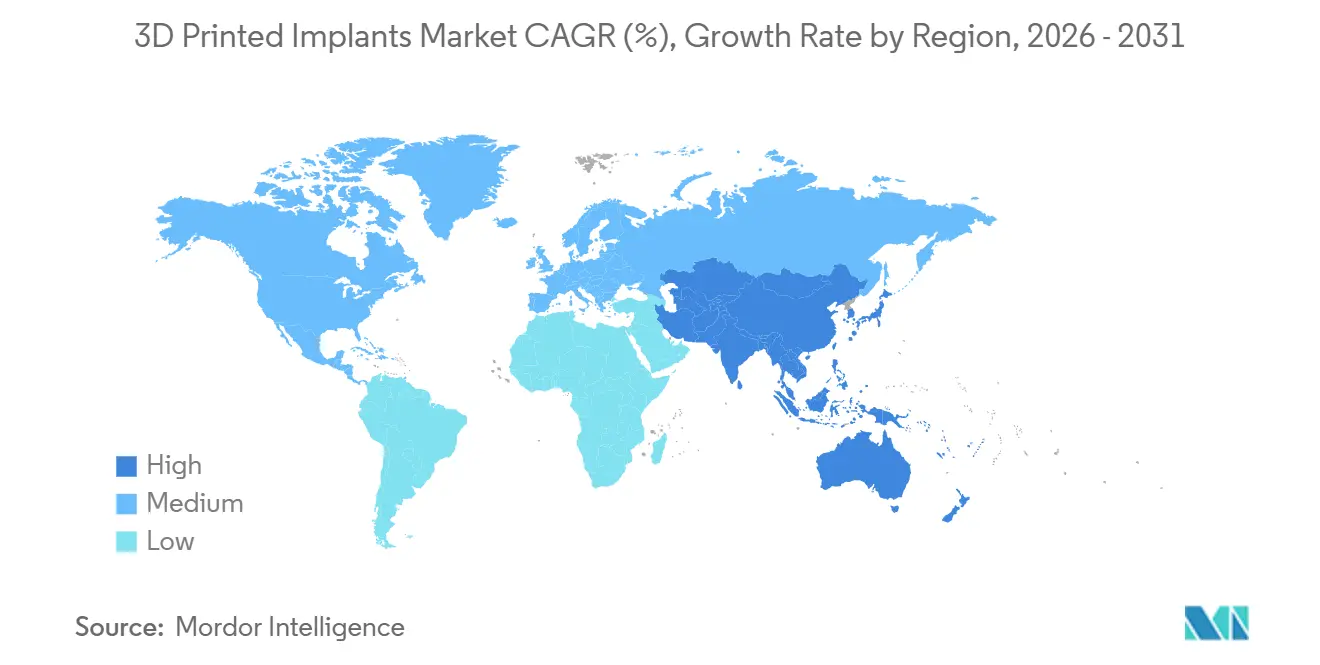
| Fastest Growing Market | Asia Pacific |
| Largest Market | North America |
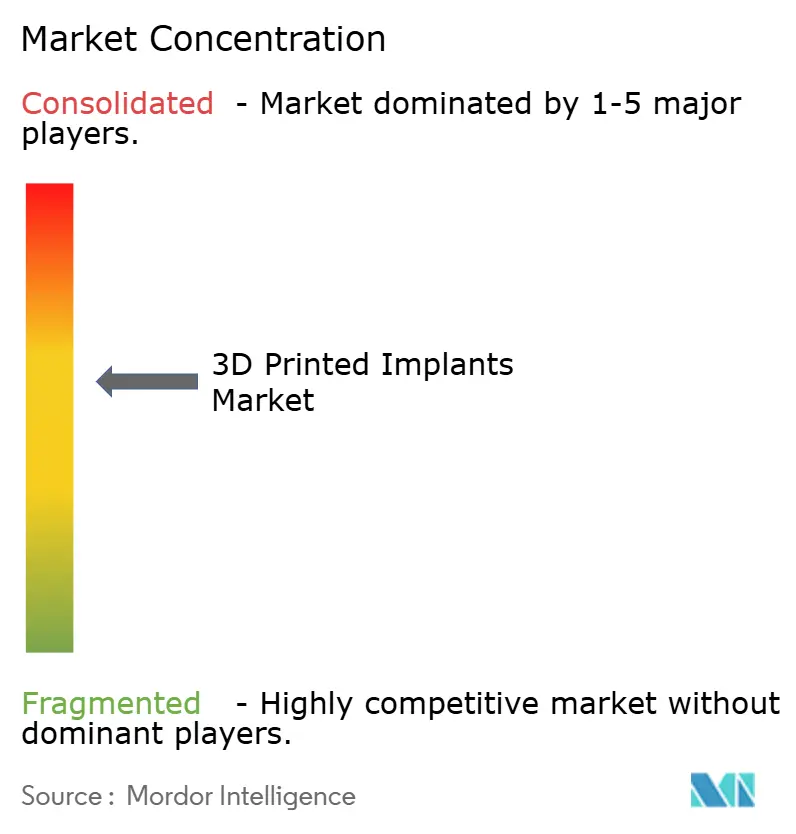
| Market Concentration | Medium |
Major Players *Disclaimer: Major Players sorted in no particular order Image © Mordor Intelligence. Reuse requires attribution under CC BY 4.0. | |
3D Printed Implants Market Analysis by Mordor Intelligence
The 3D Printed Implants Market was valued at USD 0.69 billion in 2025 and expected to grow from USD 0.81 billion in 2026 to reach USD 1.87 billion by 2031, at a CAGR of 18.22% during the forecast period (2026-2031).
Demand is shifting toward on-demand, patient-matched implants that shorten lead times, improve alignment accuracy, and cut revision rates, particularly in orthopedics and dental reconstruction. Powder-bed fusion systems now print load-bearing titanium and cobalt-chrome parts whose tensile strength meets wrought-alloy benchmarks, giving regulators confidence to approve spinal cages, acetabular cups, and other high-stress devices. Concurrently, bio-resorbable magnesium and zinc composites are entering trauma fixation trials, opening a white-space segment unserved by permanent metals. Elective surgeries are migrating to ambulatory surgical centers, where point-of-care printers reduce inventory requirements and enable same-day, minimally invasive procedures, a trend strengthened by payer incentives in the United States. Metal powder volatility remains a headline risk as cobalt-chrome prices almost tripled in 2025, pressuring device margins and encouraging vertical integration of powder supply chains.
Key Report Takeaways
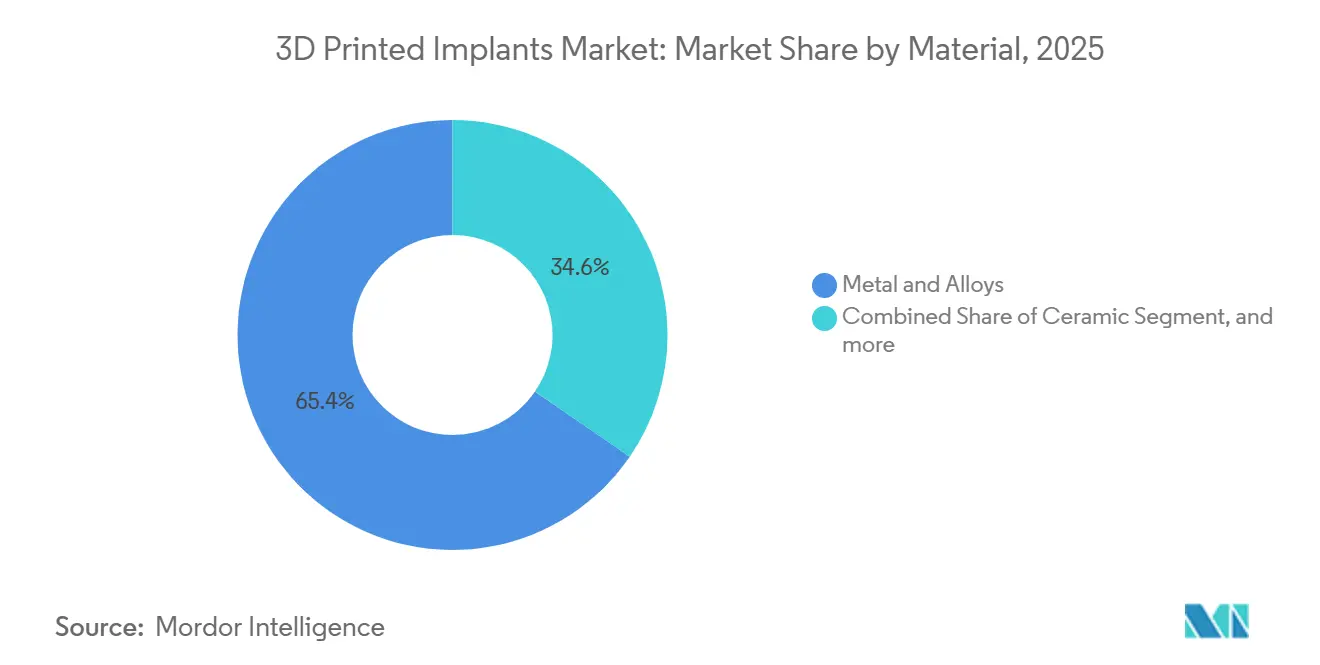
- By material, metal & alloys led with 65.43% of the 3D printed medical devices market share in 2025. Bio-resorbable composites are forecast to expand at a 20.43% CAGR through 2031.
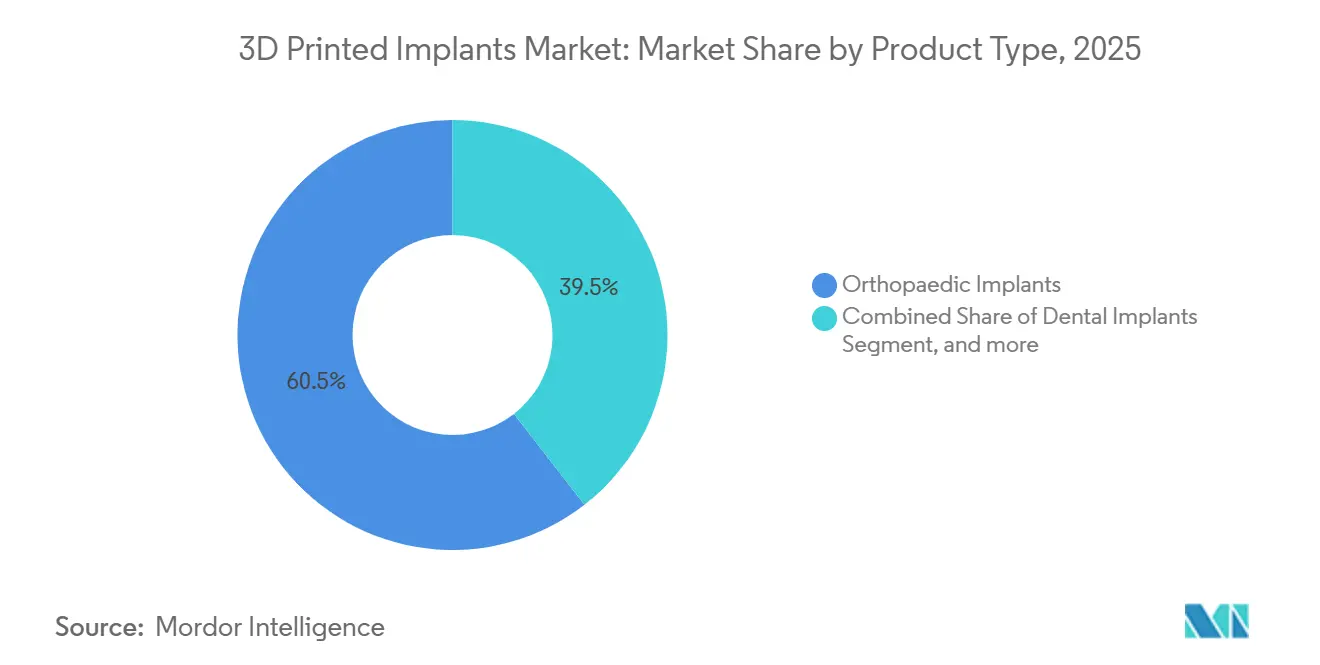
- By product type, orthopaedic implants accounted for 60.52% of revenue in 2025, while dental implants are set to grow at a 20.55% CAGR through 2031.
- By end user, hospitals accounted for 55.97% of the 3D printed medical devices market size in 2025; specialty & orthopaedic clinics will witness the fastest growth at 21.23% CAGR.
- By geography, North America contributed 43.21% revenue in 2025; Asia-Pacific is advancing at a 19.43% CAGR through 2031.
Note: Market size and forecast figures in this report are generated using Mordor Intelligence’s proprietary estimation framework, updated with the latest available data and insights as of January 2026.
Global 3D Printed Implants Market Trends and Insights
Drivers Impact Analysis*
| Driver | (~) % Impact on CAGR Forecast | Geographic Relevance | Impact Timeline |
|---|---|---|---|
| Increasing burden of degenerative musculoskeletal diseases | +4.2% | Global, strongest in North America and Europe | Long term (≥ 4 years) |
| Rapid advancements in metal powder-bed fusion technology | +3.8% | North America, Europe, Asia-Pacific manufacturing hubs | Medium term (2-4 years) |
| Rising preference for same-day, minimally invasive surgical procedures | +3.5% | North America, Western Europe, urban Asia-Pacific centers | Short term (≤ 2 years) |
| Expanding dental implantology and digital dentistry adoption | +3.1% | Global, fastest in Asia-Pacific and Latin America | Medium term (2-4 years) |
| Hospital-based point-of-care manufacturing models | +2.0% | North America, select European academic medical centers | Long term (≥ 4 years) |
| Artificial intelligence-enabled design and validation workflows | +1.6% | North America, Europe, advanced Asia-Pacific markets | Medium term (2-4 years) |
| Source: Mordor Intelligence | |||
Increasing Burden of Degenerative Musculoskeletal Diseases
More than 528 million people now live with osteoarthritis or spinal degeneration, and procedure volumes for hip and knee arthroplasty in the United States alone are expected to top 4 million annually by 2030[1]Source: World Health Organization, “Musculoskeletal Conditions Fact Sheet,” who.int. Patient-matched guides and implants fabricated through additive manufacturing lower operative time by 25% and cut intraoperative blood loss by 30%, easing strain on surgical capacity. The 3D printed medical devices market benefits because surgeons achieve closer implant-bone conformity, which reduces micromotion and revision risk. Regulatory momentum supports the trend; the FDA typically clears patient-matched cranio-maxillofacial meshes or spinal cages within 120 days under the 510(k) route when substantial equivalence is proven. These factors collectively reinforce the long-term expansion of the 3D printed medical devices market.
Rapid Advancements in Metal Powder-Bed Fusion Technology
Selective laser melting and electron-beam melting systems now print layers thinner than 30 microns and achieve surface finishes that meet ASTM F3001 orthopedic criteria without secondary machining. Multi-laser architectures from EOS and Renishaw double build rates and lower per-part cost, making specialty batches viable for mid-size clinics. Machine-learning-driven parameter libraries have pushed scrap rates below 2% and constrained tolerances to ±50 microns. Material innovations broaden the 3D printed medical devices market by introducing degradable magnesium scaffolds that erode predictably in vivo, eliminating follow-up hardware removal surgeries for pediatric trauma cases. Real-time monitoring embedded in ISO 13485-certified printers logs every layer, creating digital twins for regulatory traceability and further accelerating market acceptance.
Rising Preference for Same-Day, Minimally Invasive Surgical Procedures
Ambulatory surgical centers handled more than half of elective orthopedic procedures in 2024 as insurers rewarded lower-cost outpatient settings. Patient-specific implants arrive sterile and trial-ready, allowing surgeons to skip intraoperative sizing and shorten anesthesia exposure. Same-day discharge is now achieved in 70% of total-knee cases using printed guides versus 45% with generic instrumentation. Interbody cages featuring integrated fixation reduce incision length and hospital stay duration to under 24 hours. The FDA’s Breakthrough Devices Program accelerated seven spinal implants in 2024 alone, reinforcing physician confidence in the 3D printed medical devices market.
Expanding Dental Implantology and Digital Dentistry Adoption
Intraoral scanner penetration in clinics climbed from 48% in 2023 to 57% in 2024, helped by falling hardware prices and reimbursement parity for digital impressions. Data flow seamlessly into AI-driven design tools that create abutments in under 10 minutes. 3D printed titanium implants with Ra 3–5 micron surfaces foster faster osseointegration, cutting healing time by four weeks and enabling immediate-load protocols. Asia-Pacific markets are adopting digital dentistry at twice the North American rate due to rising disposable income and government oral-health initiatives, deepening regional demand in the 3D printed medical devices market.
Restraints Impact Analysis*
| Restraint | (~) % Impact on CAGR Forecast | Geographic Relevance | Impact Timeline |
|---|---|---|---|
| High capital expenditure for medical-grade 3D printing infrastructure | -2.8% | Global, acute in emerging markets | Short term (≤ 2 years) |
| Fragmented and lengthy regulatory approval pathways | -2.3% | Europe, much of Asia-Pacific, Latin America | Medium term (2-4 years) |
| Supply chain volatility for medical-grade metal powders | -1.5% | Global, acute in North America and Europe | Short term (≤ 2 years) |
| Limited long-term outcome data for emerging bio-resorbable materials | -1.2% | Global, highest scrutiny in North America and Europe | Long term (≥ 4 years) |
| Source: Mordor Intelligence | |||
High Capital Expenditure for Medical-Grade 3D Printing Infrastructure
Metal powder-bed fusion machines cost USD 500,000–1.2 million, and auxiliary powder-handling, inert-gas, post-processing, and quality-management systems double that figure, placing a single-machine cell above USD 2 million. Maintenance contracts add 12–15% annually. Smaller ambulatory centers, which handle 40% of U.S. elective orthopedic volume, find these economics prohibitive and pay 30–50% service premiums instead, slowing broader uptake in the 3D printed medical devices market. Equipment-as-a-service models exist but captured fewer than 10% of installs in 2024.
Fragmented and Lengthy Regulatory Approval Pathways
The European Medical Device Regulation demands new clinical evidence for any novel geometry, extending launch timelines 12–18 months beyond FDA 510(k) clearance, which only requires substantial equivalence[2]Source: European Commission, “MDR Implementation Update,” ec.europa.eu. China fast-tracks domestic devices but still obliges foreign applicants to run local trials that can take 24 months. Firms must maintain separate technical files and quality systems, inflating compliance costs and delaying the 3D printed medical devices market rollout for niche indications.
*Our forecasts treat driver/restraint impacts as directional, not additive. The impact forecasts reflect baseline growth, mix effects, and variable interactions.
Segment Analysis
By Material: Titanium Dominance Meets Bio-Resorbable Disruption
Metal & alloys accounted for 65.43% of the 3D printed medical devices market share in 2025, equivalent to USD 0.53 billion of the total 3D printed medical devices market size. Titanium-6Al-4V remains favored for hip and knee components because its 110 GPa modulus approximates that of cortical bone, thereby curbing stress shielding. Cobalt-chrome excels in articulating surfaces where wear resistance outweighs mass concerns. Polymer and ceramic categories remain niche due to load limitations.
Bio-resorbable composites will register a 20.43% CAGR and are expected to increase their share of the 3D-printed medical devices market to USD 0.42 billion by 2031. Magnesium screws show 94.5% ankle fracture integration at 12–18 months and eliminate the need for costly hardware extraction surgeries[2]. Polycaprolactone blends support cranio-facial remodeling, while zinc alloys promise slower, more controlled degradation in load-sharing plates. Regulatory clarity is improving globally, but divergent follow-up requirements extend U.S. timelines relative to those in Asia-Pacific.


By Product Type: Orthopaedic Leadership, Dental Acceleration
Orthopaedic implants generated 60.52% of 2025 revenue, underpinned by acetabular cups whose lattice cores shave 35% weight while keeping compressive strength above 150 MPa. Spinal cages with integrated fixation cut OR times by 20 minutes and save USD 1,500 in hardware per level. Cranio-maxillofacial plates customized from CT data reduce OR trial fitting and improve cosmetic alignment.
Dental implants will outpace all categories with a 20.55% CAGR, driven by workflows that compress treatment from 6 months to 6 weeks. AI tools craft abutments in minutes, and immediate-load surfaces shorten osseointegration periods by four weeks. Cardiovascular & Other Custom Implants remain nascent, limited by reimbursement gaps and nascent regulatory experience, but represent future optionality for the 3D printed medical devices market.
By End User: Hospitals Lead, Specialty Clinics Surge
Hospitals held 55.97% of the 3D printed medical devices market size in 2025, leveraging ISO 13485 labs that print within 72 hours and integrate virtual planning sessions. Large centers recoup capital through high case volumes and reduced inventory waste. However, operational complexity—design controls, process validation, post-market surveillance—restricts adoption to top-tier institutions.
Specialty & orthopaedic clinics are projected to expand at a 21.23% CAGR through 2031. Practices performing 500+ knee cases annually can amortize equipment within three years, capturing USD 3,000–5,000 per-procedure premiums for patient-matched implants. Equipment-as-a-service offerings from Formlabs and Stratasys, priced near USD 500 per month, lower entry barriers though penetration remains below 10%.
Geography Analysis
North America accounted for 43.21% of 2025 revenue and remains the largest 3D printed medical devices market, anchored by CMS reimbursement codes and a streamlined 510(k) route that clears substantial-equivalence submissions in 120 days. Academic centers with in-house printers handle complex revisions faster, while ambulatory sites leverage printed guides for same-day discharge. Canada’s uptake lags due to single-payer budgeting, although provincial pilots in Ontario and British Columbia produced spinal cages 30% cheaper than imports. Mexico’s opportunity lies in medical tourism, yet tariffs on equipment and limited surgeon training keep volumes low.
Europe constitutes around 30% share. Germany, the United Kingdom, and France lead as public funding and device clusters support early-stage R&D. EU MDR adds 12–18 months to approval timelines, dampening launches of niche geometries. The United Kingdom’s centralized hubs serve multiple trusts and lower unit cost 25%, but Brexit-related powder delays elongate lead times. Spain and Italy trail because of fragmented reimbursement and lower procedure density.
Asia-Pacific is forecast to achieve a 19.43% CAGR, the fastest globally, as China’s NMPA fast-tracks domestic implants and subsidizes equipment purchases[3]National Medical Products Administration, “Fast-Track Review Procedures,” nmpa.gov.cn. AK Medical and MicroPort undercut western rivals by up to 40% on price using local titanium powder. Japan’s aging demographics drive patient-specific knees; alliances between Teijin, Kyocera, and surgeons embed AI design. India faces 15% import tariffs yet benefits from medical device parks attracting FDI. Australia and South Korea pioneer hospital printers, slashing implant lead time from four weeks to three days. Southeast Asia and New Zealand remain early-stage, with dental labs spearheading polymer printing.
Middle East & Africa and South America combine for under 10% revenue. UAE and Saudi Arabia invest under national diversification plans, with Dubai Healthcare City hosting training hubs. South African public facilities lack funds, but private orthopedics adopt patient-specific trauma devices. Brazil leverages domestic titanium mining for lower raw-material costs, yet protracted regulatory reviews and immature reimbursement hinder broader adoption.

Competitive Landscape
The 3D printed medical devices market is moderately concentrated: the top five players—Stryker, Zimmer Biomet, Materialise, 3D Systems, and Medtronic—held roughly 45% of 2025 revenue. Orthopedic majors vertically integrate to capture additive margins; Stryker’s Cork facility doubled laser-sintering capacity in 2024, and Zimmer Biomet’s venture with Materialise pushed patient-specific knees to 8% of arthroplasty sales. Smaller disruptors focus on niches: Restor3d’s cranio-facial meshes and Conformis’s anatomic knees command price premiums protected by specialized design intellectual property.
Technology differentiation is migrating from machine ownership to software intelligence. AI-driven porosity gradients that promote bone ingrowth while reducing stress shielding dominated 2024 patent filings, with more than 200 U.S. issuances covering lattice optimization and parameter databases. Point-of-care models from Formlabs and Desktop Metal target ambulatory centers and dental labs with subscription offerings, challenging incumbents on service speed rather than scale.
Regulatory and quality-system barriers remain high. Establishing ISO 13485 and FDA Part 820 compliance can consume 18–24 months, creating a moat for incumbents while larger entrants acquire or partner for rapid capability. Powder supply chain control is emerging as a new competitive front, as price spikes in cobalt-chrome demonstrated the vulnerability of contract manufacturing models.
3D Printed Implants Industry Leaders
Stryker
Zimmer Biomet
DePuy Synthes (J&J)
Medtronic
3D Systems Corporation
- *Disclaimer: Major Players sorted in no particular order

Recent Industry Developments
- November 2025: CustoMED announced the successful completion of its seed round, bringing total funding to USD 6 million. The company will use the funding to scale its cloud-based platform, which combines artificial intelligence and automation with 3D printing to generate surgical tools and implants directly from a surgeon’s pre-operative plan.
- April 2025: OSSTEC, an Imperial College London startup, raised EUR 2.5 million (USD 2.95 million) in funding, led by Empirical Ventures, to launch its 3D-printed, cementless partial knee implants. The funding will support UK clinical trials and U.S. regulatory approval for the technology, which mimics bone structure for improved, long-term, active-patient outcomes.


Global 3D Printed Implants Market Report Scope
As per the scope of the report, 3D printed implants are custom-made medical devices created using additive manufacturing technology, tailored to fit a patient's specific anatomy. They offer precise integration and improved biocompatibility. These implants are used in various fields such as orthopedics, dentistry, and craniofacial reconstruction.
The 3D Printed Medical Devices Market is Segmented by Material (Metal & Alloys, Polymer, Ceramic, and Bio-Resorbable Composites), Product Type (Orthopaedic Implants, Dental Implants, Cardiovascular Implants, and Other Product Types), End-User (Hospitals, Ambulatory Surgical Centres, Speciality & Orthopaedic Clinics, and Dental Laboratories), and Geography (North America, Europe, Asia-Pacific, Middle East & Africa,and South America). The market report also covers the estimated market sizes and trends for 17 countries across major regions globally. The report offers the value (in USD million) for the above segments.
| Metal & Alloys |
| Polymer (PEEK, Photopolymers) |
| Ceramic |
| Bio-Resorbable Composites |
| Orthopaedic Implants | Hip |
| Knee | |
| Spinal | |
| Cranio-Maxillofacial | |
| Extremities & Trauma | |
| Dental Implants | |
| Cardiovascular Implants | |
| Other Product Types |
| Hospitals |
| Ambulatory Surgical Centres |
| Speciality & Orthopaedic Clinics |
| Dental Laboratories |
| North America | United States |
| Canada | |
| Mexico | |
| Europe | Germany |
| United Kingdom | |
| France | |
| Italy | |
| Spain | |
| Rest of Europe | |
| Asia-Pacific | China |
| Japan | |
| India | |
| Australia | |
| South Korea | |
| Rest of Asia-Pacific | |
| Middle East & Africa | GCC |
| South Africa | |
| Rest of Middle East & Africa | |
| South America | Brazil |
| Argentina | |
| Rest of South America |
| By Material | Metal & Alloys | |
| Polymer (PEEK, Photopolymers) | ||
| Ceramic | ||
| Bio-Resorbable Composites | ||
| By Product Type | Orthopaedic Implants | Hip |
| Knee | ||
| Spinal | ||
| Cranio-Maxillofacial | ||
| Extremities & Trauma | ||
| Dental Implants | ||
| Cardiovascular Implants | ||
| Other Product Types | ||
| By End-User | Hospitals | |
| Ambulatory Surgical Centres | ||
| Speciality & Orthopaedic Clinics | ||
| Dental Laboratories | ||
| Geography | North America | United States |
| Canada | ||
| Mexico | ||
| Europe | Germany | |
| United Kingdom | ||
| France | ||
| Italy | ||
| Spain | ||
| Rest of Europe | ||
| Asia-Pacific | China | |
| Japan | ||
| India | ||
| Australia | ||
| South Korea | ||
| Rest of Asia-Pacific | ||
| Middle East & Africa | GCC | |
| South Africa | ||
| Rest of Middle East & Africa | ||
| South America | Brazil | |
| Argentina | ||
| Rest of South America | ||


Key Questions Answered in the Report
What is the current value of the 3D printed medical devices market?
The market stands at USD 0.81 billion in 2026 and is projected to reach USD 1.87 billion by 2031.
How fast is demand for dental implants rising in this space?
Dental implants show the strongest momentum, expanding at a 20.55% CAGR through 2031.
Which material segment is disrupting traditional metal dominance?
Bio-resorbable composites—primarily magnesium and zinc alloys—are growing at a 20.43% CAGR because they dissolve in vivo, avoiding follow-up hardware-removal surgeries.
Why are ambulatory surgical centers critical to adoption?
These centers rely on patient-matched devices that enable same-day discharge, so they drive uptake of 3D-printed guides and implants while lowering overall procedure costs.
What limits broader use of hospital point-of-care printing?
High capital costs (above USD 2 million) and the need for ISO 13485 and FDA Part 820 compliance restrict in-house printing to large, high-volume centers.
Which region will grow the fastest through 2031?
Asia-Pacific leads with a projected 19.43% CAGR, helped by China's fast-track regulatory approvals and equipment subsidies.
Page last updated on:


