
3D Construction Market Size and Share
Market Overview
| Study Period | 2020 - 2031 |
|---|---|
| Market Size (2026) | USD 4.55 Billion |
| Market Size (2031) | USD 20.78 Billion |
| Growth Rate (2026 - 2031) | 35.45% CAGR |
| Fastest Growing Market | Asia-Pacific |
| Largest Market | North America |
| Market Concentration | Medium |
Major Players *Disclaimer: Major Players sorted in no particular order Image © Mordor Intelligence. Reuse requires attribution under CC BY 4.0. | |
3D Construction Market Analysis by Mordor Intelligence
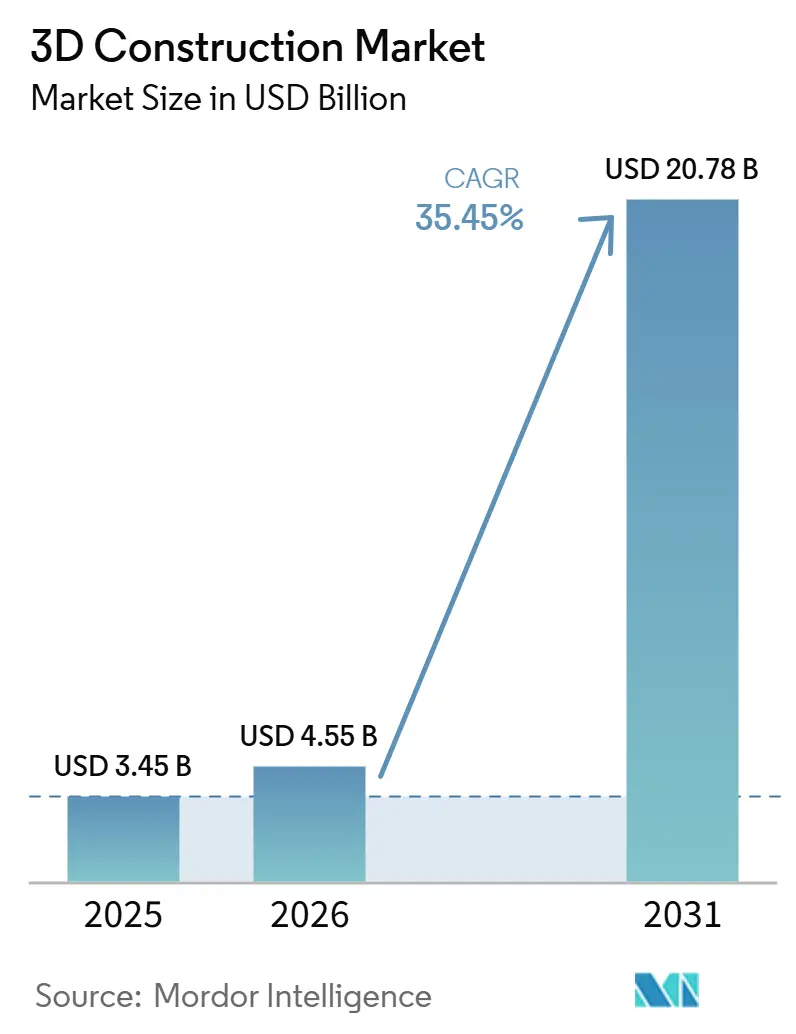
The 3D Construction Market size is expected to grow from USD 3.45 billion in 2025 to USD 4.55 billion in 2026 and is forecast to reach USD 20.78 billion by 2031 at 35.45% CAGR over 2026-2031.
The 3D construction market is expanding because housing shortages remain unresolved in many countries, securing skilled construction labor is harder, and public programs are moving additive construction from small pilots into repeatable delivery models[1]US Department of Housing and Urban Development, “HUD Announces $10 Million in Funding for Leveraging Robotics and AI Technologies,” HUD User, huduser.gov. The 3D construction market is also benefiting from the move from one-story demonstration systems to commercial multi-story platforms, which is widening the range of projects that can be printed at scale. Defense and public-sector adoption are reducing technical and regulatory uncertainty by creating reference cases that civilian developers can use in future approvals. At the same time, the 3D construction market still faces inconsistent building codes, limited insurance coverage in some regions, and high equipment costs that slow adoption among smaller contractors. Even with those limits, improving mortgage support, better printable materials, and wider project evidence are creating a clearer path for commercial scale-up across housing, infrastructure, and industrial construction.
Key Report Takeaways
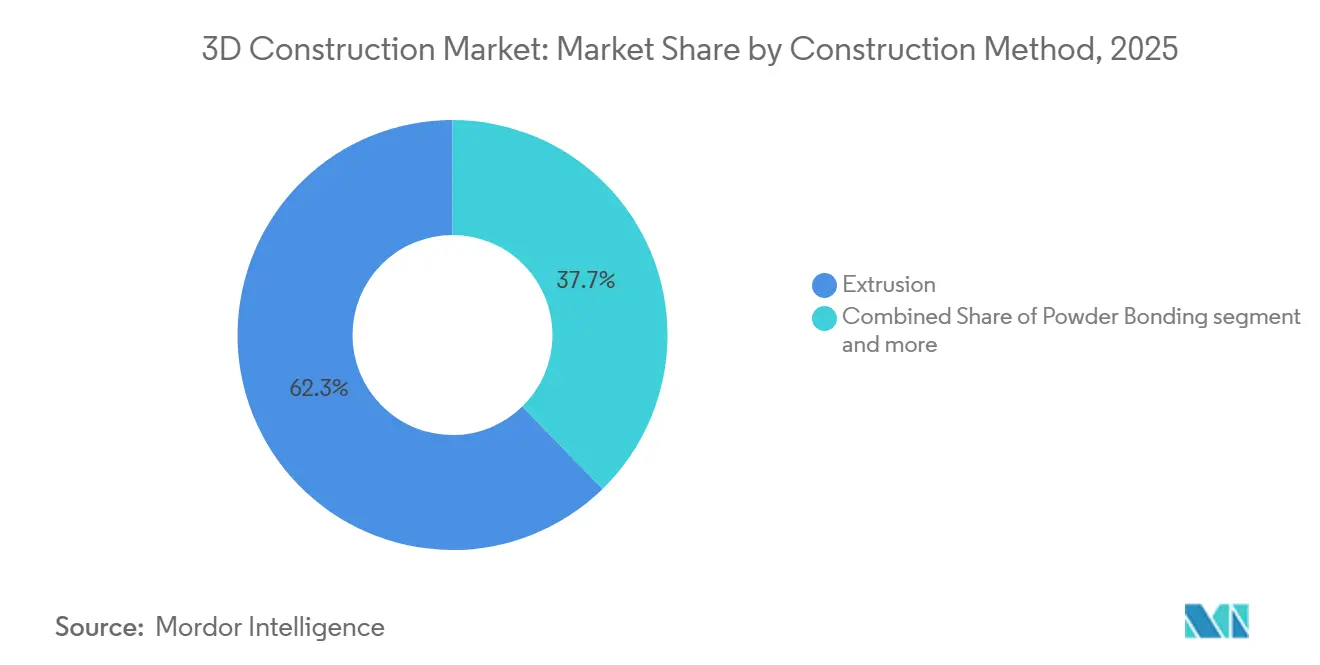
- By construction method, extrusion led with 62.3% of the 3D construction market share in 2025, while powder bonding is forecast to expand at 46.2% CAGR through 2031.
- By material type, concrete accounted for 54.8% of the 3D construction market size in 2025, while metal is projected to record the highest CAGR at 55.1% through 2031.
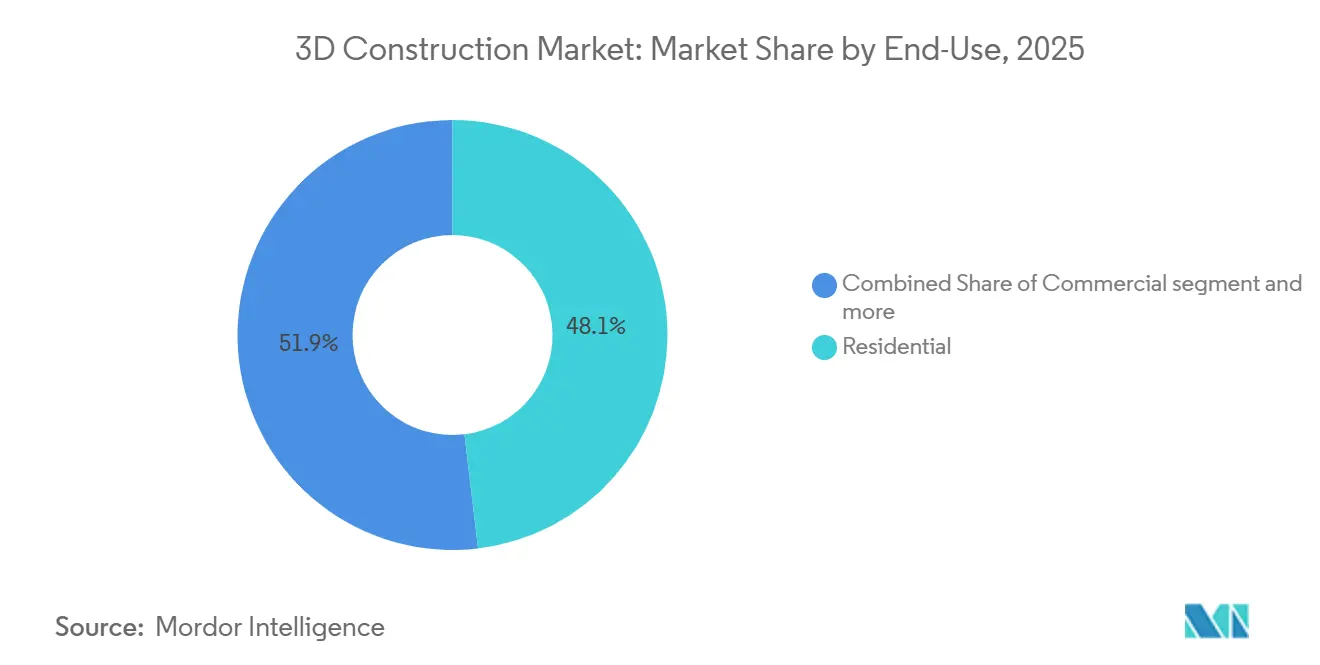
- By end use, residential accounted for 48.1% of the 3D construction market size in 2025, while infrastructure is advancing at 42.7% CAGR through 2031.
- By construction setting, on-site printing held 67.1% of the 3D construction market share in 2025, while off-site and prefabrication is projected to grow at 40.9% CAGR through 2031.
- By geography, North America held 32.4% share in 2025, while Asia Pacific is forecast to expand at 37.6% CAGR through 2031.
Note: Market size and forecast figures in this report are generated using Mordor Intelligence’s proprietary estimation framework, updated with the latest available data and insights as of January 2026.
Global 3D Construction Market Trends and Insights
Drivers Impact Analysis*
| Drivers | (~) % Impact on CAGR Forecast | Geographic Relevance | Impact Timeline |
|---|---|---|---|
| Public Funding for Affordable Printed Housing | +8.5% | North America & Europe | Medium term (2-4 years) |
| Shorter Build Cycles and Lower Labor Intensity | +7.2% | Global | Short term (≤ 2 years) |
| Military and Emergency Shelter Adoption | +5.6% | North America, APAC, MEA | Medium term (2-4 years) |
| Mix Design Advances Improving Structural Reliability | +4.8% | Global, with early gains in APAC and Europe | Medium term (2-4 years) |
| Carbon-Lowering Binder Systems and Waste Reduction | +4.1% | Europe & North America, spill-over to APAC | Medium term (2-4 years) |
| Digital Quality Control and Rework Reduction | +3.2% | Global | Short term (≤ 2 years) |
| Source: Mordor Intelligence | |||
Public Funding for Affordable Printed Housing
Public funding is doing more than supporting pilot units in the 3D construction market. It is creating procurement models that later projects can follow with less execution risk. In June 2026, the US Department of Housing and Urban Development opened USD 10 million in competitive grants for robotics and AI in factory-built homebuilding, and the scope explicitly covered volumetric 3D modular systems. Virginia Housing also committed USD 1.1 million to Virginia Tech’s HiveASMBLD program in 2024 to deliver 5 affordable 3D-printed homes in Richmond, providing the 3D construction market with a visible state-level example of public and academic coordination. Once publicly backed projects satisfy standard code requirements, lenders and insurers gain stronger grounds to extend normal products to printed homes, and the June 2026 Wells Fargo agreement with ICON shows that this financing channel is already opening.
Shorter Build Cycles and Lower Labor Intensity
The operating case for the 3D construction market is now supported by measured project outcomes rather than solely engineering projections. At the ViliaSprint² social housing project in France, PERI 3D Construction used a COBOD BOD2 system and completed the shell 3 months earlier than the conventional twin structure on the same site. The same project used only 3 on-site operators instead of 6, and material waste fell from 10% to 5%, demonstrating that both labor demand and wasted input can decline simultaneously. ICON’s Titan platform, launched commercially in March 2026, targets wall-system costs of USD 20 per square foot and points to a potential 40% reduction compared to conventional methods, providing developers with a more concrete cost reference in the 3D construction market. Quality monitoring is also improving because AI-assisted computer vision can detect layer deviations during printing and reduce defect-related rework that once weakened schedule gains
Military and Emergency Shelter Adoption
Defense procurement has become one of the strongest validation routes in the 3D construction market. In January 2025, the US Army opened the Department of Defense’s first 3D-printed barracks at Fort Bliss, Texas, comprising 3 buildings totaling 17,100 square feet, built by ICON using Vulcan printers and Lavacrete. The project complied with the updated DoD Unified Facilities Criteria for additive manufacturing, which matters because compliance in a defense setting creates a formal reference point that private developers can later cite in civilian approval discussions. This kind of public-sector use reduces the perception that printed construction is still experimental, and that supports broader acceptance across infrastructure and emergency shelter applications. As a result, the 3D construction market is gaining a more credible path into projects where speed, standardized delivery, and remote deployment matter most.
Mix Design Advances Improving Structural Reliability
Mix design advances are strengthening the commercial case for the 3D construction market by improving consistency in layer bonding, buildability, and long-term structural performance. Holcim’s TectorPrint system, used in the ViliaSprint² residential project in France, demonstrated that printable concrete can meet structural requirements while reducing material use through optimized curved geometry, thereby supporting greater confidence in repeatable large-scale construction. Research published in 2026 also found that combining cellulose nanofibers with limestone filler can deliver a technically sound, cost-efficient, and lower-carbon printable concrete, indicating that new formulations are improving both mechanical behavior and process stability. Limestone-calcined clay binder systems have further widened the material base for additive construction by reducing carbon intensity while maintaining equivalent strength, thereby expanding the range of reliable feedstocks available for printed structural applications. As these formulations move from pilot validation into broader project use, the 3D construction market is likely to benefit from reduced performance uncertainty, greater code acceptance, and greater confidence among developers, contractors, and insurers.
Restraints Impact Analysis*
| Restraints | (~) % Impact on CAGR Forecast | Geographic Relevance | Impact Timeline |
|---|---|---|---|
| High Upfront Capex For Large-Format Printers | -3.8% | Global, most acute in South America, MEA, and emerging APAC | Long term (≥ 4 years) |
| Unharmonized Building Codes And Approval Cycles | -2.9% | North America, Europe, APAC | Medium term (2-4 years) |
| Insurance And Warranty Acceptance Gaps | -1.7% | Europe & North America | Medium term (2-4 years) |
| Feedstock Quality And Additive Supply Constraints | -1.4% | Global | Short term (≤ 2 years) |
| Source: Mordor Intelligence | |||
High Upfront Capex for Large-Format Printers
High equipment costs remain a major barrier in the 3D construction market, especially for small- and mid-sized contractors. ICON’s Titan system has a list price of USD 899,000, excluding site preparation, training, material logistics, and permitting support. For a first-time adopter, total deployment could range from USD 1.5 billion to USD 2 billion? No, that would be incorrect. The original draft stated a total investment of USD 1.5–2 million, so the correct range is USD 1.5-2 million, and that level is difficult to justify given that contracted project pipelines are still limited. Leasing and reservation models are emerging, but financing options for additive construction equipment remain less mature than those for standard heavy construction machinery. This slows adoption in the 3D construction market in regions where capital access, maintenance support, and trained operators remain limited.
Unharmonized Building Codes and Approval Cycles
Code fragmentation continues to slow the 3D construction market because approvals still depend heavily on local interpretation. In 2026, the International Code Council published ICC 1150-2026, a dedicated standard for 3D-printed walls that covers load-bearing, non-load-bearing, and shear walls in one-story and multi-story structures across Seismic Design Categories A and B. That publication is an important milestone, but adoption into state and local rules still takes time and often requires legislative incorporation. Where governments move faster, project activity tends to concentrate because developers face less permit uncertainty and lower administrative risk. Until more jurisdictions align their rules, the 3D construction market will remain easier to scale in a limited set of supportive locations than across entire national markets.
*Our forecasts treat driver/restraint impacts as directional, not additive. The impact forecasts reflect baseline growth, mix effects, and variable interactions.
Segment Analysis
By Construction Method: Extrusion Commands Volume, Powder Bonding Expands Specialty Use
Extrusion accounted for 62.3% of the construction method segment in 2025, making it the largest method in the 3D construction market. Its position reflects the maturity of concrete-extrusion gantry systems and their fit with normal jobsite logistics. Over time, the method moved from experimental single-nozzle systems into robotic gantries that can print wall sections at a commercial pace. That practical maturity matters because contractors in the 3D construction market usually adopt tools that fit existing workflows before adopting those that require a full process redesign.
Powder bonding is projected to expand at 46.2% CAGR from 2026 to 2031, making it the fastest-growing method in the 3D construction industry. Its appeal lies in its ability to process composite feedstocks, mineral powders, and geopolymer binders that extrusion cannot always handle with the same consistency. That gives powder bonding a stronger role in architectural elements, complex connectors, and specialty components where geometric precision matters more than volume throughput. Research published in 2026 also showed that cellulose nanofibers combined with limestone filler can support lower-carbon printable concrete, which supports wider material innovation across both extrusion and powder-based processes[2]Nature Communications, “Cellulose Nanofibers and Limestone Filler Enable High-Performance, Sustainable, and Cost-Efficient Printable Concrete,” Nature Communications, doi.org.



By Material Type: Concrete Leads Current Use, Metal Builds the Next Growth Layer
Concrete accounted for 54.8% of the material type segment in 2025, making it the largest material type in the 3D construction market. That lead stems from the wide availability of cement precursors, long-established compressive-strength data, and better alignment with existing inspection routines. The current scale of printed buildings still favors concrete because it suits walls, shells, and structural forms that are already familiar to contractors and regulators. For that reason, concrete is likely to remain the main volume material in the 3D construction market even as faster-growing alternatives gain ground.
Metal is projected to grow at a 55.1% CAGR from 2026 to 2031, making it the fastest-growing material type in the 3D construction industry. MX3D’s completion of the Horizon-funded PIONEER project in April 2026 showed that targeted wire-arc additive manufacturing on standard I-beams can raise load-carrying capacity by 35% to 84% with only 5% to 16% more mass. That kind of performance helps metal printing move from a niche fabrication tool toward a certified option for structural connectors and bespoke nodes. Composite and other feedstocks, including earth, clay, and bio-based materials, remain smaller but important because they serve thermal, façade, and low-embodied-carbon applications that standard concrete does not address as efficiently.
By End Use: Residential Holds the Largest Base While Infrastructure Grows Faster
Residential accounted for 48.1% of end-use demand in 2025, which gave it the largest position in the 3D construction market. Housing remains the most advanced application because printed homes have already shown that they can meet structural and performance requirements while reducing shell construction time and labor intensity. This makes residential projects the clearest path for repeat deployment where affordability and speed matter together. The 3D construction market also benefits here from growing lender involvement, because financing support reduces one of the main barriers to mainstream residential adoption.
Infrastructure is projected to grow at a 42.7% CAGR from 2026 to 2031, making it the fastest-growing end-use segment in the 3D construction market. Demand is increasing for bridges, retaining walls, utility structures, military facilities, and commercial infrastructure where reduced formwork and complex geometry create clear engineering value. The June 2026 completion of the 3D-printed supermarket in Neubulach, Germany, showed that printed wall systems can support large industrial and commercial footprints at an operating scale. Infrastructure clients also face fewer adoption barriers in some cases, as self-insurance or alternative warranty models can be easier to arrange than consumer-facing residential coverage.
By Construction Setting: On-Site Printing Dominates Current Deployment, Off-Site Grows Faster
On-site printing held 67.1% of the construction setting segment in 2025, which gave it the leading role in the 3D construction market. Direct printing at the project location avoids large-panel transport, allows continuous inspection, and adapts more easily to irregular footprints and site conditions. That advantage is important in markets where every parcel has different constraints and where moving large prefabricated sections is difficult. As a result, the 3D construction market still relies most heavily on on-site systems for full-scale building shells and project-specific structures.
Off-site and prefabrication is projected to grow at 40.9% CAGR from 2026 to 2031, making it the fastest-growing setting in the 3D construction industry. Factory-based production allows longer operating hours, tighter dimensional control, and more stable quality conditions than many outdoor jobsites. This changes how the 3D construction market can be financed and scaled, because production starts to resemble manufacturing rather than field construction. The publication of ICC 1150-2026 also supports this direction by giving more formal recognition to pre-qualified wall systems and automated construction practices
Geography Analysis
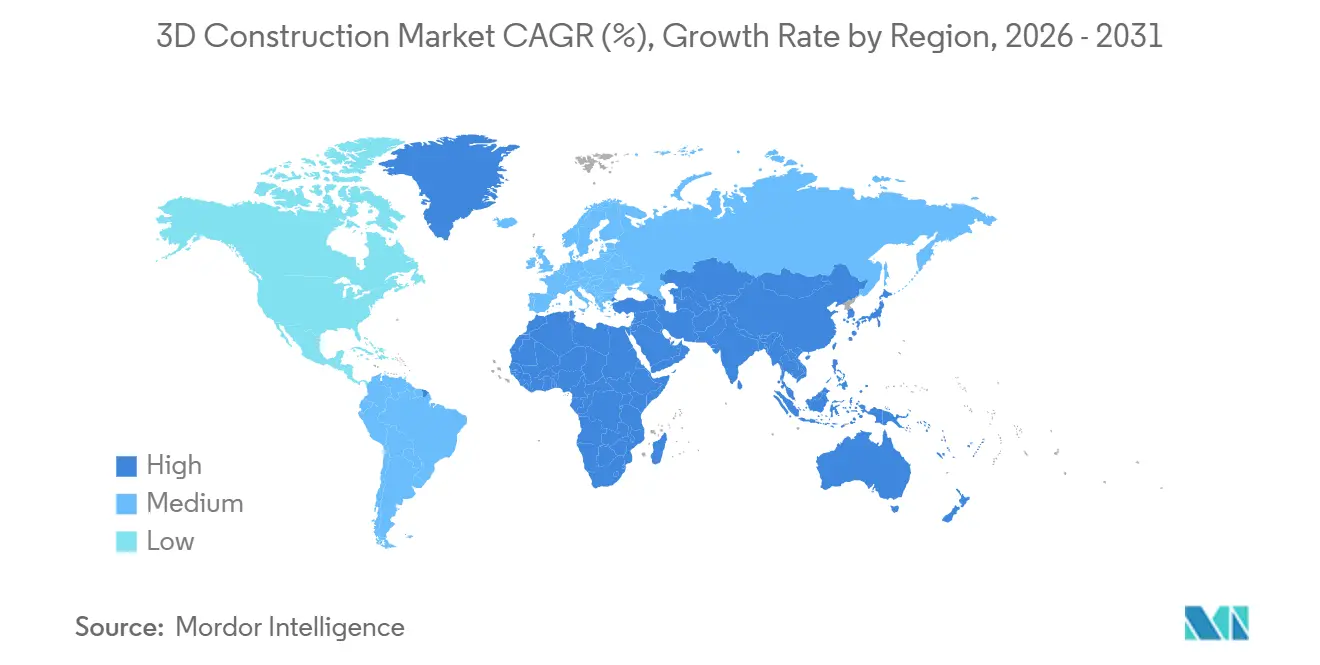
North America accounted for 32.4% of the 3D construction market in 2025, making it the largest regional market. The region benefits from a more established ecosystem of printer developers, materials suppliers, and institutional users than most other regions. The January 2025 opening of the Department of Defense’s first 3D-printed barracks at Fort Bliss gave the 3D construction market in North America a highly visible government reference project[3]U.S. Army, “Army Opens DOD’s First 3D-Printed Barracks,” U.S. Army, army.mil. The June 2026 Wells Fargo preferred mortgage arrangement with ICON also strengthens the regional financing base for printed housing and may support faster residential adoption.
Europe remains one of the most active proving grounds for the 3D construction market because project scale, sustainability goals, and code development are advancing in tandem. France showed that printed residential construction can meet both time and carbon targets when the ViliaSprint² project used Holcim’s TectorPrint system under the RE2020 threshold. Germany is also moving quickly, with Heidelberg Materials supplying near-zero-carbon concrete for DREIHAUS in 2025 and evoZero being used in the 3D-printed supermarket completed in June 2026. The United Kingdom improved the acceptance path by making structural warranty coverage available for 3D-printed homes, which supports broader mortgage access. Asia Pacific is the fastest-growing region, with a 37.6% CAGR through 2031, supported by urbanization pressures, smart-city priorities, and rising interest in military, industrial, and prefabricated applications.
South America, the Middle East, and Africa remain smaller in current value, but they represent distinct growth pathways in the 3D construction market. In South America, social housing and resilience-oriented construction create an opening for printed methods that prioritize affordability and structural optimization. In the Middle East, Dubai’s policy support and large-scale development programs continue to make the region one of the more visible deployment hubs for additive construction. Africa is still at an early stage, but demand for low-cost housing and remote construction needs keep the 3D construction market relevant for future adoption in selected urban and peri-urban projects.

Competitive Landscape
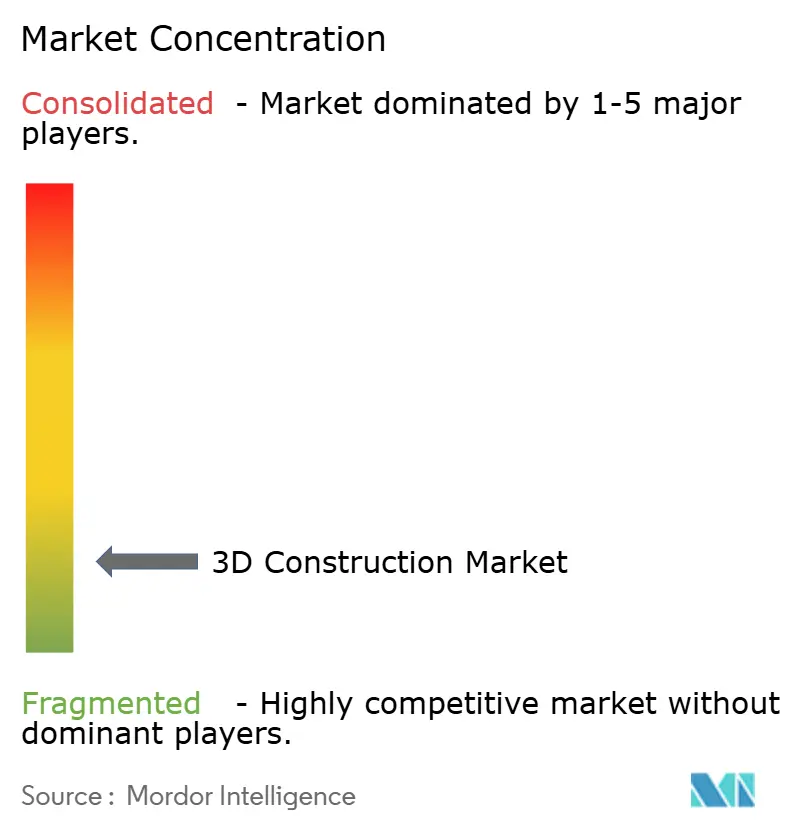
The 3D construction market remains moderately fragmented, with leadership distributed across printer specialists, materials companies, and project execution partners. Printer-system companies such as COBOD, ICON, Alquist, CyBe, Apis Cor, and Black Buffalo 3D compete on print speed, nozzle control, multi-story capability, and commercial deployment models. Materials companies such as Holcim, Heidelberg Materials, Sika, and CEMEX compete on printable formulations, carbon performance, and supply-chain integration. This structure means the 3D construction market does not yet have a single company that controls hardware, materials, software, and project delivery at the same time.
Competition is also being shaped by strategic product and project moves in the 3D construction market. ICON commercially launched the Titan multi-story robotic construction system in March 2026 at a list price of USD 899,000, which shows a direct push toward broader builder adoption rather than project-by-project execution only. Heidelberg Materials strengthened its position in low-carbon printable materials when evoZero was deployed in the 3D-printed supermarket completed in Germany in June 2026. MX3D advanced the metal tier of the 3D construction market by completing the PIONEER project and demonstrating measurable structural performance gains for hybrid steel components. Holcim also strengthened its competitive position through the deployment of TectorPrint in a large printed residential project that met France’s current carbon threshold.
A major white space remains in software integration across the 3D construction market. No leading platform yet combines design-to-print workflows, live quality tracking, and project documentation in a single widely adopted system. That leaves room for vendors that can connect equipment performance with compliance reporting and financing documentation. Hardware leasing and wider code acceptance may lower entry barriers, but they may also shift competition toward materials partnerships, software control, and certified project repeatability instead of printer ownership alone.
3D Construction Industry Leaders
COBOD International A/S
ICON Technology, Inc.
Apis Cor Inc.
CyBe Construction B.V.
XtreeE
- *Disclaimer: Major Players sorted in no particular order

Recent Industry Developments
- June 2026: Wells Fargo was named ICON's preferred home mortgage lender, offering a 50-basis-point lender credit to qualified buyers of ICON 3D-printed homes. The agreement represents the first time a top-tier US retail bank has formally structured a preferred mortgage program around additive construction, removing a key demand-side financing barrier for residential 3D printing.
- June 2026: The world's first 3D-printed supermarket, a Netto Marken-Discount store in Neubulach, Germany, completed its shell in approximately 4 weeks. The INSTATIQ P1 mobile printers were operated by joint venture NELCON, using Heidelberg Materials' near-zero-emission evoZero cement, producing more than 1,300 square meters of printed wall area across a 1,700-square-meter floor plan, currently the world's largest 3D-printed building by wall surface.
- April 2026: MX3D completed the EU Horizon-funded PIONEER project in collaboration with Imperial College London, demonstrating that targeted WAAM deposition raises load-carrying capacity of standard I-beams by 35% to 84% with just 5% to 16% mass increase, advancing hybrid structural steel 3D printing toward routine civil-engineering specification.
- March 2026: ICON commercially launched the Titan multi-story robotic construction system, priced at USD 899,000, targeting wall-system costs of USD 20 per square foot, a potential 40% cost reduction versus conventional methods. Customer training begins in Q3 2026 with first system deliveries anticipated in early 2027.


Global 3D Construction Market Report Scope
| Extrusion |
| Powder Bonding |
| Others |
| Concrete |
| Metal |
| Composite |
| Other Material Types |
| Residential |
| Commercial |
| Infrastructure |
| On-site (In-situ) Printing |
| Off-site (Factory / Precast) Printing |
| North America | United States | |
| Canada | ||
| Mexico | ||
| South America | Brazil | |
| Argentina | ||
| Chile | ||
| Rest of South America | ||
| Europe | Germany | |
| United Kingdom | ||
| France | ||
| Italy | ||
| Spain | ||
| Russia | ||
| Rest of Europe | ||
| APAC | China | |
| India | ||
| Japan | ||
| South Korea | ||
| Australia | ||
| Rest of APAC | ||
| Middle East and Africa | Middle East | United Arab Emirates |
| Saudi Arabia | ||
| Turkey | ||
| Rest of Middle East | ||
| Africa | South Africa | |
| Nigeria | ||
| Rest of Africa | ||
| By Construction Method | Extrusion | ||
| Powder Bonding | |||
| Others | |||
| By Material Type | Concrete | ||
| Metal | |||
| Composite | |||
| Other Material Types | |||
| By End Use | Residential | ||
| Commercial | |||
| Infrastructure | |||
| By Construction Setting | On-site (In-situ) Printing | ||
| Off-site (Factory / Precast) Printing | |||
| By Geography | North America | United States | |
| Canada | |||
| Mexico | |||
| South America | Brazil | ||
| Argentina | |||
| Chile | |||
| Rest of South America | |||
| Europe | Germany | ||
| United Kingdom | |||
| France | |||
| Italy | |||
| Spain | |||
| Russia | |||
| Rest of Europe | |||
| APAC | China | ||
| India | |||
| Japan | |||
| South Korea | |||
| Australia | |||
| Rest of APAC | |||
| Middle East and Africa | Middle East | United Arab Emirates | |
| Saudi Arabia | |||
| Turkey | |||
| Rest of Middle East | |||
| Africa | South Africa | ||
| Nigeria | |||
| Rest of Africa | |||


Key Questions Answered in the Report
What is the 2026 value of 3D construction?
The 3D construction market is estimated at USD 4.6 billion in 2026 and is forecast to reach USD 20.8 billion by 2031 at 35.5% CAGR.
Which region leads global demand for printed construction?
North America held the largest regional share at 32.4% in 2025, supported by defense-backed projects and improving housing finance access.
Which region is growing the fastest through 2031?
Asia Pacific is projected to record the fastest regional growth at 37.6% CAGR through 2031.
What construction method is used the most today?
Extrusion led by construction method with 62.3% share in 2025 because it is the most mature and jobsite-compatible process.
Page last updated on:






