
Market Overview
| Study Period | 2020 - 2031 |
|---|---|
| Market Size (2026) | USD 32.85 Billion |
| Market Size (2031) | USD 41.74 Billion |
| Growth Rate (2026 - 2031) | 4.91% CAGR |
| Fastest Growing Market | Asia-Pacific |
| Largest Market | Asia Pacific |
| Market Concentration | Low |
Major Players *Disclaimer: Major Players sorted in no particular order Image © Mordor Intelligence. Reuse requires attribution under CC BY 4.0. | |
Pharmaceutical Glass Packaging Market Analysis by Mordor Intelligence
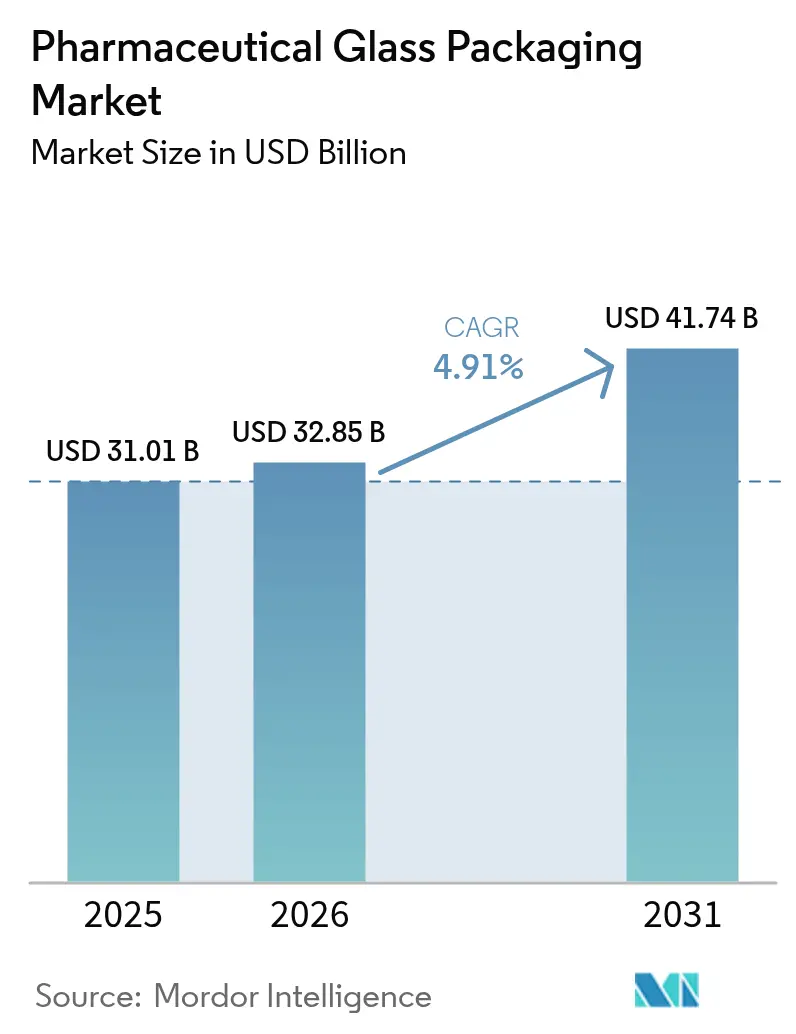
The Pharmaceutical Glass Packaging Market size was valued at USD 31.01 billion in 2025 and is estimated to grow from USD 32.85 billion in 2026 to reach USD 41.74 billion by 2031, at a CAGR of 4.91% during the forecast period (2026-2031).
Demand elevation stems from the maturing biologics pipeline, vaccine fill-finish investments that outlasted the pandemic emergency, and the drug industry preference for ready-to-use containers that protect sterility and speed line changeovers. Producers have responded by shifting capital toward Type I borosilicate furnaces and AI-enabled inspection, reducing cosmetic rejects and securing supply contracts with top biopharma firms. The pharmaceutical glass packaging market is also benefiting from government sustainability mandates that reward glass recyclability, although cyclic olefin polymer syringes are beginning to encroach on the 1-3 milliliter segment.
Asia-Pacific dominates volume, while North America and Europe concentrate revenue through premium RTU formats and surface-engineered vials. Vials accounted for 40.53% of 2025 revenue, but cartridges and prefillable syringes are projected to post the fastest gains as drug makers orient high-value therapies toward patient self-administration. Price volatility for soda ash and natural gas remains the most visible cost threat, prompting dual-sourcing and faster expansion of Asian capacity. Competitive intensity is moderate; the three largest players controlled just under one-half of revenue in 2025, yet regional specialists are scaling quickly as fill-finish shifts closer to emerging-market consumers.
Key Report Takeaways
- By product, vials captured 40.53% of the pharmaceutical glass packaging market share in 2025, and cartridges and prefillable syringes are forecast to grow at a 5.93% CAGR through 2031.
- By glass type, Type I borosilicate recorded a 54.56% revenue share in 2025 and is projected to expand at a 5.67% CAGR, while Type II treated soda-lime lags the overall growth rate.
- By drug formulation, injectables accounted for 67.41% of the pharmaceutical glass packaging market in 2025 and are projected to grow at a 5.71% CAGR between 2026-2031.
- By end user, biotech firms are the fastest-growing segment, with a 5.89% CAGR, although pharma innovator companies still accounted for 47.31% of 2025 demand.
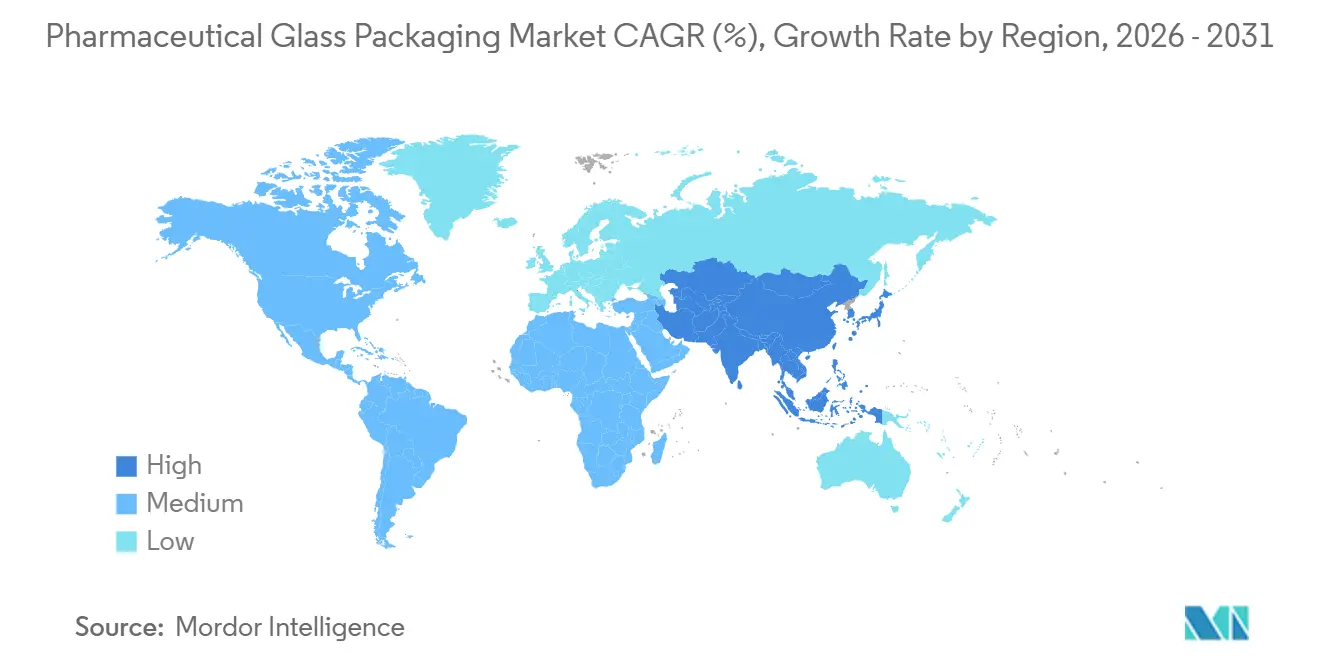
- By geography, Asia-Pacific led with a 34.96% revenue share in 2025 and is set to register the highest regional CAGR at 5.88% through 2031.
Note: Market size and forecast figures in this report are generated using Mordor Intelligence’s proprietary estimation framework, updated with the latest available data and insights as of 2026.
Global Pharmaceutical Glass Packaging Market Trends and Insights
Drivers Impact Analysis*
| Driver | (~) % Impact on CAGR Forecast | Geographic Relevance | Impact Timeline |
|---|---|---|---|
| Expansion Of Biologics And Injectable Drugs Pipeline | +1.2% | Global, Led By North America, Europe, Asia-Pacific | Long Term (≥ 4 Years) |
| Mounting Vaccine Fill-Finish Capacity Post-COVID | +0.8% | Asia-Pacific, Africa, South America | Medium Term (2–4 Years) |
| Shift To Ready-To-Use Vials And Syringes | +0.7% | North America, Europe, Asia-Pacific | Medium Term (2–4 Years) |
| Rising Demand For High-Value Borosilicate Type I Glass | +0.9% | North America, Europe, Global | Long Term (≥ 4 Years) |
| Pharma Sustainability Mandates Boosting Glass Recyclability | +0.4% | Europe, North America, Select Asia-Pacific | Long Term (≥ 4 Years) |
| AI-Enabled Inline QC Reducing Glass Defect Rates | +0.5% | North America, Europe, Asia-Pacific | Medium Term (2–4 Years) |
| Source: Mordor Intelligence | |||


Expansion Of Biologics And Injectable Drugs Pipeline
The pharmaceutical glass packaging market is riding a surge of late-stage biologics, with 2,517 candidates in Phase II and III by 2025.[1]IQVIA Institute, “Global Trends in R&D 2025,” iqvia.com More than two-thirds require parenteral delivery in low-extractable Type I containers to safeguard protein structure during a 24-month shelf life. Annual launch volumes for monoclonal antibody therapies can top 150 million vials or prefillable syringes, establishing a multi-year base load that smooths capacity utilization. Cell and gene therapies now account for almost one-fifth of the pipeline and require pre-sterilized vials with extractables below 1 ppm, raising the technical barrier for competing materials. Investment in RTU filling lines by both West Pharmaceutical Services and Stevanato Group underpins this shift toward high-purity formats.
Mounting Vaccine Fill-Finish Capacity Post-COVID
Global fill-finish throughput expanded 47 % between 2020-2024, adding 8.3 billion annual doses, largely in India, Indonesia, South Africa, and Brazil.[2]World Health Organization, “Global Vaccine Market Report 2024,” who.int Those lines were standardized on 2- and 5-milliliter Type I vials compatible with mRNA and viral-vector vaccines. Serum Institute of India intends to retain 80 % of its COVID-era output for routine immunizations, locking in roughly 1.2 billion vials per year. Twenty-three low- and middle-income countries have now established or expanded domestic vaccine lines, and 19 of them specify Type I glass, reflecting regulatory familiarity.
Shift To Ready-To-Use Vials And Syringes
RTU containers already command one-third of the North American and European vial market. A 2024 survey of 87 CDMOs showed a 62% drop in in-house washing in favor of RTU formats, cutting batch rejection by 40% and trimming 6 to 9 months from facility qualification. FDA guidance issued in 2024 effectively mandates validated RTU supply chains for parenterals with shelf lives beyond 18 months, accelerating adoption. EZ-fill vials, now embedded at 14 of the top 20 pharma firms, emphasize how integrated inspection and laser coding raise the switching cost for alternative suppliers ISPE.ORG.
Rising Demand for High-Value Borosilicate Type I Glass
The 2024 FDA clearance of Corning’s boron-free Valor composition marks the first new pharma glass category in a century. [2]Corning Inc., “Pharmaceutical Glass Packaging Industry Transformed by Valor Glass,” corning.com Valor eliminates delamination yet retains chemical durability essential for potent injectables. Parallel USP draft Chapter 1660 gives industry a predictive assay to screen inner-surface durability, encouraging early container choice during drug development. Partnerships such as SGD Pharma’s Velocity Vials joint venture in India are scaling regional Type I supply to meet surging biologics output. As ultra-concentrated monoclonal antibodies become mainstream, container performance requirements rise, consolidating share for premium borosilicate lines and reinforcing pricing power in the pharmaceutical glass packaging market.
Restraints Impact Analysis*
| Restraint | (~) % Impact on CAGR Forecast | Geographic Relevance | Impact Timeline |
|---|---|---|---|
| Rapid adoption of COP/COC polymer syringes | -0.6% | Global, particularly North America and Europe | Medium term (2-4 years) |
| Volatile soda-ash and energy prices inflating glass cost | -0.4% | Global, most severe in Europe and Asia-Pacific | Short term (≤ 2 years) |
| Delamination and breakage concerns in ultra-potent drugs | -0.3% | Global, concentrated in North America and Europe | Medium term (2-4 years) |
| Regional container-glass furnace capacity shortages | -0.2% | Europe and North America, emerging in Asia-Pacific | Short term (≤ 2 years) |
| Source: Mordor Intelligence | |||
Rapid Adoption Of COP/COC Polymer Syringes
Polymer syringes reached 18% market share in 2025 as drug firms moved to eliminate silicon oil and tungsten leachables from glass barrels. Terumo’s March 2025 acquisition of Recipharm’s assets will triple polymer syringe capacity to 600 million units by 2027, intensifying competitive pressure on glass producers. Device designers also cite a 25% gain in dimensional precision, enabling higher-speed filling without additional vision checks, thereby lowering the total cost of ownership for high-throughput biologics lines. Regulatory acceptance is expanding after the FDA acknowledged COP and COC as suitable parenteral container materials in its 2024 guidance on container–closure systems.
Volatile Soda-Ash and Energy Prices Inflating Glass Cost
Producer Price Index data show glass prices rising 4.5% in 2024, even as other materials stabilize. WE Soda’s USD 1.425 billion acquisition of Genesis Alkali concentrates 9.5 million t soda-ash capacity under one group, highlighting supply risk for converters. European furnaces contend with energy inflation; Verallia reported a 17.6% revenue dip despite furnace electrification plans aimed at cost control.[3]Glass Packaging Institute, “Glass Recycling and Sustainability Report 2025,” gpi.orgSuch pressure squeezes margins and could hasten polymer substitution if glass pass-through pricing proves unsustainable. Nonetheless, pharma containers command premium pricing that buffers some volatility, containing the negative impact on the pharmaceutical glass packaging market CAGR.
*Our forecasts treat driver/restraint impacts as directional, not additive. The impact forecasts reflect baseline growth, mix effects, and variable interactions.
Segment Analysis
By Product: Vials Anchor Vaccine And Small-Molecule Demand
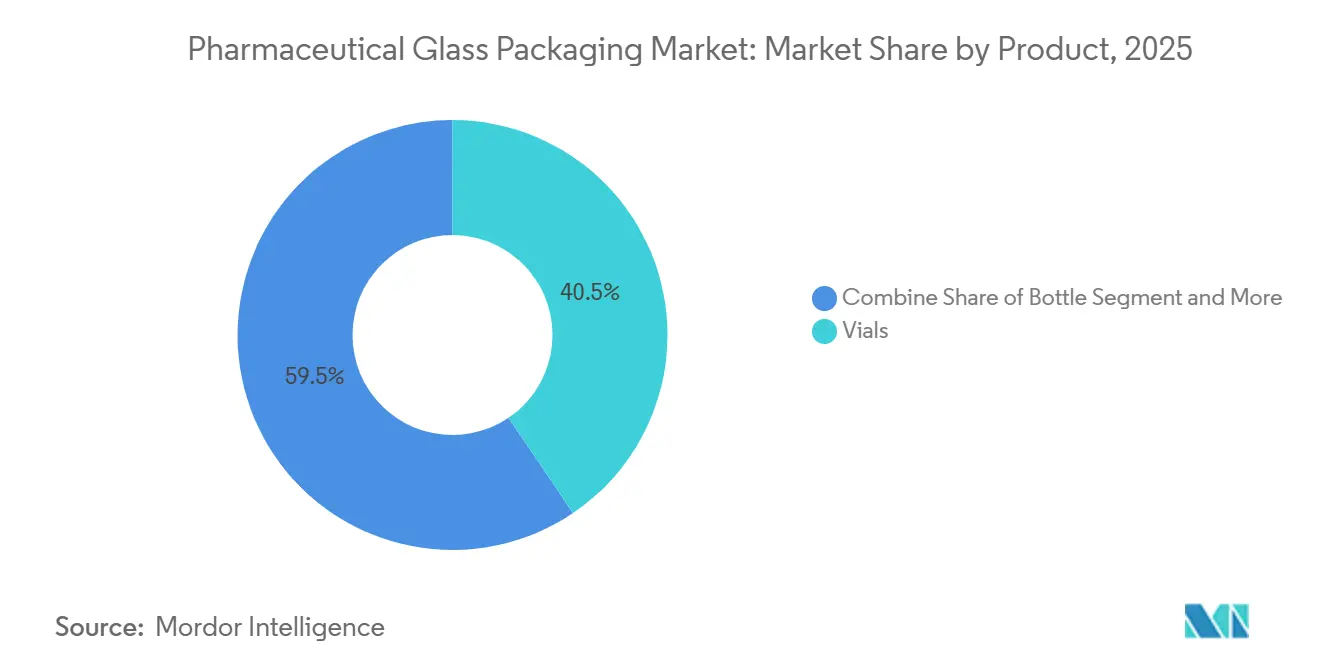
Vials held a 40.53% share of the pharmaceutical glass packaging market in 2025, reflecting their entrenched position in vaccine fill-finish, lyophilized biologics, and multi-dose injectable applications, where established filling lines and regulatory familiarity give the format an edge. Cartridges and prefillable syringes are projected to grow at a 5.93% CAGR from 2026-2031, driven by patient-centric delivery for chronic diseases and the drug industry’s pivot toward devices that improve adherence and reduce hospital visits. Bottles, used for oral liquids and ophthalmic preparations, register modest gains as generic producers in India and China expand pediatric suspension portfolios, while ampoules slip as single-use convenience is outweighed by higher breakage during automated filling.
The swing from vials to prefillable syringes accelerates in biologics, where Stevanato Group’s EZ-fill nests and Gerresheimer’s Gx RTF syringes bypass secondary packaging and cold-chain complexity. Nipro’s October 2024 partnership with Corning to distribute Velocity Vial, which reduces particulate levels by up to 96%, highlights the push to sustain vial relevance even as syringe adoption climbs. Cartridges dominate insulin and GLP-1 devices, leveraging multi-dose precision and West Pharmaceutical Services’ Westar ready-to-use components as the de-facto standard. Ampoules still serve emergency medicine and veterinary markets that prize hermetic sealing, and the “other product” niche, dual-chamber vials and blow-fill-seal, expands at a 4.2 % CAGR as CDMOs pursue proprietary packages that deter biosimilar substitution.


By Glass Type: Type I Borosilicate Dominates High-Value Therapies
Type I borosilicate glass captured 54.56% of the pharmaceutical glass packaging market share in 2025 and is forecast to expand at a 5.67% CAGR through 2031 as biologics, vaccines, and high-pH injectables standardize on its chemical durability. Type II treated soda-lime, upgraded by sulfur dioxide surface treatment, serves price-sensitive generics but loses ground as global filings increasingly default to Type I to avoid costly revalidation. Type III soda-lime, limited to non-parenteral formats such as oral liquids and topicals, grows only 3.8% CAGR as lightweight plastics erode share in pediatric suspensions.
Plasma ion-exchange research from the University of Padua shows that modified Type I surfaces cut protein adsorption 68 % and sodium leaching by 82 %, enabling concentrations above 150 mg/ml without viscosity reducers, a breakthrough attracting antibody-drug conjugate developers. Schott’s USD 450 million investment program, announced in 2025 and spanning Germany and India, aims to reduce 12-18-month lead times for custom Type I molds. Type II glass clings to markets constrained by budgetary pressures, notably sub-Saharan Africa and South Asia, yet its 35-50% price discount fails to entice innovators locked into Type I by stringent extractables tests. “Other glass” lines, amber formats for light-sensitive drugs and low-friction coatings like Velocity Vial, push a 6.1 % CAGR as firms chase functional differentiation, and ISO 15378 traceability rules further cement Type I dominance.
By Drug Formulation: Injectables Drive Two-Thirds Of Demand
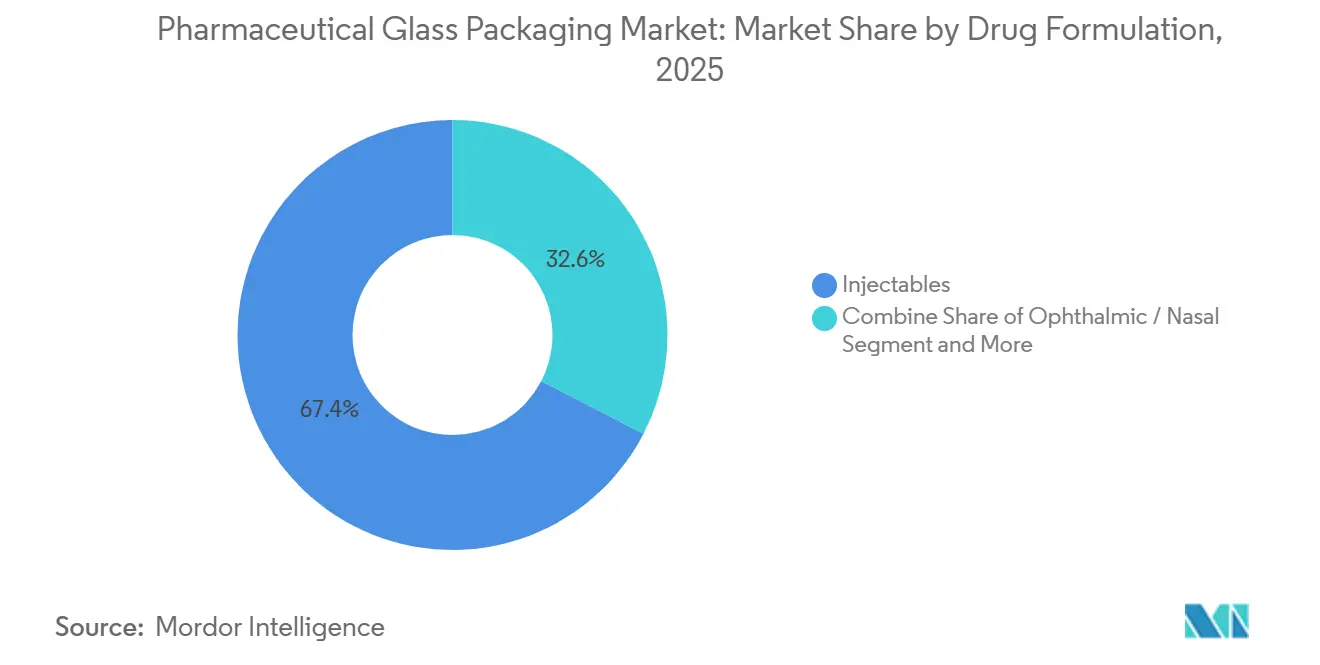
Injectables accounted for 67.41% of pharmaceutical glass packaging demand in 2025 and are projected to grow at a 5.71% CAGR to 2031, underpinned by 2,517 biologics and biosimilars in late-stage trials that require parenteral dosing. Therapeutic efficacy, avoidance of first-pass metabolism, and strict container-closure integrity requirements make Type I vials and syringes indispensable for doses requiring a 24-36-month shelf life. Oral liquids, pediatric suspensions, antacids, and cough syrups rise at a 3.9% CAGR as Indian and Chinese generics expand, but sachets and orally disintegrating tablets pressure glass bottles by eliminating refrigeration.
Ophthalmic and nasal formats, 8.2 % of 2025 demand, rely on glass barrier properties for preservative-free multi-dose eye drops, yet face plastic droppers in wealthier markets. Topicals, the smallest sliver at 4.1 %, shrink as cosmetic-grade plastics win on weight and breakage resistance. The injectable trajectory hinges on subcutaneous formulations demanding ultra-low extractable glass; Bormioli Pharma’s plasma-treated vials now measure extractables below 0.5 ppm and are used by seven of the top-15 biotech firms. FDA guidance under USP 1207, finalized in 2024, effectively mandates validated glass-elastomer systems for any parenteral with a shelf life exceeding 18 months, turbo-charging the adoption of ready-to-use syringes.
By End-User: Biotech Firms Outpace Legacy Pharma
Pharma innovators accounted for 47.31% of 2025 revenue, leveraging multi-year supply deals with Gerresheimer, Schott, and Stevanato, but biotech firms expanded faster at a 5.89% CAGR as cell and gene therapy pipelines favor integrated RTU syringes that compress validation timelines. Generics and CMOs: 28.4% of demand, with a 4.3% CAGR, while navigating wafer-thin margins and commoditized injectables; yet biosimilar launches that mirror innovator packaging buoy baseline volume. Compounding pharmacies, 3.7 % share, inch forward 3.2 % CAGR as regulators tighten sterility rules and steer operators toward pre-filled single-dose packs.
Veterinary pharma is a stealth growth pocket, charting a 6.2% CAGR as livestock vaccination intensifies in Asia-Pacific and South America and companion-animal biologics adopt human-grade vials for dosing accuracy. Biotech's preference for prefillable syringes and autoinjector cartridges grants suppliers sticky, high-margin contracts; West disclosed that biotech clients rose from 31% to 39% of proprietary product sales between 2022-2025. Generic makers chase cost and supply security, often locking multi-year Type II glass contracts where local regulators permit. Direct-to-patient distribution by emerging biotech firms further shifts bargaining power toward packaging suppliers that offer digital track-and-trace and cold-chain integration.
Geography Analysis
Asia-Pacific captured 34.96 % in 2025, reflecting China’s 9 billion-unit output and India’s emergence as a global fill-finish hub. Japanese firms focus on high-precision syringes and surface-engineered vials exported worldwide. Regulatory alignment with ICH Q3D promotes standardization around Type I glass, driving a 5.2% regional CAGR.
Asia-Pacific is poised for a 5.88% CAGR, driven by local vaccine mandates and the African Vaccine Manufacturing Initiative. Furnace builds in South Africa, Kenya, and Nigeria offset logistical hurdles associated with raw-material imports. Capacity still lags demand, so multinationals are entering joint ventures to secure early market share.
Europe and North America together accounted for 42.1% of 2025 demand, driving trading volume growth and margin accretion through RTU conversions and AI inspection rollouts. Recycling targets under the EU Green Deal raise cullet recovery rates to 78% in leading member states, reinforcing glass’s sustainability narrative. South America advances at a 4.7% CAGR, led by Brazil’s biosimilar push and government procurement rules that localize packaging.

Regulatory Landscape
Pharmaceutical glass packaging for regulated markets is shaped by compendial and GMP expectations that define container performance, material qualification, and documentation for parenteral use. In the United States, USP-NF requirements for glass containers, including the general chapters on hydrolytic resistance and chemical durability, are central reference points, while EU filings typically rely on European Pharmacopoeia expectations and EMA dossier requirements in CTD Module 3 for packaging materials and container-closure integrity.
Regulatory focus is moving toward performance-based characterization and broader material families for glass packaging systems. In May 2026, the USP Pharmacopeial Forum PF 52(3) published draft proposals to update the USP 660 and 1660 chapters, aiming to modernize identification and classification methods and add approaches such as ICP-based testing, with further industry alignment activity reflected in a USP and PDA workshop held in June 2026. For suppliers and drug sponsors, this direction increases the need for extractables and leachables packages, surface-durability screening, and traceable GMP systems such as ISO 15378 across global submissions.
Value Chain Analysis
The value chain begins with upstream raw materials and utilities, including silica sand, boron-containing inputs for borosilicate, soda ash, limestone, alumina, and cullet, with energy (natural gas and electricity) serving as a key cost and availability lever for furnace operations. Producers convert these inputs through high-temperature melting (often above 1500 C), then follow forming routes, including tubing and molded container pathways, followed by annealing and multi-stage dimensional and cosmetic inspection. For parenteral packs, defect prevention and surface-chemistry control (to mitigate delamination and particulate risk) are as consequential as throughput.
Midstream participants include manufacturers such as Gerresheimer, Schott, Stevanato Group, SGD Pharma, Nipro, and Shandong Medicinal Glass, alongside equipment and inspection specialists, as well as downstream services for washing, sterilization, and ready-to-use (RTU) nesting and packaging. Downstream, sales flow either directly to pharma innovators, biotech firms, and CDMOs through long-term qualification-led supply agreements, or through distribution into local fill-finish ecosystems, where ISO 15378 certification and validated traceability systems act as gatekeepers. Bottlenecks are tied to capital-intensive furnaces that limit rapid capacity response, concentration risks in high-purity raw materials, and lead times driven by tooling, mold qualification, and regulated change control.
Competitive Landscape
Three global leaders, Gerresheimer, Schott, and Stevanato Group, command roughly half of 2025 revenue, yet the field is fragmenting as Shandong Medicinal Glass, Piramal Glass, and Şişecam Group scale capacity nearer to demand centers. Incumbents hedge by expanding borosilicate furnaces in India and Africa while embedding inspection software and low-friction coatings that raise switching costs.
AI vision systems from Körber Pharma, integrated into Stevanato inspection lines, improve sub-micron particle detection and cut false rejects 35 %. Corning’s Velocity Vial, distributed by Nipro, delivers 20-50 % fill-line efficiency gains, proving that surface engineering can outweigh furnace scale. Polymer syringe specialists Daikyo Seiko, Ypsomed, and Terumo chip away at the 1-3 milliliter glass stronghold by eliminating the risk of silicon oil contamination.
ISO 15378 certification now acts as a gatekeeper; only 37 glass producers met the standard by 2025, concentrating compliant supply and justifying premium pricing. Regional challengers must therefore invest in both furnace upgrades and compliance audits to penetrate regulated markets.
Pharmaceutical Glass Packaging Industry Leaders
Gerresheimer AG
Corning Incorporated
SGD SA (SGD Pharma)
Stevanato Group
Schott AG
- *Disclaimer: Major Players sorted in no particular order


Market Opportunities and Future Outlook
Opportunities are tightening around efforts to reduce qualification time and contamination risk for injectable drugs by pairing high-durability Type I containers with validated RTU supply chains, advanced inspection, and surface-engineered inner layers aimed at delamination and extractables. As USP updates to glass chapters move toward performance-based evaluation, suppliers have room to differentiate with additional material families referenced in the proposed USP 660 and 1660 updates published in May 2026, including aluminosilicate and quartz approaches, which drug sponsors may support with more predictive data packages rather than composition-only claims.
Regionalization and resilience programs also create clearer lanes for localized supply into regulated markets. SCHOTT Pharma inaugurated expanded vial production at its Lebanon, Pennsylvania site in 2026 with support from BARDA, reflecting funding and procurement priorities tied to domestic pharmaceutical supply security and vaccine and essential-medicine readiness. Platform plays that connect packaging with validated sterilization and delivery-format support, such as SGD Pharma partnering with Prince Sterilization Services in March 2026 to validate and launch the My Sterinity Nasal platform in North America using Type I glass vials, reflect demand for integrated manufacturing and delivery workflows rather than unit-price competition alone.
Recent Industry Developments
- January 2026: Stevanato Group began validation of a next-generation RTU vial nest compatible with laser coding and inline camera inspection. The program targets commercialization in Q4 2026 and supports higher-throughput, lower-intervention fill-finish operations where container traceability and automated QC are increasingly embedded in line design.
- September 2025: Schott AG announced a USD 450 million program to add Type I borosilicate production in Germany and India. The plan expands supply for high-value injectable packaging and addresses lead-time and availability constraints for premium vials as biologics and vaccine fill-finish demand stays elevated.
- October 2024: Nipro partnered with Corning to distribute Velocity Vial, positioning a surface-engineered vial proposition that reduces particulate levels and improves fill-line performance. The collaboration strengthens differentiated vial offerings at a time when RTU adoption and tighter particulate controls are raising switching costs for qualified packaging systems.


Research Methodology Framework and Report Scope
Market Definition and Coverage
This market covers the value of glass primary packaging used to fill, store, and deliver pharmaceutical products, including containers such as bottles, vials, ampoules, cartridges, and prefillable syringes across major regions.
Scope exclusions: Secondary paper cartons, plastic primary packs, and non-pharma industrial glass containers are not counted in this sizing.
Segmentation Overview
- By Product
- Bottles
- Vials
- Ampoules
- Cartridges and Prefillable Syringes
- Other Product
- By Glass Type
- Type I Borosilicate
- Type II Treated Soda-Lime
- Type III Soda-Lime
- Other Glass Type
- By Drug Formulation
- Injectables
- Oral Liquids
- Ophthalmic / Nasal
- Topical
- By End-User
- Pharma Innovator Companies
- Generic and CMOs
- Biotech Firms
- Compounding Pharmacies
- Veterinary Pharma
- By Geography
- North America
- United States
- Canada
- Mexico
- Europe
- Germany
- United Kingdom
- France
- Italy
- Spain
- Russia
- Rest of Europe
- Asia-Pacific
- China
- India
- Japan
- South Korea
- Australia and New Zealand
- Rest of Asia-Pacific
- Middle East and Africa
- Middle East
- Africa
- South America
- Brazil
- Argentina
- Rest of South America
- North America
Data Sources, Market Sizing, and Validation
Desk Research
To shape the market boundaries and build a realistic demand picture, we first reviewed public and official references such as US FDA guidance for container closure systems, USP chapters related to glass containers, and European Pharmacopoeia information on packaging materials. For trade and production signals, we also used sources such as UN Comtrade, national statistics offices, and customs releases that help indicate glass container movements and manufacturing trends.
After that, the desk work was extended using company annual reports, investor presentations, sustainability updates, and reputable press coverage to understand capacity additions, quality shifts (for example, Type I borosilicate versus soda-lime), and mix changes toward injectable-ready formats. Where helpful, paid subscriptions for company financials and intelligence, patent databases, and shipment-level import and export data were used to cross-check product focus and regional exposure. These desk sources are not exhaustive, and we referred to additional documents for data collection, validation, and research clarification.
Primary Interviews and Surveys
Primary work was used to pressure-test assumptions that desk sources cannot fully confirm, especially around container mix, pricing movement, and how demand shifts between molded and tubular formats. We spoke with a mix of packaging suppliers, pharma manufacturing stakeholders, and downstream users across APAC, EMEA, and the Americas so the model reflects differences in injectable intensity, regulatory expectations, and supply availability by region.
Distribution of primary research fieldwork respondents
| Company type | Respondent position | Region |
|---|---|---|
| Top tier: 25% | CXOs: 15% | APAC: 50% |
| Mid tier: 58% | Functional/Unit leaders: 38% | EMEA: 29% |
| Smaller Players: 17% | Managers: 47% | Americas: 21% |
Market-Sizing & Forecasting
Sizing starts with a top-down build where pharma output and mix indicators are translated into a glass-container demand pool by region, and then mapped to typical container formats used for each drug form. Once that structure is in place, we corroborate totals using selective bottom-up checks such as sampled supplier revenue splits, channel checks on unit shipments, and ASP times volume approximations for key containers, then we adjust where gaps show up.
Inputs used in the model include the share of injectables versus oral liquids in regional pharma manufacturing, the mix shift between vials, ampoules, bottles, and prefillable syringes, glass-type preference changes (Type I versus Type II and Type III), export and import movement for glass containers, and observed pricing changes tied to energy costs and quality upgrades (for example, higher value containers for sensitive biologics). For forecasting, we rely on scenario analysis supported by a simple multivariate relationship between injectable growth, regional pharma production expansion, and mix shifts toward higher performance packaging. When bottom-up signals are incomplete for smaller countries, we bridge the gap using regional ratios that were validated during primary discussions and by comparing to trade and production patterns.
Data Validation & Update Cycle
Model outputs are checked against independent signals such as regional pharma manufacturing growth, glass container trade direction, and published capacity additions, and any large variances are flagged for review. Outliers are revisited by rechecking the underlying conversion factors, price assumptions, and mix shares, then a second analyst review is done before sign-off.
The report is refreshed annually, and interim updates are triggered when material events occur such as major capacity changes, sharp energy driven pricing moves, or policy shifts affecting pharmaceutical packaging requirements. Before delivery, a final pass is completed to incorporate the latest public updates and any new primary feedback we received, so clients get a current and consistent view.
Mordor Intelligence's Pharmaceutical Glass Packaging Market Estimate Compared With Other Published Estimates
Published market sizes for pharmaceutical glass packaging can look far apart because firms do not always count the same container set, and they may apply different price and mix assumptions for injectables versus oral liquids. The base year also changes the result, since energy costs and quality upgrades can move ASPs quickly, and not every study refreshes its inputs at the same pace.
In practice, the biggest gap drivers are whether prefillable syringes and cartridges are fully included, how Type I borosilicate is priced compared to treated and regular soda-lime, and whether demand is tied to a realistic injectable output mix by region versus a broad packaging spend proxy. The spread also grows when aggressive growth paths are used for biologics without cross-checking against capacity and trade signals, which is why the container-mix and validation steps matter, a modeling choice applied by Mordor Intelligence.
Benchmark comparison
| Source | Market Size | Gaps in Research Methodology |
|---|---|---|
| Mordor Intelligence | USD 32.85 B (2026) | |
| Global Research Publisher A | USD 20.97 B (2025) | Uses an earlier base year and a longer forecast window, and the public summary does not clearly show how injectable container mix and glass-type pricing are converted into value totals, which can pull the starting value down. |
| Global Research Publisher B | USD 23.40 B (2025) | Applies a faster growth profile and reports a lower 2025 level, which can happen when the scope leans more on broader packaging revenue pools and less on region-wise container format splits (vials, ampoules, bottles, and prefillable formats) with explicit ASP logic. |
The table shows that different base years and different ways of converting container demand into dollar value can move the result by several billions. When the scope is kept tight to primary glass pharma containers and the model is anchored to injectable mix, format shares, and observable trade and capacity signals, the final number stays easier to trace and repeat across updates.


Key Questions Answered in the Report
How large will global demand for pharmaceutical glass containers be by 2031?
The pharmaceutical glass packaging market is projected to reach USD 41.74 billion by 2031.
Which product category leads sales today?
Vials led with 40.53 % revenue share in 2025, mainly for vaccines and small-molecule injectables.
What is the fastest-growing container format?
Cartridges and prefillable syringes are forecast to grow at a 5.93 % CAGR through 2031 as self-administration devices proliferate.
Why is Type I borosilicate glass so dominant?
Its chemical durability prevents delamination and meets regulatory standards for biologics, supporting 54.56 % share in 2025.
Which region will expand the quickest?
Asia-Pacific is set to post a 5.88 % CAGR from 2026-2031, propelled by local vaccine manufacturing mandates.
Page last updated on:






