
Vision Analytics Software For Manufacturing Market Size and Share
Market Overview
| Study Period | 2020 - 2031 |
|---|---|
| Market Size (2026) | USD 2.38 Billion |
| Market Size (2031) | USD 3.99 Billion |
| Growth Rate (2026 - 2031) | 10.89 % |
| Fastest Growing Market | Asia-Pacific |
| Largest Market | Asia-Pacific |
| Market Concentration | Medium |
Major Players *Disclaimer: Major Players sorted in no particular order Image © Mordor Intelligence. Reuse requires attribution under CC BY 4.0. | |
Vision Analytics Software For Manufacturing Market Analysis by Mordor Intelligence
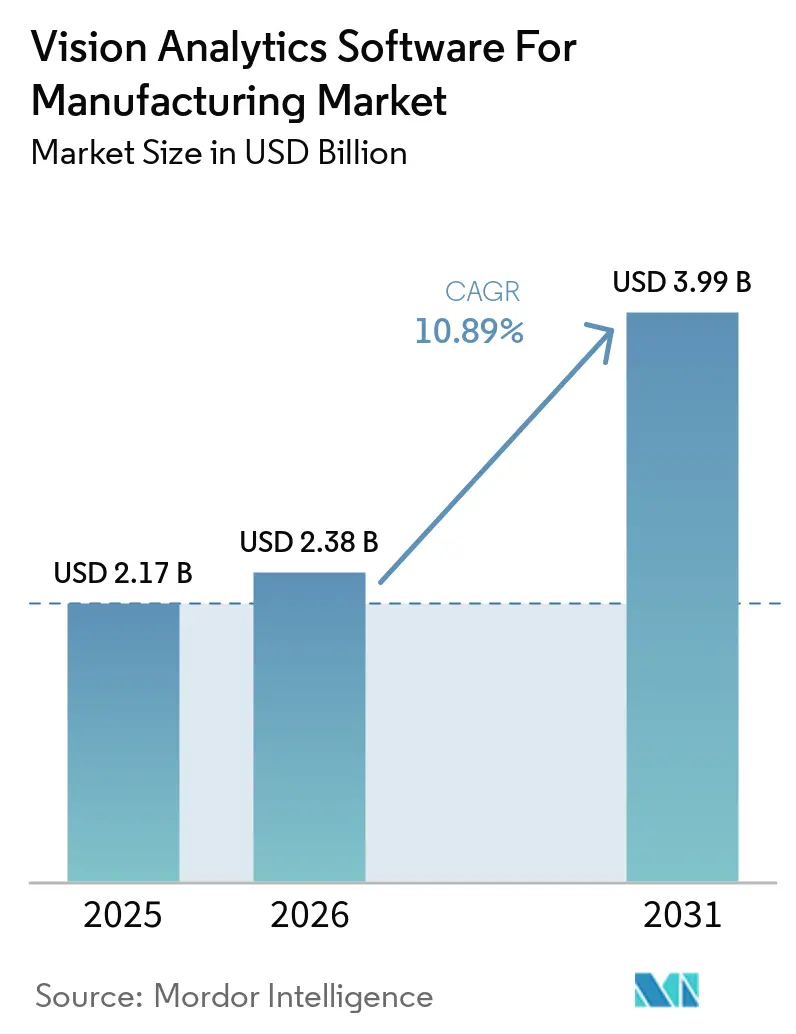
The Vision analytics software for manufacturing market size was valued at USD 2.17 billion in 2025 and estimated to grow from USD 2.38 billion in 2026 to reach USD 3.99 billion by 2031, at a CAGR of 10.89% during the forecast period (2026-2031). Manufacturers are shifting from periodic human inspection to continuous image-based control on production lines. Electronics, semiconductor, automotive, and EV battery plants need more consistent inspection as tolerances narrow. Lower-cost image sensors and edge-based deep learning are making deployments more practical for mid-sized plants. Buyers are also using cloud tools to train models, manage versions, and compare performance across sites while keeping local inference on the factory floor. Data labeling, legacy-system integration, and cybersecurity requirements will continue to shape vendor selection and rollout timing.
Key Report Takeaways
- By software type, Image Processing and Analysis Software held 30.21% of the vision analytics software for manufacturing market share in 2025, while AI/Deep Learning Vision Analytics Software is projected to expand at a 11.32% CAGR through 2031.
- By application, Quality Inspection and Defect Detection accounted for 35.65% share in 2025, while Predictive Maintenance is projected to grow at a 11.45% CAGR through 2031.
- By deployment, Edge/On-Premises held 59.88% of the Vision analytics software for manufacturing market in 2025, while Cloud-Based deployment is projected to expand at a 11.78% CAGR through 2031.
- By industry vertical, Electronics and Semiconductors held a 24.78% revenue share in 2025, and is projected to grow at a CAGR of 11.98% through 2031.
- By geography, Asia-Pacific held 36.54% share in 2025 and is projected to grow at a 11.61% CAGR through 2031.
Note: Market size and forecast figures in this report are generated using Mordor Intelligence’s proprietary estimation framework, updated with the latest available data and insights as of January 2026.
Global Vision Analytics Software For Manufacturing Market Trends and Insights
Drivers Impact Analysis*
| Driver | (~) % Impact on CAGR Forecast | Geographic Relevance | Impact Timeline |
|---|---|---|---|
| Rising Demand for Zero-Defect Manufacturing | +3.2% | Global, with stronger demand in North America, Germany, Japan, and South Korea | Short term (≤ 2 years) |
| AI-Enabled Electronics and Semiconductor Inspection | +2.5% | Asia-Pacific, especially China, South Korea, Taiwan, and Japan, with spillover to North America | Short term (≤ 2 years) |
| EV Battery Throughput and Traceability Requirements | +1.8% | North America, Germany, South Korea, and China | Medium term (2-4 years) |
| Edge AI Inference and Brownfield Connectivity Improvements | +1.4% | Global, with early adoption in Europe and North America | Medium term (2-4 years) |
| Manufacturing Labor and Quality-Engineering Shortages | +1.1% | North America, Europe, and Japan | Medium term (2-4 years) |
| Closed-Loop Quality Optimization Across Multi-Plant Networks | +0.8% | Global enterprise manufacturers | Long term (≥ 4 years) |
| Source: Mordor Intelligence | |||
Rising Demand for Zero-Defect Manufacturing
Zero-defect requirements are increasing the need for continuous inspection across the Vision analytics software market for manufacturing and premium manufacturing supply chains. Tier-1 OEMs are tightening defect-per-million targets, which makes sampling less suitable at high production volumes. A 2026 Cognex survey of more than 500 manufacturers, integrators, and OEMs found that 57% already used AI in machine-vision operations, while 30% planned near-term adoption. Adoption was strongest in automotive, electronics, and logistics, where product variation and tight tolerances create higher inspection demands. Once automated inspection requirements are incorporated into supplier quality agreements, manufacturers are likely to treat the software as core operating infrastructure. ISO 9001:2015 and automotive quality-management requirements also support systems that can produce traceable inspection records at production speed.
Expansion of AI-Enabled Electronics and Semiconductor Inspection
Advanced semiconductor production requires Vision analytics software for manufacturing market systems that can identify small and varied defect patterns. Rule-based optical inspection can create high false-positive volumes when defect signatures become more complex. NVIDIA stated that TSMC uses NVIDIA accelerated computing across fab operations, including optimization, lithography, process control, and inspection. The Vision analytics software for the manufacturing market benefits when production images are labeled, improving model performance over time. That data accumulation can strengthen yield-management capabilities at facilities that deploy earlier. Automated inspection also supports quality management requirements for advanced packaging and semiconductor manufacturing.
EV Battery Throughput and Traceability Requirements
EV battery production requires Vision analytics software for manufacturing market solutions for inline inspection across cell, module, and pack assembly activities. Manual processes cannot maintain complete coverage at gigafactory throughput levels. The EU Battery Regulation requires information that supports battery traceability and the Battery Passport. BMW stated that its Plant Woodruff facility uses AI assistants and agents to monitor production steps in line, supported by 250 robots for 100% end-of-line inspection. The company expects its first series-production batteries from the plant in December 2026. Visible-light, thermal, and X-ray imaging increase the need for software that can handle diverse inspection inputs within a single production environment.
Edge AI Inference and Brownfield Connectivity Improvements
Brownfield plants often depend on PLCs, SCADA historians, and industrial protocols that were not designed for Vision analytics software for AI inference workflows in the manufacturing market. Manufacturers need dependable connections between those systems and vision analytics applications. Edge processors can support local analysis of camera streams without a cloud round-trip. Gateway products can also connect plant data with analytics systems across older facilities. The Vision analytics software for the manufacturing market is likely to favor providers that manage model versions, performance drift, and fleet-wide updates across mixed equipment estates.
Restraints Impact Analysis*
| Restraint | (~) % Impact on CAGR Forecast | Geographic Relevance | Impact Timeline |
|---|---|---|---|
| High Cost of Labeled Defect Data and Model Validation | -1.2% | Global, most acute in high-mix plants in North America, Europe, and Japan | Short term (≤ 2 years) |
| Legacy MES, SCADA, PLC, and Camera Integration Complexity | -1.1% | Global brownfield facilities, concentrated in mature manufacturing economies | Medium term (2-4 years) |
| Cybersecurity and Intellectual-Property Exposure in Connected Vision Systems | -0.8% | North America and the European Union, where compliance requirements are more stringent | Medium term (2-4 years) |
| Model Drift in High-Mix, Low-Volume Production | -0.6% | Aerospace and defense, medical devices, and specialty industrial equipment globally | Long term (≥ 4 years) |
| Source: Mordor Intelligence | |||
High Cost of Labeled Defect Data and Model Validation
Supervised inspection models need labeled images of actual defects to achieve reliable results. Defects occur infrequently in many production environments, which limits the supply of useful training examples. A 2025 study in Advanced Engineering Informatics found that data collection and labeling remain labor-intensive for AI-enabled industrial defect detection. A 2025 study in the Journal of Intelligent Manufacturing found that unified models that combine supervised, weakly supervised, and unsupervised approaches can address certain labeling constraints. These approaches still need to be qualified under actual production conditions before they can be used at scale. Buyers must account for continuing labeling, validation, and engineering work when evaluating a proposed deployment.
Legacy MES, SCADA, PLC, and Camera Integration Complexity
Connecting vision analytics applications with proprietary MES, SCADA, PLC, and camera systems can lengthen implementation schedules. Older facilities may need OPC UA gateways and custom drivers for equipment with different ages and interfaces. Such work is difficult to reuse when plants operate dissimilar control systems. A greenfield facility can design connected quality systems into its initial architecture, while a retrofit can require broader integration work. IEC 62443 provides cybersecurity requirements for industrial automation and control system components and adds validation responsibilities for connected deployments.[1]International Electrotechnical Commission, “IEC 62443-4-2: Security for Industrial Automation and Control Systems,” IEC, iec.ch. European requirements under the Cyber Resilience Act add another procurement consideration for vision platforms with digital components.
*Our forecasts treat driver/restraint impacts as directional, not additive. The impact forecasts reflect baseline growth, mix effects, and variable interactions.
Segment Analysis
By Software Type: Process Monitoring Leads While Deep Learning Expands
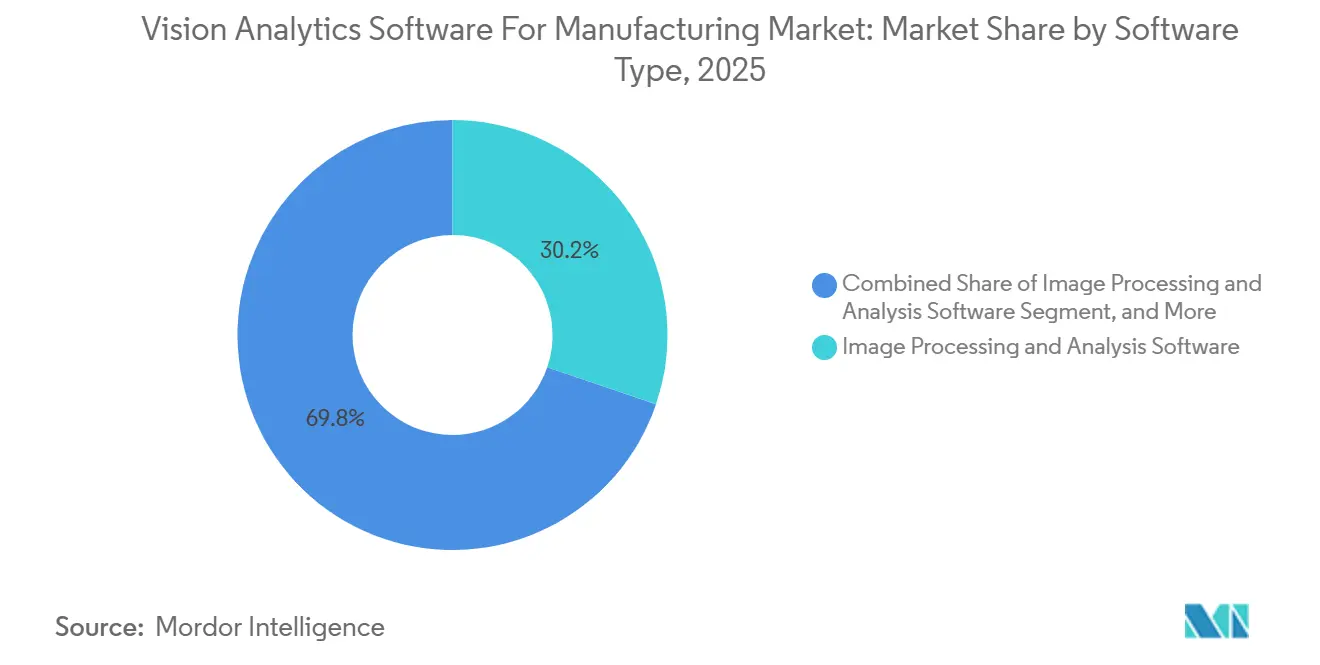
Image Processing and Analysis Software held 30.21% of the Vision analytics software for manufacturing market share in 2025. Its position in the Vision analytics software for manufacturing market reflects established investments in process-control applications at discrete manufacturing sites. These systems help teams monitor production conditions across multiple inspection stations. Incumbent providers benefit when their software is deeply connected with plant workflows. The installed base also provides buyers with a foundation for adding new AI functions rather than replacing all existing systems.
AI/Deep Learning Vision Analytics Software is projected to expand at an 11.32% CAGR through 2031. Foundation models, self-supervised training methods, and edge computing are supporting use in more complex inspection environments. Cognex introduced the In-Sight 6900 Vision Controller in April 2026 with NVIDIA Jetson technology and support for multiple AI models at the edge.[2] Cognex Corporation, “Cognex Launches In-Sight Vision Controller Powered by NVIDIA,” Cognex, investor.cognex.com. Rule-Based/Traditional Vision Analytics Software remains relevant where products are consistent and deterministic operation is important. Image Processing and Analysis Software and Vision Application Development Software continue to support integrators and developers working across the wider vision ecosystem.



By Application: Quality Inspection Holds the Largest Base While Maintenance Gains Pace
Quality Inspection and Defect Detection accounted for 35.65% of the Vision analytics software for manufacturing market size in 2025. It is the core application that established many vision deployments in production settings. Electronics, food and beverage, and pharmaceutical plants use these systems to identify defects before products move further through the line. The application also creates image records that can support later quality reviews. Many Vision analytics software programs for the manufacturing market begin with defect detection and then extend to other production uses.
Predictive Maintenance is projected to grow at a 11.45% CAGR through 2031. Images collected for surface inspection can also reveal equipment conditions, such as alignment changes or robotic arm wear patterns. This allows manufacturers to use existing visual data for reliability work without adding separate sensor hardware. Process Monitoring and Optimization, Measurement and Metrology, and Identification, Classification, and Traceability can deepen engagement at each site. Worker Safety and Compliance is also relevant in regulated facilities where protective equipment practices require documented review.
By Deployment: Edge Systems Lead While Cloud Tools Support Governance
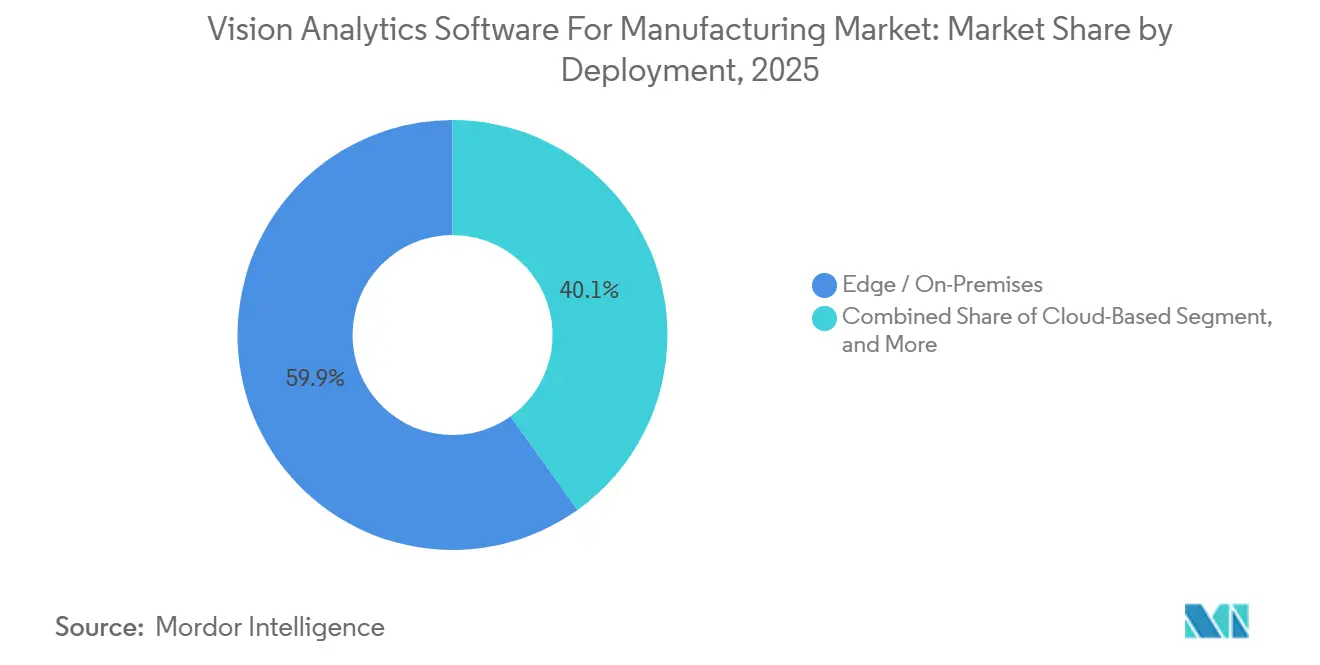
Edge/On-Premises deployment held 59.88% of the Vision analytics software for manufacturing market share in 2025. Local processing helps production lines make decisions with low latency. It also supports facilities that need to retain production information on-site. Semiconductor, pharmaceutical, and defense operations may have data-processing requirements that make local deployment important. Edge installations can therefore remain central in the Vision analytics software for manufacturing market, even as cloud tools become more capable.
Cloud-Based deployment is projected to expand at an 11.78% CAGR through 2031. Its main role is to centralize model training, version management, deployment management, and analysis across sites. Cognex stated that more than 100 manufacturers moved from single-line work toward multi-site OneVision rollouts after its June 2025 beta launch. The platform allows models to be developed and updated centrally while inspection runs on local In-Sight devices. Hybrid arrangements can help multi-site organizations seek consistent model performance while managing latency and data-sovereignty needs.
By Industry: Electronics and Semiconductors Lead Growth as Automotive Expands
Electronics and Semiconductors are projected to record the highest CAGR of 11.98% among industry verticals through 2031. Advanced-node production and complex semiconductor packaging increase the need for precise inspection. EV battery cell manufacturing also drives demand for Vision analytics software in the manufacturing market for detailed quality verification. The Vision Analytics Software for the manufacturing industry relies on these plants because small defects can affect yield, reliability, and compliance. Their requirements favor systems that can detect complex patterns and preserve production records.
Automotive and EV Batteries are another important contributor as OEMs implement inline vision for battery module assembly, body-in-white welding, and powertrain inspection. Atlas Copco stated that its Smart Verification with AI can check EV battery joining, sealing, and assembly steps for correctness, completeness, and tolerance compliance in real time. Food and Beverage, Pharmaceuticals, and Medical Devices have stable requirements for traceable inspection records. Aerospace and Defense, Industrial Equipment, and Machinery use these systems in smaller, high-value applications with demanding imaging conditions. Metals, Plastics, and Rubber remains less penetrated but can benefit where high product variety makes rule-based inspection less effective.
Geography Analysis
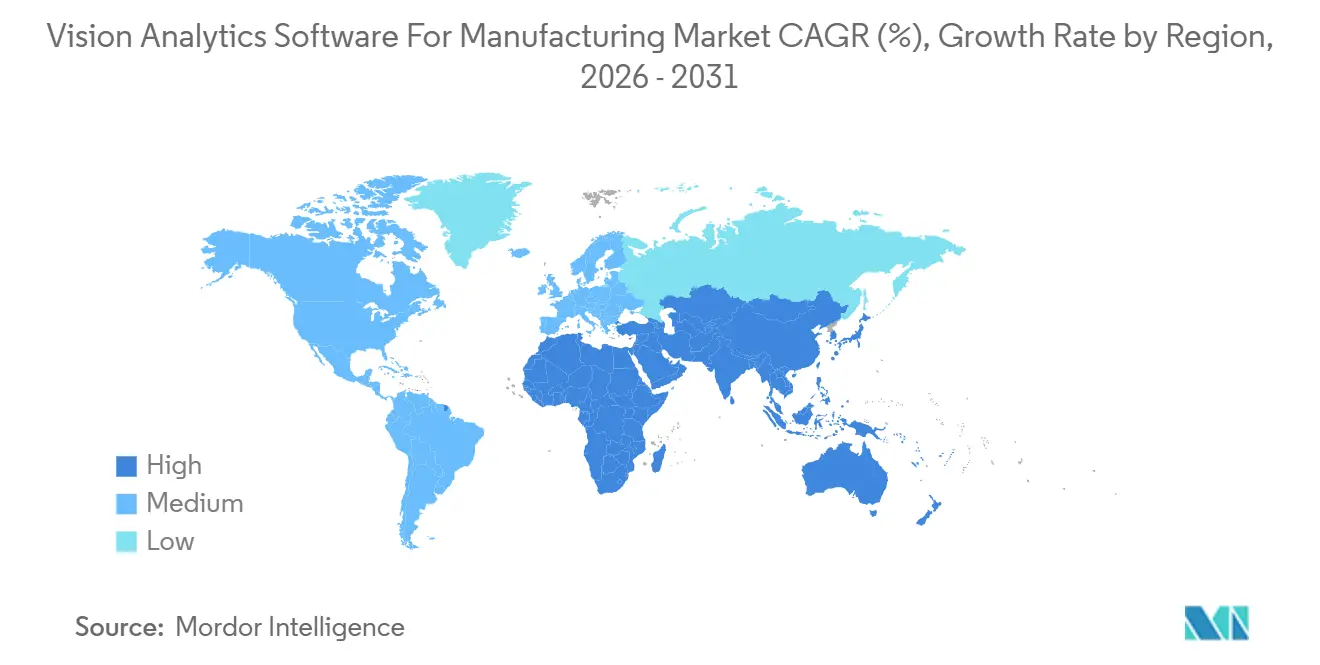
Asia-Pacific held 36.54% of the Vision analytics software for manufacturing market share in 2025 and is projected to grow at an 11.61% CAGR through 2031. China, South Korea, Japan, and India support regional demand through semiconductor fabrication, electronics assembly, and automotive production. Japan's Ministry of Economy, Trade and Industry and NEDO committed up to JPY 1 trillion (USD 6.6 billion) for physical AI infrastructure across fiscal 2026 to 2030.[3]Japan Ministry of Economy, Trade and Industry and NEDO, “AI Robotics Strategy and Frontier AI Infrastructure Initiative,” METI, meti.go.jp. South Korea's Ministry of Trade, Industry, and Energy launched the Manufacturing AI Transformation initiative to establish 500 AI factories by 2030 and develop 15 manufacturing AI models. Samsung announced KRW 60 trillion (USD 44 billion) of manufacturing-AI infrastructure investment across the Yeongnam region.
China's industrial clusters in Shenzhen, Chengdu, and Changzhou sustain substantial demand for vision analytics software in the manufacturing market, particularly in electronics production. India's expanding electronics manufacturing under the Production Linked Incentive scheme presents a growing opportunity as plants seek to meet export-grade quality standards. North America holds the second-largest regional share, supported by semiconductor capacity expansion, EV investment, and established smart-factory software infrastructure. The United States leads regional demand, while Canada and Mexico support automotive supply chains connected with U.S. OEMs. Greenfield projects can incorporate connected quality systems from the start and avoid some Vision analytics software for manufacturing market retrofit constraints.
Europe is led by Germany, the United Kingdom, France, Italy, and Spain, with automotive quality expectations extending across suppliers. The Cyber Resilience Act creates an additional platform-selection consideration for manufacturers managing connected digital products. South America, the Middle East, and Africa remain emerging areas for the Vision analytics software for manufacturing market. Brazil supports Vision analytics software for manufacturing market demand through automotive assembly, food processing, and agribusiness. The United Arab Emirates and Saudi Arabia are deploying related capabilities in industrial diversification programs, while South Africa and Egypt are entry markets for multinational vendors. Qatar has selective potential in petrochemical and materials processing, and Nigeria has a longer-term opportunity linked to industrial formalization and digital infrastructure.

Competitive Landscape
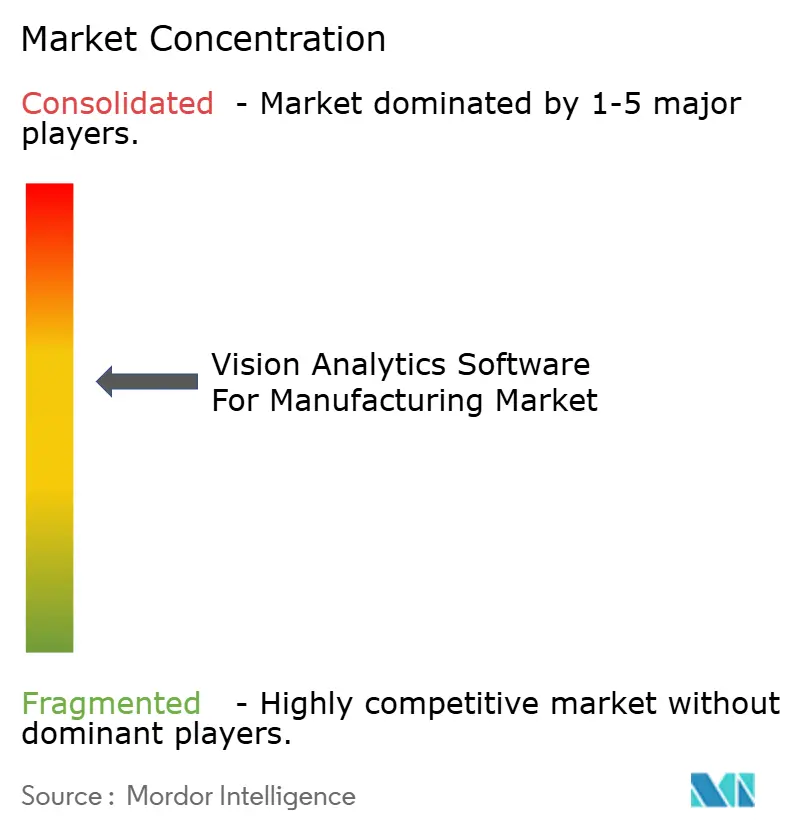
The Vision analytics software for the manufacturing market is moderately consolidated at the platform layer. Specialist vendors maintain strong positions in the Vision analytics software market for manufacturing, especially in general machine vision and semiconductor inspection. Infrastructure providers also compete through AI compute and cloud services that specialists can incorporate into their offerings. A division is developing between integrated vendors that control the inspection cell and software platforms that support heterogeneous camera hardware. The second group is relevant to Vision analytics software for buyers in the manufacturing market who cannot standardize hardware across all facilities.
KEYENCE launched the VS-G Series in June 2026 with a 32-core AI engine, processing speeds up to 13 times faster than prior-generation models, and built-in vision storage for visual traceability.[4]KEYENCE Corporation, “AI-Powered High-Performance Vision System, VS-G Series,” KEYENCE, keyence.com. The product supports local data management in facilities that may not use cloud-dependent architectures. Siemens and NVIDIA expanded their partnership in January 2026 to develop an Industrial AI Operating System, using Siemens Electronics Factory Erlangen as an adaptive manufacturing blueprint. This relationship joins Siemens software capabilities with NVIDIA computing infrastructure for Vision analytics software for manufacturing market deployments. It also increases the importance of ecosystem fit for competing platforms.
LandingAI stated that ABB Robotics made a strategic investment in September 2025 to integrate LandingLens visual AI capabilities into ABB Robotics software. The companies targeted up to an 80% reduction in training and deployment time through pre-trained models, intelligent data workflows, and no-code tools. This approach addresses the implementation burden that can slow Vision analytics software for manufacturing market integration-heavy projects. Security certification is also becoming more important where purchasers need industrial control systems to meet IEC 62443 requirements. Vendors that combine model performance, integration capability, and secure product design are better positioned for complex Vision analytics software for manufacturing market enterprise deployments.
Vision Analytics Software For Manufacturing Industry Leaders
Cognex Corporation
Keyence Corporation
Omron Corporation
Teledyne Technologies Incorporated
Basler AG
- *Disclaimer: Major Players sorted in no particular order

Recent Industry Developments
- August 2026: SICK AG launched AI-powered 3D quality inspection within its Nova machine vision platform, integrating deep learning algorithms with precise height data analysis to enable on-device training without additional external hardware. The solution targets electronics, battery manufacturing, automotive, and consumer goods inspection, extending SICK's sensor portfolio into AI-native software with an anomaly heatmap for real-time batch and process-line fault identification.
- July 2026: Mitsubishi Electric Corporation and Sony Semiconductor Solutions Corporation announced the establishment of Advanced Vision Solutions Co., Ltd., a joint venture scheduled to commence operations in October 2026, subject to regulatory clearances. The venture integrates Sony's image sensor and edge AI technologies with Mitsubishi Electric's factory automation capabilities to deliver AI-based visual analytics solutions for manufacturing sites previously difficult to monitor through conventional imaging.
- July 2026: KEYENCE Corporation launched the VS-G Series AI-Powered High-Performance Vision System with a 32-core AI engine, processing speeds up to 13 times faster than prior-generation models, and the industry's first built-in vision storage for 100% visual traceability directly on the controller. The system targets complete elimination of defect escapes and false over-detection through auto-tuning powered by accumulated production images.
- January 2026: Siemens AG and NVIDIA Corporation announced an expanded strategic partnership to build the Industrial AI Operating System, targeting the Siemens Electronics Factory in Erlangen, Germany, as the first fully AI-driven adaptive manufacturing blueprint starting in 2026. The partnership spans AI-native EDA, simulation, adaptive manufacturing, and supply chain, with NVIDIA providing AI infrastructure and Siemens committing hundreds of industrial AI experts.


Global Vision Analytics Software For Manufacturing Market Report Scope
The vision analytics software for the manufacturing market includes software solutions that use computer vision, artificial intelligence, and machine learning to analyze visual data from manufacturing processes. These solutions enable manufacturers to monitor product quality, detect defects, optimize operations, and improve workplace safety in real time. They integrate with cameras, sensors, and industrial systems to support data-driven decision-making across manufacturing facilities.
The Vision Analytics Software for Manufacturing Market Report is Segmented by Software Type (AI/Deep Learning Vision Analytics Software, Rule-Based/Traditional Vision Analytics Software, Image Processing and Analysis Software, Vision Application Development Software, and Other Software Types), by Application (Quality Inspection and Defect Detection, Process Monitoring and Optimization, Measurement and Metrology, Identification, Classification and Traceability, Predictive Maintenance, and Worker Safety and Compliance), by Deployment (Edge/On-Premises, Cloud-Based, and Hybrid), by Industry (Electronics and Semiconductors, Automotive and EV Batteries, Food and Beverage, Pharmaceuticals and Medical Devices, Aerospace and Defense, Industrial Equipment and Machinery, Metals, Plastics, and Rubber, and Other Industries), and by Geography (North America, South America, Europe, Asia-Pacific, Middle East, and Africa). The Market Forecasts Are Provided in Terms of Value (USD).
| AI / Deep Learning Vision Analytics Software |
| Rule-Based / Traditional Vision Analytics Software |
| Image Processing and Analysis Software |
| Vision Application Development Software |
| Other Software Types |
| Quality Inspection and Defect Detection |
| Process Monitoring and Optimization |
| Measurement and Metrology |
| Identification, Classification and Traceability |
| Predictive Maintenance |
| Worker Safety and Compliance |
| Edge / On-Premises |
| Cloud-Based |
| Hybrid |
| Electronics and Semiconductors |
| Automotive and EV Batteries |
| Food and Beverage |
| Pharmaceuticals and Medical Devices |
| Aerospace and Defense |
| Industrial Equipment and Machinery |
| Metals, Plastics, and Rubber |
| Other Industries |
| North America | United States |
| Canada | |
| Mexico | |
| South America | Brazil |
| Argentina | |
| Chile | |
| Rest of South America | |
| Europe | Germany |
| United Kingdom | |
| France | |
| Italy | |
| Spain | |
| Rest of Europe | |
| Asia-Pacific | China |
| Japan | |
| India | |
| South Korea | |
| Australia | |
| Rest of Asia-Pacific | |
| Middle East | United Arab Emirates |
| Saudi Arabia | |
| Qatar | |
| Rest of Middle East | |
| Africa | South Africa |
| Egypt | |
| Nigeria | |
| Rest of Africa |
| By Software Type | AI / Deep Learning Vision Analytics Software | |
| Rule-Based / Traditional Vision Analytics Software | ||
| Image Processing and Analysis Software | ||
| Vision Application Development Software | ||
| Other Software Types | ||
| By Application | Quality Inspection and Defect Detection | |
| Process Monitoring and Optimization | ||
| Measurement and Metrology | ||
| Identification, Classification and Traceability | ||
| Predictive Maintenance | ||
| Worker Safety and Compliance | ||
| By Deployment | Edge / On-Premises | |
| Cloud-Based | ||
| Hybrid | ||
| By Industry | Electronics and Semiconductors | |
| Automotive and EV Batteries | ||
| Food and Beverage | ||
| Pharmaceuticals and Medical Devices | ||
| Aerospace and Defense | ||
| Industrial Equipment and Machinery | ||
| Metals, Plastics, and Rubber | ||
| Other Industries | ||
| By Geography | North America | United States |
| Canada | ||
| Mexico | ||
| South America | Brazil | |
| Argentina | ||
| Chile | ||
| Rest of South America | ||
| Europe | Germany | |
| United Kingdom | ||
| France | ||
| Italy | ||
| Spain | ||
| Rest of Europe | ||
| Asia-Pacific | China | |
| Japan | ||
| India | ||
| South Korea | ||
| Australia | ||
| Rest of Asia-Pacific | ||
| Middle East | United Arab Emirates | |
| Saudi Arabia | ||
| Qatar | ||
| Rest of Middle East | ||
| Africa | South Africa | |
| Egypt | ||
| Nigeria | ||
| Rest of Africa | ||


Key Questions Answered in the Report
What is the size of the Vision analytics software for manufacturing market?
The market was valued at USD 2.17 billion in 2025, is estimated at USD 2.38 billion in 2026, and is projected to reach USD 3.99 billion by 2031 at a 10.89% CAGR. The forecast reflects broader use of image-based quality control across factory operations.
What is driving adoption of vision analytics software in manufacturing?
Zero-defect requirements, electronics and semiconductor inspection, EV battery traceability, and workforce shortages are increasing adoption. Brownfield connectivity and secure software architecture also affect project decisions.
Which software type is growing fastest through 2031?
AI/Deep Learning Vision Analytics Software is projected to record an 11.32% CAGR through 2031. Self-supervised training and local AI processing support its use in complex inspection settings.
Why do manufacturers use edge deployment for visual inspection?
Edge deployment supports low-latency decisions and local data processing, which are important for production-line control and restricted environments. It remains important in semiconductor, pharmaceutical, and defense operations.
Which application has the largest share of demand?
Quality Inspection and Defect Detection accounted for 35.65% share in 2025. It commonly provides the starting point for later expansions into maintenance and safety uses.
Page last updated on:


 Your data is secure and never sold or shared.


