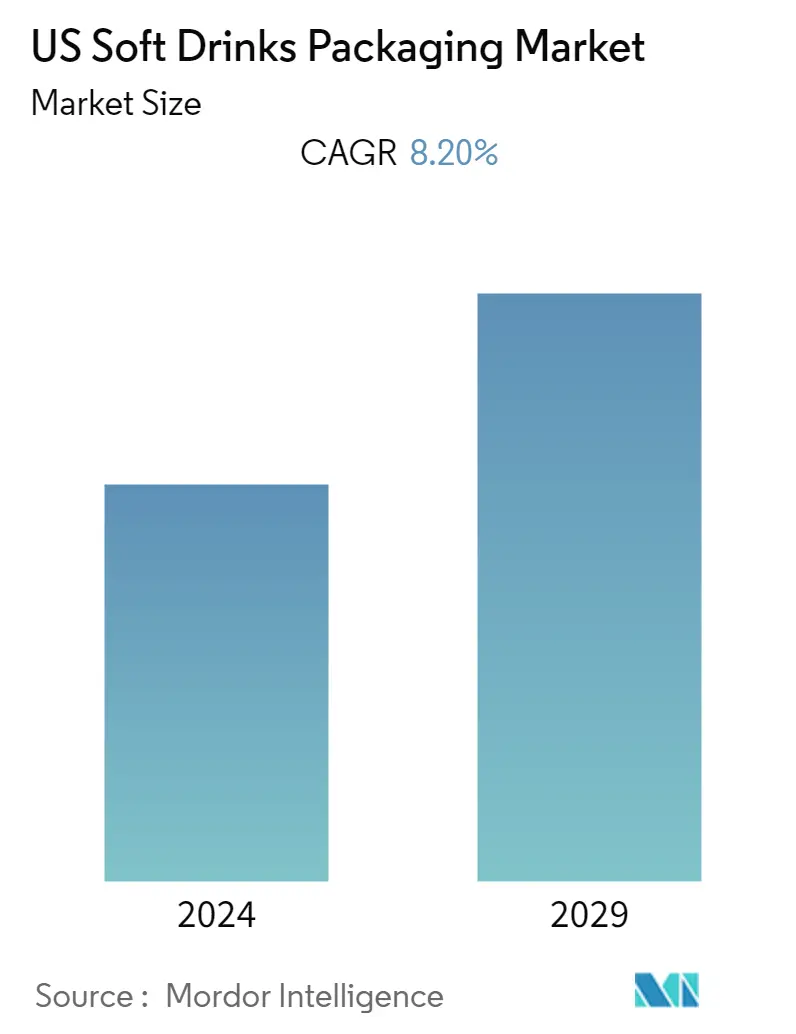
Market Size of US Soft Drinks Packaging Industry
| Study Period | 2019 - 2029 |
| Base Year For Estimation | 2023 |
| Forecast Data Period | 2024 - 2029 |
| Historical Data Period | 2019 - 2022 |
| CAGR | 8.20 % |
| Market Concentration | Low |
Major Players
*Disclaimer: Major Players sorted in no particular order |
Need a report that reflects how COVID-19 has impacted this market and its growth?
US Soft Drinks Packaging Market Analysis
The United States Soft Drinks Packaging Market is expected to grow at a CAGR of 8.2% over the forecast period (2022 - 2027). The COVID-19 pandemic harmed the soft drinks packaging market. The pandemic leads to disruptions in the supply chain in the country. Further, the solid recessionary effect and wellness and health priorities in the post-pandemic era will negatively affect the industry.
- Driven by consumer desire for a healthier lifestyle, bottled water will overtake carbonated soft drinks as the leading packaged beverage of choice among U.S. consumers. With trends toward healthier beverages threatening the growth of carbonated soft drinks, finding new and innovative ways to get consumers to buy through packaging stimuli will be crucial for packaging manufacturers and brand owners. However, the cost will still be the key ingredient to any new packaging feasibility.
- Every segment of the bottled water industry is growing, and bottled water is considered the most successful mass-market beverage category in the U.S. Single-serve PET plastic bottled water outperformed all other beverage categories, posting another significant rise.
- Further, bottled water outsells retail soft drinks in 17 major cities, including New York, Boston, Los Angeles, San Francisco, Las Vegas, Houston, Miami, and Washington D.C. Overall, soft drink consumption declines. More cities are projected will join the list.
- The majority of carbonated soft drinks are sold in aluminum cans and PET bottles. They are also sold in bulk in the foodservice industry through soda fountains. Only a tiny portion of CSDs are still packaged in glass bottles. These are usually packaged in smaller sizes due to changing consumer preferences and lifestyles and increased costs associated with transporting heavy, low-volume glass containers versus high volume-to-packaging ratio PET bottles and aluminum cans.
- Moreover, soft drinks are the second most-consumed drink after water, with plastic being the most used material for soft drinks packaging. Many beverage companies favor plastic packaging material for bottled beverages due to its lightweight, durability, and cost-efficiency.
- Further, carbonated soft drinks are usually packaged in aluminum cans. The COVID-19 pandemic impacted the supply of these cans in the early months of the pandemic, which highlighted the limitations of these cans. The can shortage made carbonated beverage producers look for new packages, specifically all forms of aseptic, enabling a long ambient shelf life.
